The Effect of School Services Disruptions on Educational Outcomes After Consecutive Disasters in Puerto Rico
Executive Summary
Puerto Rico was impacted by consecutive disasters in the last four years, each time severely disrupting school services. In September 2017, Hurricane Irma passed just north of the island, damaging the eastern and northern coasts. Two weeks later, Hurricane Maria moved through the island, forcing all public schools to close. On January 7, 2020 a magnitude 6.4 earthquake and a series of aftershocks significantly delayed the spring semester's start for students enrolled in the public system. By March 16, 2020, when there were still some schools closed, the government ordered a school lockdown to mitigate the COVID-19 pandemic's effects. Our research objective was to describe how school service interruptions related to Hurricane Maria and the 2020 earthquake sequence affected academic achievement and educational outcomes especially among vulnerable populations.
Reasearch Questions
The research questions we addressed in the first stage of the project were:
- Has the public school system student vulnerability profile changed after the disasters? Are there any changes in the proportion of students enrolled in special education programs? Are there any changes in poverty prevalence among students at the municipal or regional level?
- Did academic achievement in standardized tests correlate with the severity of Hurricane Maria’s impact across geographic regions? Do any of these effects vary according to personal vulnerability of students or for students whose schools were permanently closed due to the hurricane?
- Does the probability of school attrition post-Hurricane Maria and post-earthquake vary according to the degree of impact?
Research Design
Data sources include Puerto Rico's Department of Education Student Information System (PRDE -SIS) 2014-2021, PRDE-SIS META test data 2016-2019 and, OpenFema Data–Housing Assistance Program Data. To identify Hurricane Maria's effect on academic achievement, we used a “difference in differences” (DD) approach. A duration analysis was used to measure the effect of Hurricane Maria and the earthquake on the probability of dropping out of school. Students enrolled in the 2017–2018 academic year were categorized as belonging to one of three groups depending on the level of damage from Hurricane Maria reported to the Federal Emergency Management Agency (FEMA) by households in each municipality (high, medium, or low impact). Likewise, students enrolled in 2019-2020 were grouped according to whether their school's municipality reported high, medium, or low damages for the January Earthquake.
Preliminary Findings
Overall, public-school students in Puerto Rico showed extremely high vulnerability levels. Close to 80% of public-school students in Puerto Rico lived in families with incomes below the poverty level. Nearly 30% of public-school students reported at least one disability that affects their learning. Only about 16% of public-school students in Puerto Rico were neither impoverished nor disabled. Twenty-five percent of public-school students were both poor and report at least one learning-related disability.
We found that standardized test scores for students enrolled in 2017–18 in municipalities highly impacted by Hurricane Maria experienced a significant decrease compared to other groups. Vulnerable students (by poverty or disability) in medium and high-impact municipalities have experienced an additional reduction in test scores as students whose schools closed permanently due to damage caused by Hurricane Maria.
After Maria, the dropout risk was 18% higher for eighth graders in the medium-impact group. Contrary to expectations, tenth graders in the high-impact group were less likely to drop out after Maria. Following the earthquake, the dropout risk for eighth graders in the municipalities most impacted by the earthquake was twice as high as for the less affected group. While among tenth graders, the dropout hazard risk was significantly higher for students in the medium impact group.
Conclusion
Overall, we found that Hurricane Maria had a moderate but significant adverse effect on academic achievement. This effect was heightened among impoverished and disabled students in highly and moderately impacted municipalities. Overall, we see that eighth graders seem to be more adversely affected by disasters than tenth graders. The dropout risk analysis provokes interesting questions since some students in municipalities that suffered medium impact from disasters present a higher dropout risk than their peers in highly impacted areas.
The challenges of providing reliable, safe, and effective public education during disasters should not be underestimated. This is particularly true for a public school system where 80% of students live with incomes below the poverty line, close to 30% report at least one documented disability, and about 25% faces both vulnerability conditions. Our results indicate that the length of school interruption and the degree of impact from a disaster increases adverse academic effects. Therefore, schools should focus on restoring services as quickly as possible especially for the most vulnerable students. We present some specific recommendations to achieve this goal and increase schools’ capacity to fulfill basic needs, deal with emotional stress, and address academic needs in the communities they serve.
Introduction
Disasters have been found to have a strong emotional, behavioral, and academic impact on children (Pane et al., 20081; Gibbs et al., 20192; Gomez & Yoshikawa, 20173). Lai et al. (20174) and Bonanno et al. (20105) state that there is consensus among researchers that children are more likely than adults to develop post-traumatic stress disorder (PTSD) after a disaster. According to Bonanno et al. (2010), adolescents, younger children, and females are more at risk of PTSD. Bonanno et al. (2010) also found evidence that substance abuse among adolescents increases following a disaster. These health problems may have long-lasting effects and negatively impact academic performance. A lack of social and family support also appears to increase the risk of chronic PTSD. The authors cited above describe social support networks (including parents, teachers, and friends) as major protective factors that are essential for coping success. These findings highlight the importance of disaster preparedness and interventions explicitly geared to children and youth. Children with multiple vulnerability factors, such as disabilities or low socioeconomic status, are the most likely to suffer substantial losses due to disasters. Also, cumulative disaster exposure creates complex dynamics between socioeconomic conditions and the ability to recover (Mohammad & Peek, 20196).
Recent studies have shown the importance of place attachment in shaping children's well-being, emotional regulation, identity development, and self-esteem in the home, school, and other post-disaster contexts (Fletcher et al., 20167). Schools play a central role in providing emotional support services, social networks, and a connection to the broader community (Peek et al., 20188). Fothergill and Peek (20159), studying children after Hurricane Katrina found that schools played a crucial role in their recovery from the disaster. According to Mooney et al10. (2020), schools can be a source of security, hope, and connectivity after a disaster. If schools close and support services are interrupted we should expect that student well-being will be compromised.
Impacts of Disasters on Educational Outcomes
In general, the literature points to a decline in the academic performance of students after disasters. In wealthier countries, there are slight reductions in academic achievement levels due to school interruption. In developing countries, declines in academic performance were related to significant increases in child labor due to the economic ravages that accompany disasters (Kousky, 201611). For example, Takasaki (20174) finds reductions in male secondary school enrollment among farming families after a disaster. Similarly, Crespo Cuaresma, 2010, 12 finds that geological disasters reduce participation in secondary school, although the effect was not robust for other disasters that were more predictable.
Gibbs et al. (2019) found that primary school students academic performance in math and reading tests was affected by wild fires in Australia. Likewise, Nguyen & Pham (201813) found that natural hazards had a negative effect on children's academic performance and cognitive ability especially those exposed to floods. These authors argue that household economic losses and adverse effects on children's health were primarily responsible for the outcome. Recent evidence on the effect of the COVID-19 pandemic on educational outcomes points to smaller gains in academic abilities in fall 2020 compared to the pre-pandemic year especially on math skills. Also, student attrition rates were significantly higher in fall 2020 than the previous year (Kuhfeld et al., 202014).
Few studies emphasize the consequences of disasters on the educational outcomes of children with disabilities. Educational vulnerability for children with disabilities increases during disasters. Some of the reasons include inadequate school infrastructure to offer them services, loss of emotional support from teachers, the students’ high sensibility to having their routines disrupted, and the loss of documents making assessments difficult (Peek & Stough, 201015). McAdams Ducy & Stough (201116) also highlight some consequences of educational service interruptions, like medical and educational service needs, the possible loss of assistive equipment, and academic, social, and life skills lost. Teachers can play an essential role in students' recovery by creating a sense of normalcy and security, monitoring the recovery process, providing resources and information, and restoring students' routines. (McAdams Ducy & Stough, 2011; La Brocquem et al., 201717).
Recent studies find negative effects on academic achievement from permanent school closures (Brummet 201418; Engberg et al. 201219; Rumberger & Larson 199820). Puerto Rico closed 34% of its public schools between 2017 and 2019. In general, displaced students fared worse than non-displaced students on standardized tests. This effect persisted two years after relocation (Caraballo-Cueto, 202021). However, the literature on permanent school closures after a disaster is scarce. Sacerdote (201222) examined the effect on students forced to leave school due to Hurricane Katrina and found that those who relocated to better school districts made up substantial ground after three years. Richardson (200523), however, found that after Katrina, most of the displaced students in her sample performed worse in their new school than in the previous one.
Research Design
The project was divided into two phases. Phase one included the quantitative analysis of administrative data, while phase two is an ongoing qualitative analysis consisting of interviews with school personnel. This report shows the results of phase one. The research questions we addressed in this project were:
- Has the vulnerability profile for public-school system students changed after the disasters affecting Puerto Rico? Are there any changes in the proportion of students enrolled in special education programs? Are there specific conditions that have changed due to the combined effects of disasters between 2016 and 2020? Are there any changes in poverty levels among students at the municipality or regional level?
- Does student academic achievement in standardized tests post-Hurricane Maria vary according to the degree of the storm’s impact? Do any of these effects vary according to personal vulnerability?
- Was the academic achievement of students whose school permanently closed due to the hurricane disproportionally affected compared to similar students whose schools did not close permanently?
- Does the probability of school attrition post-Hurricane Maria and post-earthquake vary according to the degree of damage caused by the disasters?
Data
The data sources were:
Puerto Rico Department of Education Student Information System (PRDE–SIS) socioeconomic data: The Puerto Rico Department of Education (PRDE) collects data on student demographics, including their gender, poverty status, ethnicity, and whether they have disabilities such as autism, deafness or blindness, developmental delays, emotional disturbance, hearing impairment, intellectual disability, multiple disabilities, orthopedic impairments, specific learning problems, speech or language impairment, trauma related brain injury, or visual impairments.
PRDE-SIS META results data: Academic performance was measured using Puerto Rico's standardized achievement test (META) for Mathematics, English, and Spanish. Students take this test in the third to eighth and 11th grades. META classifies student achievement using a four-level scale: pre-basic, basic, proficient, and advanced. We transformed these categories into a numeric variable, using a scale from one to four, where one was equivalent to pre-basic level and four to advanced. The scores for the three subjects are then averaged to obtain the student's META scoreEndnote 1.
PRDE-SIS exit data: This data includes the reason that students left the public school system. The most recent data was from March 30, 2021.
OpenFema Data – Housing Assistance Program Data – Owner data set: It includes information from the Federal Emergency Management Agency (FEMA) regarding damages and amounts paid. The data was broken down by disaster and location.
Methods
Highly Impacted Municipalities
Identifying the specific effects of Hurricane Maria and the earthquakes required examining the degree of damage that both events caused at the municipal level and determining the municipalities most affected by each eventEndnote 2. We used data from OpenFema Housing Assistance Program Data–Owner data set. Information was aggregated by disaster number and municipality.
The area covered by an emergency declaration varies according to the impact of the disaster. For Hurricane Maria (disaster declaration #4339), all municipalities were included for Individual and Public Assistance (Categories A-G). Emergency Declaration #4473 was issued to cover the losses from the January, 2020 earthquakes. All areas within Puerto Rico were eligible for FEMA’s Hazard Mitigation Grant Program, but only 33 municipalities were eligible for individual assistance. Eighteen of those municipalities were also eligible for public assistance.
Using the OpenFema-Owner data set, the Puerto Rico Community Survey (PRCS), and the Census Bureau Vintage Puerto Rico Municipios Population Totals 2010-2019Endnote 3, we created three variables related to disaster damage by municipality for each emergency declaration. They were: (1) percent of households whose inspected damage was greater than $10,000, (2) percent of households that received a financial grant from FEMA greater than $10,000, and (3) per capita Individual Home Program amount. Two disadvantages of this data were that they exclude non-homeowners and localities with higher home value may also have higher damage dollar amounts. However, Homeland Security Operational Analysis Center (202024) indicates that accounting for those factors does not significantly affect the measure of relative damage.
The three variables were normalized using the min-max normalization technique. A principal component analysis (PCA) was used to evaluate whether the three variables correspond to one component that can be a composite indicator of damage from each disaster. As expected, the correlation between the FEMA variables for each disaster was remarkably high. The PCA analysis confirms that all three variables belong to the same component, and they received similar loading. In this case, using the component score or using a simple average of the three normalized variables resulted in the same groupings.
We created a dichotomous variable for “Municipalities Highly Impacted by Hurricane Maria,” defined as those municipalities with a composite indicator for disaster 4339 one standard deviation higher than the mean for all municipalitiesEndnote 4. Municipalities with a composite indicator within one standard deviation of the mean were categorized as the medium impact group, and municipalities with an indicator one standard deviation or more below the mean constituted the least affected group. There were 14 municipalities highly impacted by Hurricane Maria located in the eastern and central part of the island as shown in Figure 1Endnote 5.
Figure 1. Impact Level of Hurricane Maria on Municipalities in Puerto Rico
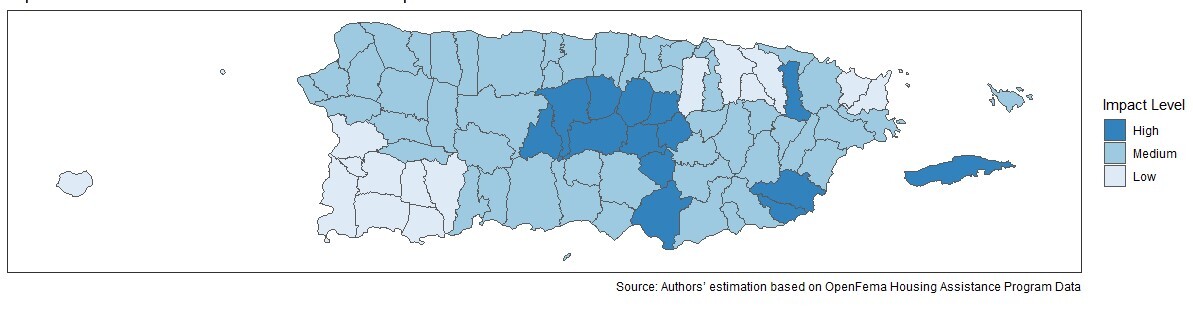
Similarly, municipalities highly impacted by the January earthquakes were those with a composite indicator for disaster 4473 that was one standard deviation above the average for the 33 municipalities that qualified for individual assistance. Three municipalities showed an impact significantly higher than the rest. These were Guayanilla, Guánica, and Yauco. The medium-impact group was composed of the other 30 municipalities that qualified for individual assistance.
Effect of Disasters on Student Vulnerability Profiles
Using SIS socioeconomic data, we analyzed changes in public-school students' disability status and income/poverty statusEndnote 6. We looked for changes in selected reported conditions between 2014 and 2020 and whether those changes could be the result of disasters.
Effect of Hurricane Maria on Academic Achievement
To identify Hurricane Maria's effect on academic achievement, we used two approaches: “differences in differences” (DD); and “propensity score matching” (PSM). The analysis uses the DEPR-SIS that expands from the school year 2015–16 to 2018–19. The students' socioeconomic data was merged with the data file containing information on META results. We obtained an unbalanced panel data set. Table 1 includes the average student's META score per year. The DD estimated a particular treatment effect as the differences between the change in outcome for the treated and the control group after treatment. In a regression framework, additional independent variables can be added to account for differences in the groups' composition. The treatment was estimated as the parameter β in the following equation.
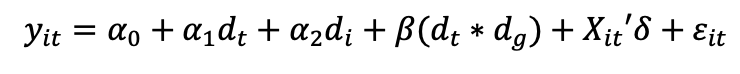
Where, dt is equal to one if the observation corresponds to the post-treatment period and zero otherwise; dg is equal to one if the observation corresponds to the treatment group and zero otherwise; and Xit is a vector of characteristics corresponding to observation i in period t.
In our case, the main treated group was students enrolled in a school located in one of the municipalities highly impacted by Hurricane Maria during 2017–2018. From here on, we refer to this group of students as Group 1Endnote 7. Because Hurricane Maria had a widespread impact on the island, we created an alternative specification which included two treated groups. Group 2 includes students enrolled in municipalities that suffered medium impact from the hurricane. Since META tests were administered during the second semester of the school year, results for 2017–18 and 2018–19 correspond to the post-hurricane period. Additional interactions between groups and the variables time, poverty, and disability status were included to examine disaster effects among the most vulnerable populations. If Hurricane Maria had a negative effect on student achievement, we expected to find a negative treatment effect especially for students included in Group 1.
We used a panel data framework, which can be significantly biased by non-random attrition. Our panel's attrition comes from students who graduated, students who dropped out of school, students being promoted to grades that do not take the META exams Endnote 8, and those who left the public school system to move to a private school or migrated outside Puerto Rico. The decision to drop out of school was expected to be related to academic achievement. However, high levels of migration was related to the degree of hurricane related damage a person faced. Therefore, attrition can be anticipated to be non-random and attrition bias had to be addressed.
As suggested by Cheng & Trivedi (20159), we used the Heckman-copula (HC) maximum likelihood estimation for sample selection models proposed by Hasabe (201325) to correct for panel attrition bias. This framework allows correcting for sample selection by assuming a fully parametric copula based approach. The estimation requires specifying the marginal distributions for the attrition and the META scores variables and selecting a specific copula to generate a joint distribution. The models can be estimates under different assumptions, and a post-estimation analysis can be used to determine the preferred specification. We estimated various DD models using two different attrition definitions, with and without exclusion restrictions, and seven different copula specifications. A preferred model was selected according to the Akaike Information Criterion (AIC), as suggested by Hasabe (2013)Endnote 9. Our results were consistent across different specifications.
Another way we avoided sample attrition problems was by using only post-treatment observations and PSM to estimate the effect. The PSM was applied when measuring a treatment effect using only post-treatment data. It compares the outcome for observations in the treatment groups with similar observations from the control group, using covariates to match them. Therefore, it identifies whether the META scores for students in the treatment group were significantly different from those in the control groups. This method only considers one treatment group and does not measure other covariates' effects or their interrelation. Nevertheless, it was a helpful robustness check on our results.
In addition to the substantial number of public schools closed due to austerity measures, 22 schools closed during 2017–2018 due to Hurricane MariaEndnote 10. We addressed whether students whose schools closed due to the hurricane had more academic difficulties than the rest of the student body. The dependent variable was the interannual changes in META test scores. We were not trying to explain whether some students did better than others in absolute terms or measure the total academic achievement of each student. Instead, we measured whether students performed worse than they did during the previous time period. If external factors affected the average score META test score every year it would be difficult to establish interannual variations in the average academic performance of all students. We performed two OLS estimations for students that took the META test to measure whether the change in average META score from 2017 to 2019 was significantly different for students enrolled in the 22 closed schools after Hurricane Maria (the treatment group in this case) and all other students. For this analysis we controlled for the covariates age, number of family members, poverty level, sex, and whether the student attends a school in a main productive municipality (as defined in Caraballo-Cueto, 201726)Endnote 11. Descriptive statistics are included in Table 2.
Findings
Effect of Disasters on Student Vulnerability Profiles
Table 3 shows the total number of public-school students and the proportion of students below the poverty threshold from 2014 to 2020. The student population declined significantly during that period, from 410,950 in 2014 to 276,413 by 2020, or a 32.7% decrease in the total number of students. Meanwhile, the number of students below the poverty level decreased by 31.9% for the same period. A reduction in Puerto Rico’s population of school-aged combined with increasing outmigration from the island over the last decade produced a significant decrease in the public-school student population. The number of students enrolled in elementary school as a percentage of total enrollment in the public school system dropped from 51% in 2014 to 49% in 2020.
The percentage of female students has remained at 49% throughout 2014–2020. Around 80% of students in the public school system have a family income below the poverty level. The poverty percentages, however, decrease with grade level. The pattern suggests that the proportion of students living below the poverty level decreased from 80.8% in 2014 to 77.2% in 2017, the year of Hurricane Maria, and then increased to 81.9% by 2020. We can observe the U-shaped pattern in Figure 2 and note how the poverty level in 2020 was even higher than the poverty rate in 2014.
Figure 2. Percentage of Students Below Poverty Level by Academic Year
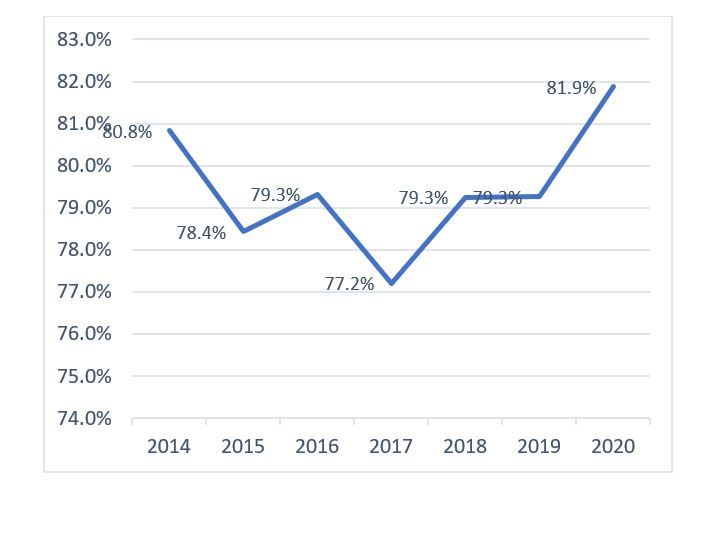
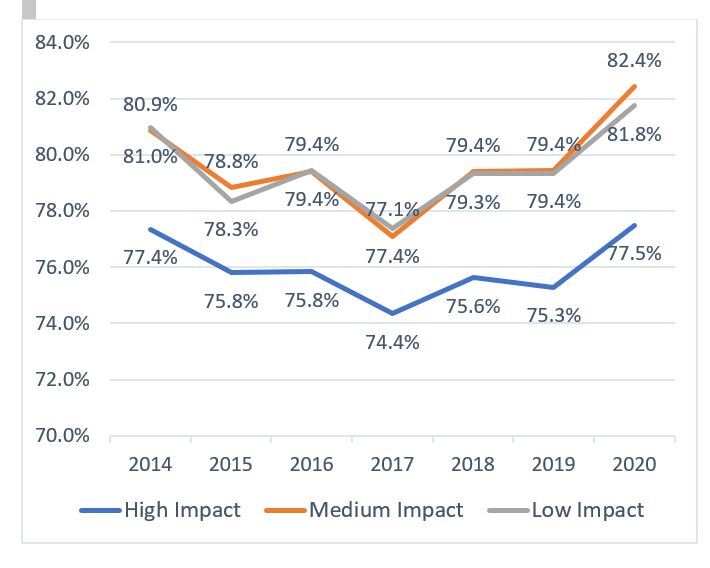
Figure 3 shows changes in the proportion of students living below the poverty level over time by municipal clusters. The first cluster includes municipalities that received a high impact from Hurricane Maria; the second cluster contains municipalities that experienced medium impacts, and the third cluster includes municipalities that suffered only a low impact. It was essential to highlight that all municipalities were affected by hurricanes Irma and Maria. However, the extent of the devastation and the time it took to reestablish services showed some variation.
Figure 3. Poverty Level Before and After Hurricane Maria by Municipal Clusters, 2014–2020
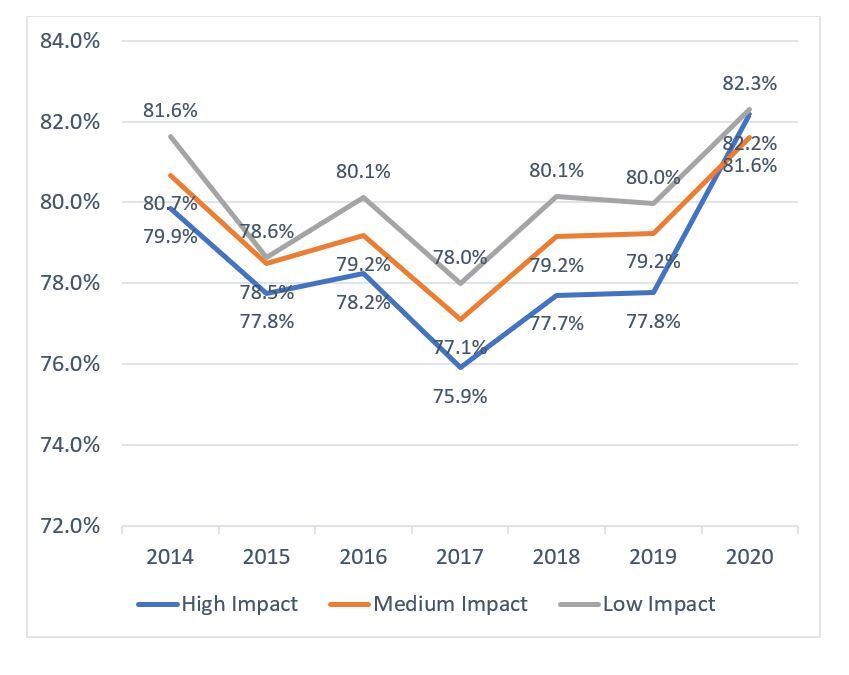
As shown in Figure 3, there was an inverse relationship between students' poverty level and the level of impact from Hurricane Maria by municipality. The observed pattern of decrease in poverty between 2014 and 2017 and a subsequent increase between 2017 and 2020 was observed among the three municipality clusters. Data shows how the municipalities that experienced the highest impacts from hurricanes Irma and Maria saw the sharpest increase in student poverty levels between 2017 and 2020. The poverty rate for municipalities in the high-impact group was almost 2.7 percentage points lower in 2014 (79.9%) than for municipalities in the low-impact group (81.6%). Still, by 2020 both groups had essentially the same poverty rate at 82.2%.
The impact of the 2020 earthquakes on student poverty levels, as seen in Figure 4, was less evident by municipality clusters. The observed increases in poverty level, particularly between the 2019 and 2020 academic years, were slightly higher for municipalities with medium and low impact than the municipalities with the highest impact from the 2020 earthquakes.
Figure 4. Poverty Level Before and After Earthquake by Municipal Clusters, 2014–2020
Next, we examined changes in the proportion of students reporting any disability over time by sex. The results are presented in Table 4. The proportion of public-school students reporting a disability remained relatively stable between 2014 and 2020 at between 28.9% and 30.3% of the total. For that same period, we observed that a significantly higher proportion of males reported at least one disability. The data suggests that more than one in three male students and about one in five female students reported at least one disability. These proportions have been consistent throughout the period.
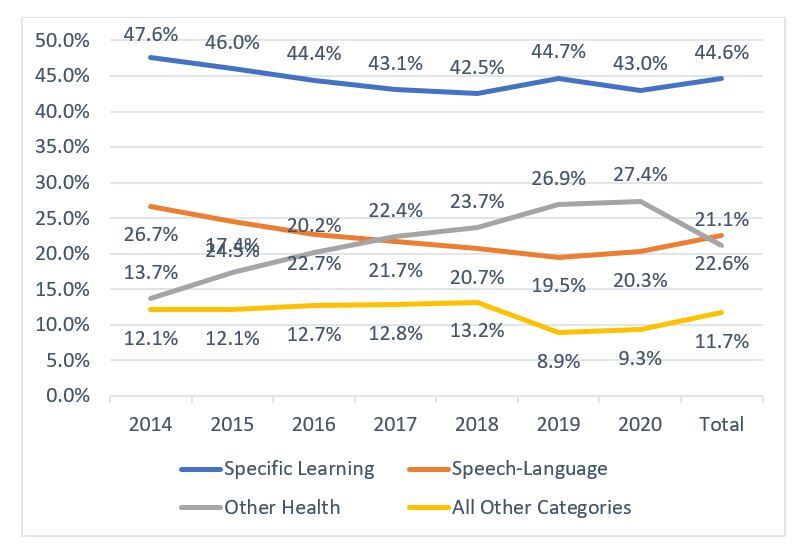
There have been some minor changes in the proportion of students reporting selected types of disabilities between 2014 and 2020. The most reported disability among public school students in Puerto Rico was specific learning challenges (44.6% overall), followed by speech or language difficulties (22.6%). Other health issues were reported by 21.1%, and a relatively small percentage of cases reported health-related mental problems (4.1%), autism (4.3%), emotional challenges (1.3%), auditory or visual impediments (.9%), multiple impediments (.9%), and brain or orthopedic disabilities (.3%).
We observed how the proportion of students reporting specific learning challenges, speech and language impediments, and all other categories decreased slightly over time. In contrast, the proportion of students reporting other health challenges increased significantly. In the last academic year, it rose from about one-in-five students reporting a disability to about 1.3 in ten in the baseline academic year 2014. Figure 5 presents the proportion of students reporting specific learning challenges, speech and language impediments, other health challenges, and all other categories combined.
Figure 5. Students Reporting Combined Disability, 2014-2020
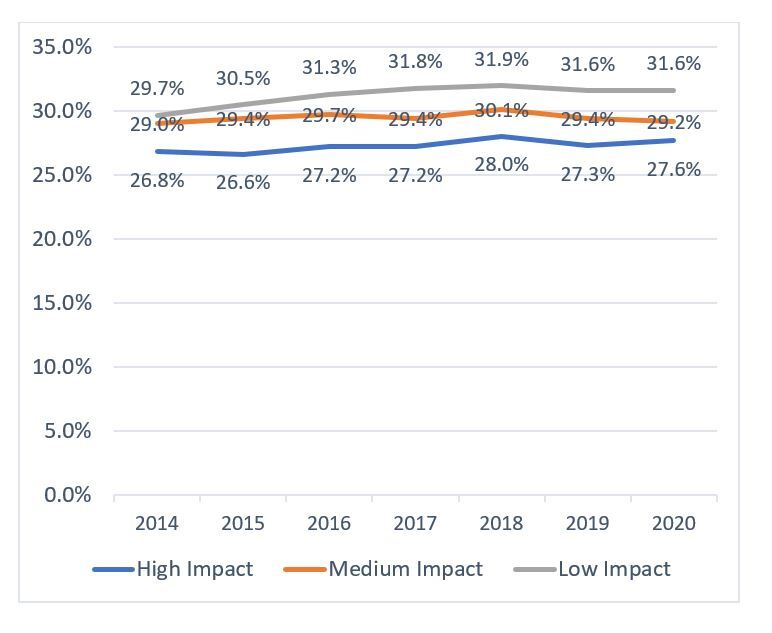
As shown in Figure 6, there was an inverse relationship between the proportion of students reporting a disability and the impacts of Hurricane Maria by municipality cluster. The pattern over time was similar for all three clusters suggesting that while the overall trend was slightly higher, there does not appear to be a clear relationship between the impacts of Hurricane Maria and increases in the proportion of students reporting a disability.
Figure 6. Students with Reported Disability Before and After Hurricane Maria by Municipal Cluster, 2014-2020
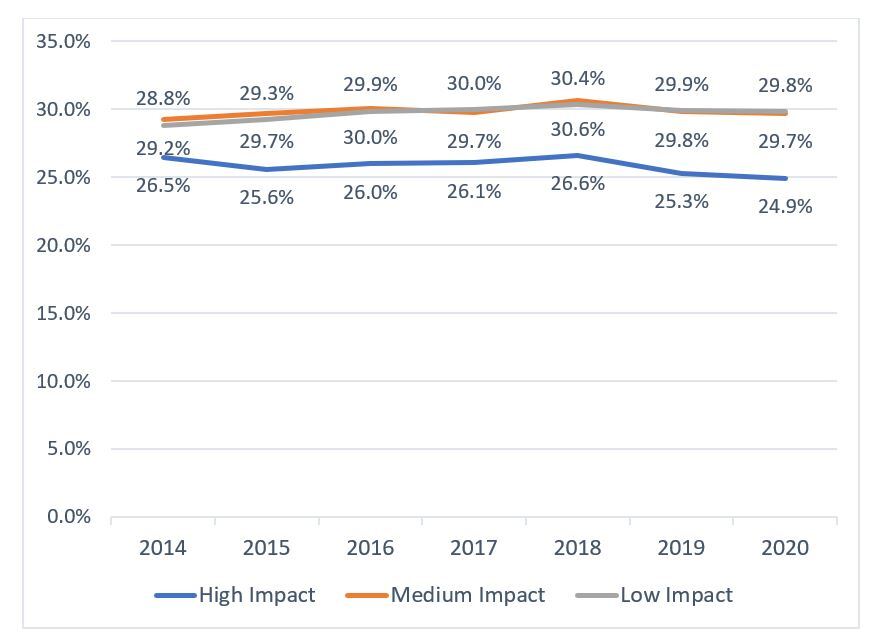
Likewise, Figure 7 shows that municipalities with low and medium impacts during the earthquakes had a higher proportion of students reporting a disability than municipalities with higher earthquake impacts. The pattern of changes between 2014 and 2020 was similar across the three municipality clusters. In fact, the gap between municipality clusters seems to be slightly larger in 2020 compared to 2014 suggesting that there was not a relationship between earthquake damage in the 2019–2020 academic year and the increase in the proportion of students reporting a disability in 2020–2021.
Figure 7. Students with Reported Disability Before and After Earthquake by Municipal Cluster
While the proportion of students reporting a disability did not increase significantly based on exposure to Hurricane Maria or the 2020 earthquakes, it is essential to point out that the overall profile of public-school students in Puerto Rico shows exceptionally high levels of vulnerability due to poverty, disability, and their combined effects. Close to 80% of public-school students in Puerto Rico live in families with income below the poverty level, and around 30% of public-school students report at least one disability that affects their learning. Overall, as shown in Table 5, only about 15.7% of students in Puerto Rico's public school system were neither poor nor disabled. In contrast, about 4.9% of the students in Puerto Rico's public education system were not poor but were disabled; 54.7 were poor and not disabled, while 24.7% of the public-school students were poor and report at least one learning related disability.
Effect of Hurricane Maria on Academic Achievement
The results of the DD estimation, shown in Table 6, used the Heckman-Copula (HC) models to correct for attrition bias. Since the Wald test statistic has a p-value smaller than 0.05, the assumption of independence between the attrition and the META scores regression was rejected. Therefore, selection correction was required. The first two models define only one treatment group (students enrolled at the time of the hurricane in highly impacted municipalities), while the last two models include both treatment groups. The treatment effect for Group 1 was negative and significant in three of the four models. The average score for Group 1 reflects a 3% reduction in relation to the entire sample. When we include the length of school interruption in the analysis, the size and significance of the treatment effects for Group 1 decreased suggesting that the negative effect on academic achievement in highly impacted municipalities was partly related to the amount of time the schools were closed. The treatment effect for Group 2 was not significant. Models HC3 and HC4 show that post-Maria META scores decreased for students with disabilities and students living in poverty regardless of whether they were included in one of the treatment groups. Puerto Rico's dire fiscal conditions and school closings had been affecting the school system prior to hurricanes Irma and Maria, so we might expect those to impact the vulnerable student populations. Nevertheless, students in vulnerable populations in both treatment groups experienced an additional reduction in META scores of approximately 3% to 4%. The coefficients for the additional independent variables had the expected effect.
The PMS results presented in Table 7 confirmed the negative impact of Hurricane Maria on META scores for students in treatment Group 1. However, the magnitude was smaller than the estimated from the HC results. The table presents the average treatment effect (ATET). The models were estimated using the last two years of data both grouped and individually. Models PMS 4–6 add the length of school interruption as a covariate. Doing so reduces the ATET by 22% for observations in 2018 and 62% for observations in 2019. Models PMS7-9 and PMS 10–12 repeated the analysis limiting the sample to students living in poverty or students with disabilities respectively. We measured the size of the ATET as a percentage of the average META score for each model. The treatment effect size ranges between -1.5% and -2.5% for the entire sample, -1% to -1.2% for students living in poverty, and -2.1% to -3.2% for students with disabilities.
We also found that students who suffered a school closure because of Hurricane Maria had lower academic achievement than the rest (Table 8). This decline in academic achievement fluctuated between 14% and 20% of the average change in score.
Effect of Disasters on Dropout Rates
The hazard ratio measured the group's relative dropout hazard risk. A ratio greater than 1 implied that the group was more at risk, while a ratio of 1 or less suggests a lower risk of dropout. Table 9 presents the results for the Cox and Weibull duration model regressions for the four cohorts. Figure 8 illustrates the cumulative hazard functions for each cohort divided by groups according to disaster impact. For the 2018 cohorts, the proportional hazard assumption was not met. Nevertheless, the results of the parametric regression were very similar to the Cox regression.
Among the 2018 cohorts, the eighth graders in highly impacted municipalities showed no significant effect. However, at any given time, students in the medium impact group were 18% more likely to drop out than students in the low impact group. Contrary to expectations, 10th graders in the most impacted group had a lower dropout hazard risk, meaning that at any point after Maria, they were less likely to drop out than the low-impact groupEndnote 12. For this cohort, the low impact group has the highest hazard ratio. Overall, Hurricane Maria seemed to put more at-risk middle school students in the medium impact municipalities.
After the 2020 earthquake, eighth graders had a dropout hazard risk twice as high for students in the most impacted municipalities than those in the least affected. The bottom left panel in Figure 8 clearly shows a higher hazard function for the high-impact group, while the other two groups' functions were remarkably similar. Among 10th graders, the dropout hazard risk was significantly higher for students in the medium impact group. The difference between the high impact group's hazard function and the low impact group's function was not statistically significant.
A competing risk model was estimated for all cohorts to assess whether the estimates may reflect bias caused by attrition due to migration. These models calculated the hazard ratio, considering students might exit the school system for reasons other than the event under study. The results were consistent with the ones presented in Table 9. We conclude that the effect estimated was not biased due to migration.
Overall, we see that eighth graders seem to be more adversely affected by disasters than 10th graders. This finding was consistent with Segarra-Alméstica's 27 (2020) results on poverty being closely related to high school dropout rates while middle school dropout rates were associated with other risk factors.
Public Health Implications
Our analysis suggests that students in severely affected areas that received an overwhelming level of attention and services were able to stay in school. However, a substantial number of students in less affected areas did not receive as much attention from the government or NGOs seemed to remain vulnerable and dropped out of school. Regardless of the level of damage faced by students or their communities, they seemed to need attention and support to cope with trauma and keep them in school.
A significant number of students in Puerto Rico's Public School systems reported at least one major disability. Students with disabilities need to be first in any recovery agenda since they are among the most affected by disaster events. For them, a school interruption means much more than not receiving an education. School is where they received therapies and specialized health services. In many cases, school personnel play a leading role in assessing their needs and managing their health struggles. New guidelines and assessment tools are needed to continuously manage student well-being during disasters.
School interruptions also have implications for children's physical and mental health in a post-disaster setting. Schools play a central role in access to food for students especially when 80% of students live in households with income below the poverty line. When schools are not operating, access to adequate nutrition for poor students is more difficult. In post-disaster settings, schools need to develop plans, possibly in alliance with municipal governments, to distribute food to students and to assist families with finding help to fulfill basic needs.
Actionable Recommendations
The challenges of providing reliable, safe, and effective public education in the face of hurricanes, earthquakes, and other disasters should not be underestimated. This is particularly true for a public school system where 80% of the students live with incomes below the poverty line. Close to 30% of students report at least one disability and about one in four faces both vulnerability conditions.
Our results indicate that the length of school interruption and the degree of impact from a disaster increases adverse academic effects. This was especially true for vulnerable populations. Therefore, schools should focus on restoring services as quickly as possible, especially to those students most in need. The emergency response needs to be formalized. Each school should:
- Have an active and engaged committee with the participation of parents, school personnel, community leaders, and NGOs with a clear mission to assess disasters and immediately coordinate an emergency response. Their goals should be to help those affected by the disaster and to reopen the school as soon as possible. These committees should have the flexibility to consider each school community's unique characteristics and vulnerabilities while planning their approach to each type of disaster (hurricanes, floods, earthquakes, droughts, or pandemics).
- Establish emergency plans with private providers of special education services to reduce or eliminate interruptions of critical services during an emergency that forces schools to close.
- Establish a protocol that allows school personnel to visit students at home after a disaster to * Be equipped with water tanks, solar panels, and batteries to prepare food for students and families in need.
- Promote supportive school environments where students and their families feel safe and cared for during and after a disaster.
- Design and implement curricula for each grade level to promote a better understanding of natural hazards and develop social responsibility among students and their families focusing on risk mitigation.
School directors must have the authority to make decisions about disaster preparedness and emergency responses at their schools. Each disaster is unique, and communication with the central authorities can be disrupted. School directors need to be able to lead emergency management efforts in their schools and assist their communities without waiting or worrying about general directives from the regional or central PRDE offices.
Previous research (Mooney et al., 2020; Davis et al., 201928; Enchautegui-Román et al., 201829), and our ongoing qualitative study, indicate that attending to the emotional needs of the school community was vital to maintaining academic performance. After a natural disaster or emergency, a multidisciplinary team (psychologists, social workers, counselors, and faculty) should identify the most vulnerable students and families in each school and provide immediate support. These special teams must follow up to assure the continued well-being of those affected after the emergency is over.
Alleviating poverty must also be addressed. A detailed plan to reduce child poverty in Puerto Rico has been put forward by the Institute of Youth Development (Enchautegui et al., 201930). Implementing this plan is urgent.
Conclusion
Our research objective was to describe how school service interruptions associated with a series of disasters affected student academic achievement and educational outcomes especially among vulnerable populations. Overall, we found that Hurricane Maria had a moderate but significant adverse effect on academic achievement. The length of school interruptions partially explained this effect. There were other unknown factors that contributed to decreased levels of academic achievement. The adverse impact must be addressed because academic achievement in Puerto Rico’s public-schools has been at precarious levels for more than a decade. Natural hazards undoubtedly will keep affecting the island, so the Department of Education urgently needs to develop and implement policies and programs to improve its response to disasters.
The adverse effects of Hurricane Maria on academic achievement was accentuated for students with disabilities in both highly and moderately impacted municipalities. Designing policies that allow schools to identify social and economic vulnerabilities among their students with disabilities and to develop an emergency response program to address them promptly might reduce the impact of natural hazards within this population.
The dropout risk analysis provokes an interesting question. Why, for some cohorts, do students in municipalities that suffered medium impact from disasters present a higher dropout risk than their peers in highly impacted areas? In the case of Hurricane Maria, 10th graders were significantly less likely to drop out after a disaster than other groups. Our qualitative research is underway and it can help us identify the specific actions that schools in highly impacted areas took to address attrition after each disaster. Our research will reveal the approaches that worked with high school and middle school students to address potential vulnerability factors. If school policies contribute to lower attrition among high schoolers in high-impact municipalities, these actions should be considered in future disaster responses for all schools.
A comprehensive public policy for overcoming the negative impact of school disruptions urgently needs to be developed especially for students with disabilities. The second phase of our project entails a survey of school principals, interviews, and focus groups of school personnel about the specific responses and actions that could mitigate disasters in the future.
If Puerto Rico's education system does not improve its ability to reopen and reestablish services quickly after a disaster, the number of school-age children in the population will continue to decline. Puerto Ricans have been migrating away from the island because of the lack of continuity and declining quality of educational services. The decrease in the quality of education is shown by the continuous decline in the average scores on the META achievement tests. The absence of effective strategies to lower dropout rates and reduce the number of students who receive failing grades pose additional challenges. The Department of Education urgently needs a strategy to increase their capacity to cope with school interruptions due to hurricanes, floods, or earthquakes.
Endnotes
Endnote 1: META has two types of tests, type 1 taken by most students and type 2 taken by students in full-time special education classrooms. Only results for type 1 test are included in the analysis. ↩
Endnote 2: Puerto Rico is divided into 78 local government jurisdictions or municipalities. Meanwhile, the Puerto Rico Public School System is organized as follows: Secretary (Central Office); Regional Director (seven offices); and schools. However, Puerto Rico Department of Education is considered a State District (PR-01) for federal purposes. ↩
Endnote 3: https://www.census.gov/data/tables/time-series/demo/popest/2010s-total-puerto-rico-municipios.html↩
Endnote 4: The variable is equal to one for municipalities highly impacted by Hurricane Maria and zero otherwise.↩
Endnote 5: These municipalities are: Aibonito, Barranquitas, Canóvanas, Ciales, Comerío, Corozal, Maunabo, Morovis, Naranjito, Orrocovis, Salinas, Vieques, Yabucoa and Jayuya. Alternative groupings estimated using change in nighttime lighting from August, 2017 to October, 2018 (obtained from (Homeland Security Operational Analysis Center , 2020) as an additional variable in the PCA and using k-mean clustering yields very similar results.↩
Endnote 6: The vulnerability profile focused on poverty and disability since we are looking at changes following disasters. These two factors may be likely to change as a direct consequence of disasters. Although important to ascertain the student population's vulnerability level, other aspects as age and gender are more likely to be affected by other demographic changes.↩
Endnote 7: Group assignment was done according to the school register in the socioeconomic data files and corresponded to information offered at the beginning of the school year.↩
Endnote 8: Students that completed the eighth or 11th grade in June 2017 will not have a post Maria META score since the test is not taken by students in ninth, 10th, or 12th grade.↩
Endnote 9: In the preferred model, attrition is equal to 1 if the student has a META score in the pre-Maria period, but not score post-Maria and zero if the student has at least one score in each period; the attrition equation includes variables pertaining to the municipality where the students were enrolled during 2015–16; and a joe-copula specification is used. In the alternative specification attrition was equal to one if the student has a META score for the first year in the sample but not for the last year, and equal to zero if the student has a META score for both. The municipal variables include demographic and economic aspects that may influence mobility and were obtained from the Puerto Rico Community Survey (PRCS) 2016 five-year sample.↩
Endnote 10: These 22 schools were opened and had students enrolled as of September, 2017 but did not reopen after the hurricane.↩
Endnote 11: The economic activity per county were calculated as in Caraballo-Cueto’s (2017) study, where the share of economic activity of each county in the Economic Census was then extrapolate to a Gross National Product per county.↩
Endnote 12:They are also less likely to drop out when compared to all other groups.↩
References
-
Pane, J., McCaffrey, D., Kalra, N., & Zhou, A. (2008). Effects of Students Displacement in Louisiana During the First Academic Year After the Hurricanes of 2005. Rand Corporation. ↩
-
Gibbs, L., Nursey, J., Ireton, G., Alkemade, N., Gallagher, H., Cook, J., . . . Block, K. M. (2019). Delayed Disaster Impacts on Academic Performance of Primary School Children. Child Development, 90(4), 1402-1412. ↩
-
Gomez, C., & Yoshikawa, H. (2017). Earthquakes effects: Estimating the relationship between exposure to 2010 Chilean earthquake and preschool children's early cognitive and executive function skills. Early Childhood Research Quarterly, 38, 127-136. ↩
-
Takasaki, Y. (2017). Do Natural Disasters Decrease the Gender Gap in Schooling? World Development, 94, 75-89. ↩ ↩
-
Bonanno, G., Brewin, C., Kaniasty, K., & La Greca, A. (2010). Weighing the Costs of Disaster: Consequences, Risks, and Resilience in Individuals, Families and Communities. Psychological Science in the Public Interest, 11(1), 1-49. ↩
-
Mohammad, L., & Peek, L. (2019). Exposure Outliers: Children, Mothers and Cumulative Disasters Exposure in Louisiana. Journal of Family Strengths, 19*(1). ↩
-
Fletcher, S., Cox, R., Scannell, L., Heykoop, C., Tobin-Gurley, J., & Peek, L. (2016). Youth creating disaster recovery and resilience: A multi-site arts-based youth engagement research project. Children, Youth and Environments, 26(1), 148-163. ↩
-
Peek, L., Abramson, D., Cox, R., Fothergill, A., & Tobin, J. (2018). Children and disasters. In H. R. al. (Ed.), Handbook of Disaster Research. Springer International Publishing. doi: https://doi.org/10.1007/978-3-319-63254-4_13 ↩
-
Cheng, T., & Trivedi, P. K. (2015). Attrition Bias in Panel Date: A Sheep in Wolf's Clothing? A Case Study Based on the Mabel Survey. Health Economics, 24(9), 1101-17. ↩ ↩
-
Mooney, M., Tarrant, R., Paton, D., Johnston, D., & Johal, S. (2020). The school community contributes to how children cope effectively with a disaster. Pastoral Care in Education, 1-24. ↩
-
Kousky, C. (2016). Impacts of Natural Disasters on Children. The Future of Children, 26(1), 73-92. ↩
-
Crespo Cuaresma, J. (2010). Natural Disasters and Human Capital Accumulation. The World Bank Economic Review, 24(2), 280-302. ↩
-
Nguyen, C. V., & Pham, N. M. (2018). The impact of natural disasters on children's education: Comparative evidence from Ethiopia, India, Peru, and Vietnam. Review of Development Economics, 22, 1561-1589. ↩
-
Kuhfeld, M., Soland, J., Tarawasa, B., Johnson, A., Ruzek, E., & Lewis, K. (3 de December de 2020). How is COVID-19 affecting student learning: Initial findings from fall 2020. Brown Center Chalkboard. Recuperado el 29 de June de 2021, de https://www.brookings.edu/blog/brown-center-chalkboard/2020/12/03/how-is-covid-19-affecting-student-learning/ ↩
-
Peek, L., & Stough, L. M. (2010). Children with Disabilities in the Context of Disaster: A Social Vulnerability Perspective. Child Development, 81(4), 1260-1270. ↩
-
McAdams Ducy, E., & Stough, L. (2011). Exploring the Support Role of Special Education Teachers after Hurricane Ike: Children with Significant Disabilities. Journal of Family Issues, 30(10), 1325-1345. ↩
-
La Brocquem, R., De Young, A., Montague, G., Pocock, S., March, S., Triggell, N., . . . Kenardy, J. (2017). Schools and Natural Disaster Recovery: The Unique and Vital Role that Teachers and Education Professionals Paly in Ensuring the Mental Health of Students Following Natural Disasters. Journal of Psychologists and Counsellors in Schools, 27(1), 1-23. ↩
-
Brummet, Q. (2014). The effect of school closings on student achievement. Journal of Public Economics, 119, 108-124. ↩
-
Engberg, J., Gill, B., Zamarro, G., & Zimmer, R. (2012). Closing schools in a shrinking district: Do student outcomes depend on which schools are closed? Journal of Urban Economics, 71(2), 189-203. ↩
-
Rumberger, R. W., & Larson, K. A. (1998). Student mobility and the increased risk of high school dropout. American Journal of Education, 107, 1–35. ↩
-
Caraballo-Cueto, J. (2020). Academic Achievement and School Closures in Puerto Rico. Retrieved from https://www.researchgate.net/publication/343636485_APROVECHAMIENTO_ACADEMICO_Y_EL_CIERRE_DE_ESCUELAS_EN_PUERTO_RICO ↩
-
Sacerdote, B. (2012). When the Saints Go Marching Out: Long-Term Outcomes for Students Evacuees from Hurricanes Katrina and Rita. American Economic Journal: Applied Economics, 4(1), 109-135. ↩
-
Richardson, K. (2005). Katrina's children: an analysis of educational outcomes among displaced children in Colorado. Retrieved from https://hazards.colorado.edu/uploads/basicpage/richardson.pdf ↩
-
Homeland Security Operational Analysis Center. (2020). Municipalities on the Front Lines of Puerto Rico's Recovery: Assessing Damage, Needs, and Opportunities for Recovery After Hurricane María. California: RAND Corporation. ↩
-
Hasabe, T. (2013). Copula-based maximum-likelihood estimation of sample-selection models. The STATA Journal, 13(3), 547-573. ↩
-
Caraballo-Cueto, J. G. (2017). How (not) to Estimate GDP at the Sub-State Level: The Usefulness of the Economic Census. Review of Regional Studies, 47(3), 289-308. ↩
-
Segarra-Alméstica, E. (2020). ¿Qué hay detrás de las variaciones en el desempeño académico entre las escuelas públicas en Puerto Rico? Factores Sociodemográficos, comunitarios y escolares. San Juan, Puerto Rico: Observatorio de la Eduación Pública, CEMGAP Universidad de Puerto Rico, Recinto de Río Piedras. ↩
-
Davis, C., Fuller, S., Cannon, S., Long, R., & Shields, J. (2019). Promising Practices When Schools are Hit by Hurricanes, Factsheet. Retrieved June 23, 2021, from UNC College of Arts and Science, Public Policy: https://publicpolicy.unc.edu/wp-content/uploads/sites/107/2020/04/Promising-Practices.pdf ↩
-
Enchautegui-Román, M., Segarra-Alméstica, E., Cordero-Nieves, Y., Martínez-Mejías, S., & Rivera-Rodríguez, H. (2018). Los Efectos del Huracán María en la Niñez en Puerto Rico. San Juan, Puerto Rico: Instituto de Desarrollo de la Juventud. ↩
-
Enchautegui, M. E., Rosa, B. L., & Arroyo, C. A. (2019). Un futuro de pobreza infantil en Puerto Rico: cuánto nos cuesta y qué podemos hacer. San Juan, Puerto Rico: Insituto de Desarrollo de la Juventud. Retrieved from https://cab5849c-9dfe-496d-928f-4a188cdd49a5.filesusr.com/ugd/011d36_e9e87928b7e049fe990fceb25ce6d944.pdf ↩
Segarra-Alméstica, E., Cordero-Nieves, Y., Cordero-Guzmán, H., Caballero-Cueto, J., Luciano-Montalvo, I., Martínez-Mejias, S., & Rivera-Rivera, H. (2021). The Effect of School Services Disruptions on Educational Outcomes After Consecutive Disasters in Puerto Rico (Natural Hazards Center Public Health Disaster Research Report Series, Report 2). Natural Hazards Center, University of Colorado Boulder. https://hazards.colorado.edu/public-health-disaster-research/the-effect-of-school-services-disruptions-on-educational-outcomes-after-consecutive-disasters-in-puerto-rico