Validating the Disaster Food Security Scale for Rural U.S. Populations
Publication Date: 2023
Abstract
Although there is a large body of evidence on food security and food systems, similar research is limited in disaster settings. Rural areas are especially at risk for adverse disaster consequences. The goal of this project is to validate the Disaster Food Security Scale (DFSS) for rural populations. Rural population-specific validation is needed to ensure that the scale reliably measures barriers to food security in rural populations, which may have different concerns and issues during disasters when compared to the general or non-rural populations. To validate the DFSS-Rural, the DFSS survey was administered to a national U.S. sample of households that recall a disaster in their community in the past five years. Survey data were analyzed for validity and non-rural and rural populations were compared. The disaster food security construct created through the scale development process was unidimensional allowing the administration and scoring of a single composite scale to capture multiple aspects of food security in a disaster context. The DFSS scale measures food security disruption from a systems perspective, and therefore, identifies where a disruption is occurring in the food system chain and can provide information for public health and emergency management officials, communities, and community service organizations about specific opportunities for intervention to improve food security and improve health outcomes.
Introduction
In the United States, the U.S. Department of Agriculture (USDA) conducts surveillance of food insecurity annually. The USDA defines food security as, “access by all people at all times to enough food for an active, healthy life.” It is critical for public health efforts to address food insecurity following disasters because food insecurity is associated with negative health effects in children and adults. In adults, food insecurity is associated with hypertension, hyperlipidemia, cardiovascular disease, poorer quality of life, poor sleep, depression, restricted activity, risk for obesity, and poor functional health. In children, it is associated with behavioral problems, birth defects, lower educational achievement, depression, chronic health conditions, cognitive problems, asthma, acute infections, lower nutrient intake, poorer oral health, poorer general health, anemia, cognitive problems, and aggression and anxiety (Gundersen & Ziliak, 20151). In the United States, Native American, Black, Pacific Islander, and Latino households disproportionately bear the burden of food insecurity (Feeding America, n.d.a2).
The USDA’s Household Food Security Survey Module was designed to assess food insecurity and its severity (Economic Research Service, 20223). The module is considered the gold standard for assessing food insecurity and has been adapted for use in various cultural contexts (Marques et al., 20154). The survey was designed to assess food access, focusing on financial resources (Economic Research Service, 20155)—and does this well—but excludes aspects of food insecurity important for understanding health in a disaster context, including: (a) physical barriers to food, (b) access to appropriate foods, (c) disruptions in food availability and utilization, and (d) high levels of uncertainty and fear that may accompany food access during disasters. Measuring only household financial aspects of food insecurity limits our understanding of the causes of food insecurity to pecuniary drivers and limits interventions to those that address monetary barriers to food access. The Household Food Security Survey Module has been used in disaster contexts despite the unique food security challenges presented, such as ensuring sufficient calories, dietary quality, and appropriate types of meals (ready-to-eat) amid disruption to infrastructure, supply chains, and organizational and social systems.
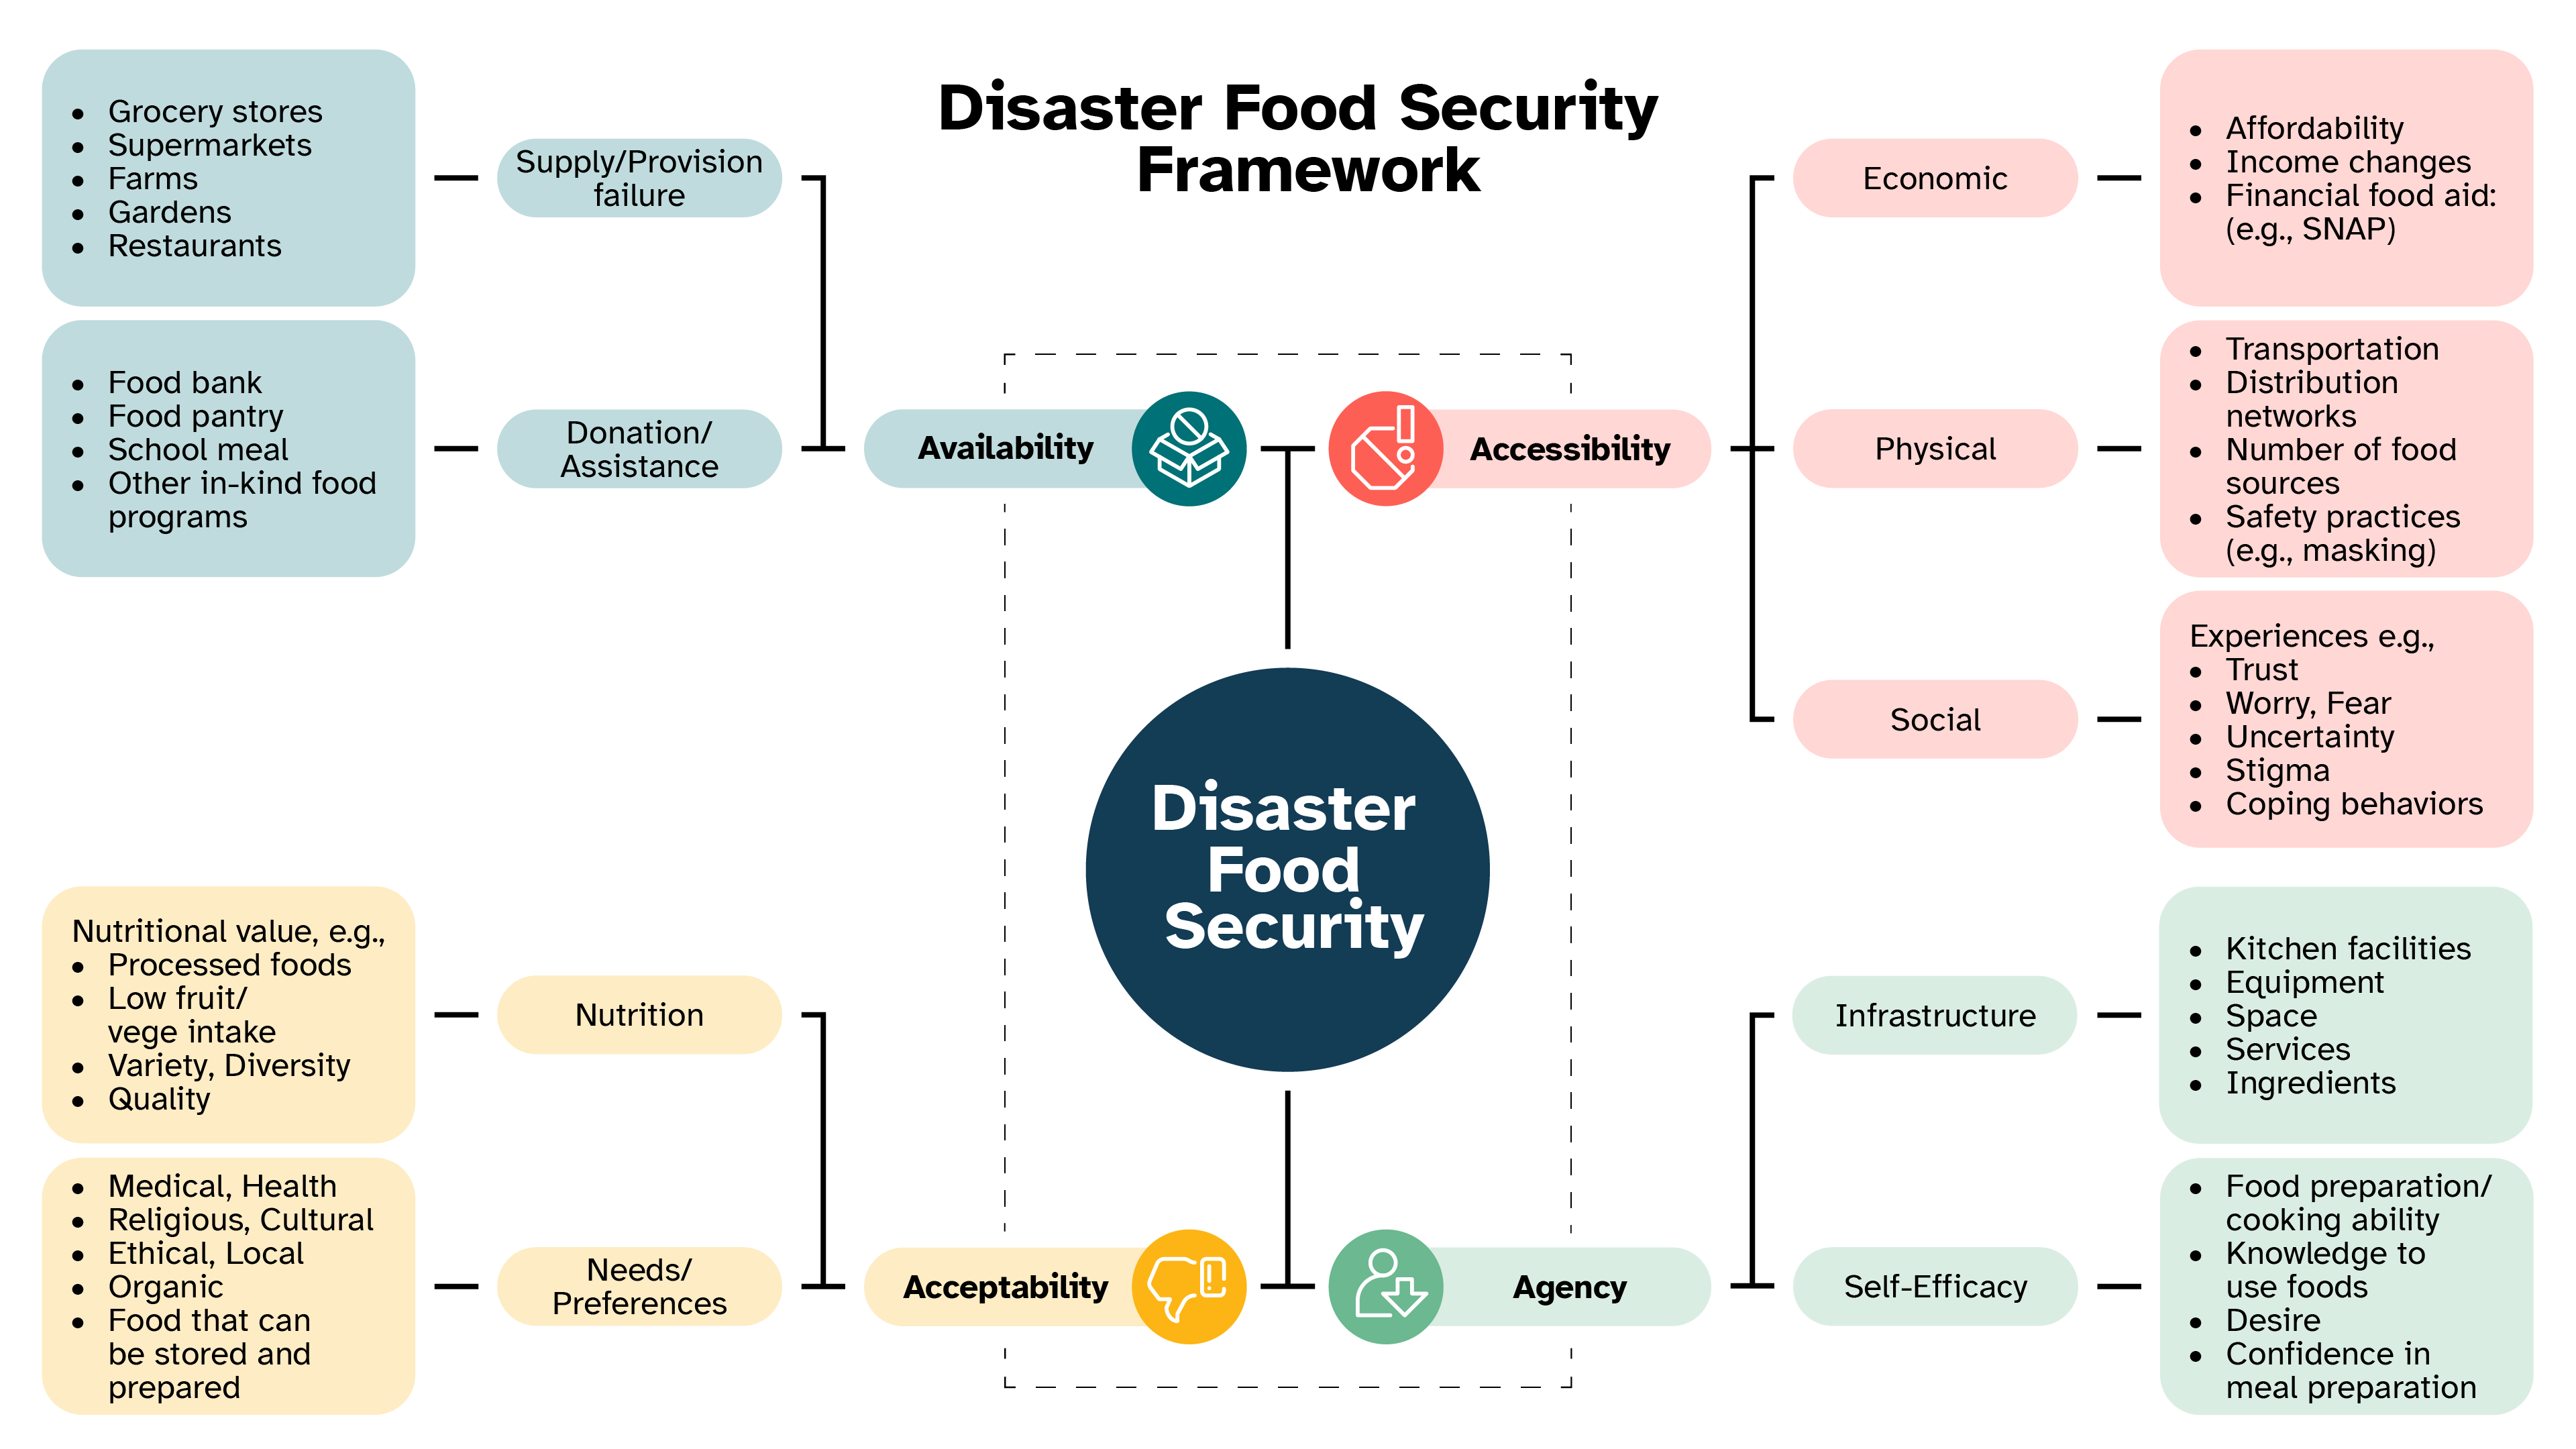
With funding from the USDA/Tufts, we responded to these shortcomings by developing a Disaster Food Security Framework (Figure 1) and associated Disaster Food Security Scale (Clay et al., 20236; Clay, L.A. et al., 20237; Economic Research Service, n.d.8). The framework is validated to ensure it accurately measures what happens after a disaster. It captures accessibility, availability, acceptability, and agency barriers to food security and has been used to develop a Disaster Food Security Scale (DFSS) survey instrument. A complete description of the framework with examples is available in the Local and Regional Food Systems Resilience Playbook (Clay, 20239). Given the distinct context of preparing for and responding to disasters in rural communities, this research builds on the framework and scale to validate the scale for rural populations. Validating the DFSS for rural populations is important to ensure accurate measurement of barriers to food security in rural communities. The proposed research responds to a recent call in the Journal of the Academic of Nutrition and Dietetics for improved psychometric validation (accuracy) of measures used with populations experiencing food insecurity (Christensen et al., 202210).
Figure 1. Disaster Food Security Framework
Literature Review
Food Insecurity and Disasters in the United States
Food is a basic need for survival and a human right (Ayala & Meier, 201711; Universal Declaration of Human Rights, 194812). Human ability to meet this basic need in disasters is disrupted when essential lifelines break down in the built environment and social systems are fractured. Alleviating limited access to food that arises during disasters is the focus of many recovery efforts (American Red Cross, 201413; Food Research Action Center, 200614); however, there is a limited evidence base on which to build effective programs and policies to meet community food needs. For instance, modifications were made to allowable purchases for Supplemental Nutrition Assistance Program (SNAP) beneficiaries after Superstorm Sandy in New Jersey, so families were able to repurchase lost food supplies (U.S. Department of Agriculture, 201215). Recently, the Families First Coronavirus Response Act of 2020 authorized Pandemic-EBT to assist families during COVID-19 Food and Nutrition Service, n.d.16). But these modifications were made without an understanding of household and food system disruption and have not been evaluated, as evidenced by recent funding calls to establish an evidence base (Healthy Eating Research, 202017). In addition, many studies of risk and protective factors use nationally representative samples in the United States, overlooking special populations outside of traditional demographic groups such as rural populations, or individuals affected by disasters. These are critical gaps to address as disasters increase in frequency and magnitude (Coleman, 200618; Intergovernmental Panel on Climate Change, 201419).
Humans and the built environment are interdependent and highly susceptible to disaster impacts. Complex adaptive systems theory holds that outcomes are produced using more than one level, have emergent features, and behave in dynamic and non-linear ways (Carmichael et al., 201920). Linkages between actors in the complex adaptive food system are vulnerable to disruption by a disaster at multiple points, for example: growing and harvesting may be reduced by flood or drought; transport and supply chains may be disrupted due to road damage; and the sale and consumption of food may fluctuate with unusual patterns in supply and demand when households are displaced or experiencing economic constraints.
Food insecurity poses a range of serious health risks such as poor nutrition, cardiovascular disease, poor quality of life, poor mental health, and higher rates of infection and developmental problems in children (Cook et al., 201321; Drennen et al., 201922; Lee et al., 201223; Shankar et al., 201724) and can exacerbate pre-existing health issues (Cook, 200225; Cook et al., 200426; Cook & Frank, 200827; Ettinger de Cuba et al., 201828). In the United States, food insecurity disproportionately affects households in rural areas, headed by a single adult with children, predominantly Black, non-Hispanic households, and households with children; many of the same groups that are socially vulnerable to disasters and other emergencies (Coleman-Jensen et al., 202029; Thomas et al., 201330). Disasters also increase risk for food insecurity as prevalence is higher among individuals who experience a change in their life circumstances such as changes in financial obligations, household composition, or housing stability (Rose, 199931; Rose et al., 199832), which are all common disaster consequences for exposed households.
Household Food Insecurity Increases Following Disasters
Longitudinal analysis of food insecurity in a cohort of households displaced by Hurricane Katrina showed 21-30.4% prevalence, much higher than the U.S. prevalence over the same time period of 11-14.5%. Predictors of food insecurity in this cohort were different than in the general population, notably, housing stability was not protective against food insecurity while other social factors played a significant role (Clay et al., 201833). Analysis of food insecurity following Hurricane Harvey (2017) showed 42.3% of respondents screened as at-risk for food insecurity (Clay & Ross, 202034).
A longitudinal, critical incident case study of impacts of Hurricane Florence in New Bern, North Carolina on the local food system showed that the local food system sustained widespread disruption, from farmers producing food, through the built environment systems of transporting, packaging, and storing food in warehouses, transporting food to markets, retail and emergency food markets, down to the household level with disruption to households putting food on the table (Clay, 201935). The Nutrition Environment Measures Survey was used to assess the availability, price, and quality of nutritious foods in food stores in the week and months following the hurricane in New Bern (Glanz et al., 200736). The survey scores analyzed alongside interviews with individuals affected by the storm showed a discord between perceived and actual availability of food measured by the survey instrument. This study highlighted how non-disaster food system tools do not measure disaster relevant and appropriate foods, thus limiting the ability to monitor food availability and nutrition following disasters (Clay et al., 202137).
A survey of food access and availability during COVID-19 that oversampled low income, Black or African American, and Hispanic New York residents showed that 66% of respondents had to go to more places than usual to find food that their household needed and 62% could not find as much food as they wanted to buy at least some of the time (Clay & Heath, 202038). Further, groups that in normal times would not be food insecure are reporting insecurity, as measured by validated USDA metrics. This novel hazard challenges current knowledge about the construct of food security and raises questions about how we measure food security in disaster affected populations. Each of these preliminary studies describe how disasters tip the balance of the complex adaptive food system to destabilize food security and demonstrate how a lack of disaster specific measurement tools lead to an incomplete understanding of food security in a disaster context and hence contribute to inadequate interventions.
Rural Food Insecurity Disparities
Rural communities face distinct challenges with food security related to transportation, underemployment, and low wages. Food insecurity rates are higher in rural areas than in non-rural areas in the United States. According to the USDA, 11% of rural households experience food insecurity (Coleman-Jensen, 202239). Rural communities make up 63% of all U.S. counties, but 87% of counties with the highest food insecurity rates are rural (Feeding America, n.d.b40). Further, people of color living in rural areas are more likely to experience food insecurity due to historically and structurally racist policies in the United States (Feeding America, n.d.b). In 2020, Black people were 2.5 times more likely to be at risk of experiencing food insecurity than non-Hispanic White individuals in rural areas and Native Americans living in rural areas experience the highest rates of food insecurity of any racial or ethnic group (Feeding America, n.d.b).
Rural Disaster Disparities
Rural areas have distinct challenges when preparing for and coping with disasters including resource limitations (e.g., equipment, supplies, training, infrastructure), remote geography, low population density, and communication issues (Rural Health Information Hub, n.d.41). Further, rural communities rely on local agencies and institutions for preparedness and response; however, in many rural areas there are no local public health departments and rural health care infrastructure is constrained in response capability. Limited research on disasters in rural communities shows that rural areas experience a disproportionate burden of disaster exposure (Davis et al., 201042). Health disparities in rural areas related to healthcare access, food insecurity, and other health issues compound the effects of disasters.
Research Questions
This study aims to validate a Disaster Food Security Scale for rural populations (DFSS-Rural) building on the current Disaster Food Security Framework and DFSS. Validation is the process of ensuring that a scale is accurately measuring what it has been created to measure. To achieve this aim, two research questions will be answered:
- Is the DFSS a structurally valid measure of the disaster food security construct?
- Is there a difference in the structure of the DFSS between rural and non-rural populations?
Research Design
The validation of the DFSS-Rural followed the development and validation of a disaster food security framework and definition (Clay et al., 2023). Using the framework, quantitative methods were implemented to test whether the DFSS-rural is a valid measure of the disaster food security construct in disaster settings.
Study Sample
Populations residing in rural areas were the target population for this study. Rural was operationalized using the National Center for Health Statistics Urban-Rural Classification Scheme for Counties 2013 published on the Centers for Disease Control and Prevention’s website (National Center for Health Statistics, 202343). U.S. household survey participants (n=1,156) were recruited by the survey research firm Qualtrics from U.S. counties with a disaster declaration in the past five years (n=2,600 counties). Qualtrics collects data through web-based surveys. Qualtrics maintains survey panels with national representation that are indexed on sociodemographic characteristics, enabling quota sampling. To ensure sufficient rural county recruitment and to balance states with lower population size or enrollment in Qualtrics panels, geographic quotas (n=150) were set for three geographic regions. Region 1 included Montana, North Dakota, South Dakota, Wyoming, Utah, Colorado, Washington, Oregon, and Idaho. Region 2 included Minnesota, Wisconsin, Michigan, Illinois, Indiana, Ohio, Nebraska, Iowa, Kansas, and Missouri. Region 3 included eastern United States, excluding New York and New Jersey. The remaining 750 participants could come from anywhere in the country. Additional quotas for the survey included sociodemographic characteristics associated with increased rates of food insecurity: race (60% Non-Hispanic White, 14% Black, 19% Hispanic, and 7% other), ethnicity, households with children (40% households with children), and income (50% with an annual income of $50,000 or less).
Data Collection Survey Instrument
The DFSS survey included questions about disaster experiences in the past five years, e.g., the type of disaster, name of disaster, and asset damage and other damages experienced due to the stated disaster. These questions were tested and overall face validity to ensure they represent questions relevant to experiences post disasters. In addition to the DFSS items, the USDA Household Food Security Survey Module, COVID experiences, demographic characteristics, a set of health outcomes including mental health, perceived health status, and other measures such as housing stability and water security were included in the survey. Some of these measures were planned for validation purposes. The survey instrument and protocol are available for reuse through DesignSafe-CI (Clay et al., 2023).
Data Analysis
Characteristics of participants reporting having experienced a disaster were described using descriptive statistics. Only those who reported remembering their experiences were included in the validation analyses. To develop the DFSS-Rural, an exploratory factor analysis for categorical data, the Multiple Correspondence Analysis, was conducted (Greenacre & Blasius, 200644). The disaster food security scale items were tested for adequacy to run this type of analysis. A Keiser-Meyer-Olkin statistic > 0.80 and the Barlett’s Test of Sphericity at P < 0.05 were used to ensure that the items are correlated and could be used to run factor analysis (Tobias & Carlson, 196945). A scree plot was used to determine the number of factors relevant to the disaster food security construct. The factor analysis was conducted to determine which disaster food security scale items best characterize the DFSS construct. The items that loaded the highest on the factors were considered as variables that fit together to represent the disaster food security construct. This step was followed by a confirmatory factor analysis with only those variables that loaded successfully during the exploratory factor analysis phase to create the scale. Multiple Correspondence Analysis was used to determine the reduced set of questions that together form the DFSS; confirmatory factor analysis was used to confirm adequacy of the chosen items to represent the scale as a measure of disaster food security. This was followed by an evaluation of measurement invariance between participants living in rural compared to non-rural areas. Model fit statistics and recommended cut-offs, such as root mean square error of approximation (≤ 0.05), standardized root mean square residual (≤ 0.08), root mean square residual (≤ 0.08), comparative fit index (≥ 0.95), and Tucker Lewis index (≥ 0.90) were used to determine satisfactory fit (Hays et al., 199346; Hu & Bentler, 199947; Kline, 202348). The “FactoMineR” and the “lavaan” packages were used to conduct the Multiple Correspondence Analysis and the confirmatory factor analysis respectively in R Version 4.0.2 (Lê et al., 200849). Following the confirmatory factor analysis, the chosen DFSS items were scored by rating “Never True” = 0 point and “Sometimes True” and “Often True” = 1 point. A sum of all responses was then performed to represent the DFSS score for each participant. This follows the same score rating and the same score calculation method as those used by the USDA Household Food Security Survey Module (Economic Research Service, 2015).
The scale for rural communities was validated in multiple ways. Validity here refers to the extent to which the scale is an adequate indicator of food security in the rural disaster experience context. Four types of validities were tested: predictive, convergent, discriminant and differentiation between known groups. The definition of each validity and the methods for assessing them are summarized in Table 1. Briefly, validity assessments consisted primarily of regression analyses using the scale score as the outcome and validity-relevant variables as predictors. Correlations and/or regression coefficients, of expected magnitude and in the expected directions based on each of the validity requirements, were considered supportive of the validity of the scale. Validity assessments and the initial descriptive statistics were conducted in Stata version 17 (StataCorp, 202150).
Table 1. Summary of Scale Validity Assessments and Related Methods
| Type of validity | Purpose | Assessment Methods |
| Measurement Invariance/Structural Validity | To determine whether the scale developed for the whole population having experienced a disaster is valid among different groups. | Multigroup confirmatory factor analysis by living location (rural vs. non-rural) |
| Convergent | To determine the extent to which the scale is related to measures of other constructs that can be expected on theoretical grounds and/ or accumulated knowledge to be close to the one measured by the chosen scale. | Regression of the scale score on related items (e.g., worry about food supply, food access challenges, coping strategies, and food assistance receipt). |
| Predictive | To determine the extent to which the scale predicts known related outcomes. | Regression of scale score on individual anxiety, depression, and perceived health status. |
| Discriminant | To determine extent to which the score on the scale differs from other closely related constructs. | Regression of the scale score on individual items (e.g., water insecurity and housing instability). |
| Differentiation Between Known Groups | The extent to which the scale score is differentiated as expected in relation to groups that are known to be similar or different. | Regression of the scale score on demographic characteristics (e.g., race, ethnicity, gender, household with and without children, and age categories). |
Ethical Considerations and Researcher Positionality
All research protocols were reviewed and approved by the University of Maryland, Baltimore County Institutional Review Board prior to commencing data collection. All research team members are trained in the importance of project and data management principles to ensure ethical practices and on reporting adverse events so that the rights, safety, and respect for participants can be upheld or restored promptly. Students who supported this work engage in regular research ethics training and discussion. The Principal Investigator conducts research ethics training each academic year in her Disaster Health Research Lab at her university, including a 75-minute lab training and discussion of scenarios in hazards research, online CITI training for human subjects research (including social and behavioral research, responsible conduct of research, conflict of interest, and health information privacy modules), and six of the CONVERGE training modules for all lab members including the Broader Ethical Considerations and Institutional Review Board Procedures modules. For each project, the informed consent process is part of protocol training and debrief time is allocated during weekly lab meetings during active data collection to address questions and situations that arise for team members.
The research team has personal lived experience and experience conducting research in partnership with rural communities across Louisiana, Montana, Arizona, Kentucky, Georgia, Michigan, and Texas. These experiences provide important context for conducting the research presented here.
Preliminary Findings
Description of Participants
After restricting the survey respondents to those who reported remembering facing a disaster in the past five years and excluding participants with missing variables related to the DFSS items of interest, the sample included a total of 377 participants with 104 from rural regions and 273 from non-rural areas. Table 2 summarizes the characteristics of these participants. The demographic characteristics that were significantly different between rural and non-rural participants included age, where non-rural participants were on average older than rural participants (mean=46.2, Standard Deviation=16.3 vs. mean=42.7, Standard Deviation=16.2); number of dependents in the household, where non-rural participants were more likely to have a smaller number of dependents compared to rural households; partnership status, where a higher number of non-rural participants were single compared to rural participants; and income, where rural participants were more likely to be earning less than $50,000 per year compared to the respondents from non-rural areas. Racial and ethnic distributions, food and water insecurity prevalence, education levels, employment status, perceived level of health status, and percentage of participants receiving food assistance were similar across both communities.
Table 2. Characteristics of Participants who Reported Experiencing Disasters in the Past Five Years
| Characteristics | Total | Non-Rural | Rural | p-value |
| n(%) | n(%) | n(%) | ||
| Mean Age (Standard Deviation) | 43.7(16.3) | 46.2(16.3) | 42.7(16.2) | 0.02 |
| Food Insecure | 187(49.6) | 137(50.2) | 50(48.1) | 0.72 |
| Race | 0.24 | |||
| White | 298(80.3) | 211(78.7) | 87(84.5) | |
| Black | 46(12.4 | 38(14.2) | 8(7.8) | |
| Other | 27(7.3) | 19(7.1) | 8(7.8) | |
| Highest Level of Education Completed | 0.81 | |||
| No Schooling | 2(0.5) | 2(0.7) | 0(0) | |
| Grades 1-12 | 12(3.2) | 8(2.9) | 4(3.8) | |
| High School Graduate or GED | 93(24.7) | 65(23.9) | 28(26.9) | |
| Some College | 81(21.5) | 56(20.6) | 25(24) | |
| Associate's Degree | 58(15.4) | 42(15.4) | 16(15.4) | |
| Bachelor's Degree | 75(19.9) | 57(21) | 18(17.3) | |
| Master's Degree | 45(12) | 33(12.1) | 12(11.5) | |
| Professional or Doctorate Degree | 10(2.7) | 9(3.3) | 1(1) | |
| Number of Dependents in the Household | 0.02 | |||
| None | 143(38.5) | 103(38.4) | 40(38.8) | |
| 1 | 57(15.4) | 45(16.8) | 12(11.7) | |
| 2 | 84(22.6) | 64(23.9) | 20(19.4) | |
| 3 | 42(11.3) | 33(12.3) | 9(8.7) | |
| 4 | 26(7) | 14(5.2) | 12(11.7) | |
| 5 or more | 19(5.1) | 9(3.4) | 10(9.7) | |
| Employment Status | 0.11 | |||
| Full Time | 153(40.6) | 120(44) | 33(31.7) | |
| Part Time | 50(13.3) | 30(11) | 20(19.2) | |
| Unemployed | 32(8.5) | 24(8.8) | 8(7.7) | |
| Retired | 51(13.5) | 37(13.6) | 14(13.5) | |
| Student | 18(4.8) | 15(5.5) | 3(2.9) | |
| Homemaker | 36(9.5) | 25(9.2) | 11(10.6) | |
| Disabled or Not Able to Work | 33(8.8) | 19(7) | 14(13.5 | |
| Other | 4(1.1) | 3(1.1) | 1(1) | |
| U.S. Born | 347(92.3) | 250(91.9) | 97(93.3) | 0.66 |
| Partnership Status | 0.04 | |||
| Single | 115(30.6) | 93(34.2) | 22(21.2) | |
| Married | 159(42.3) | 115(42.3) | 44(42.3) | |
| Living with a Partner | 43(11.4) | 28(10.3) | 15(14.4) | |
| Divorced | 40(10.6) | 26(9.6) | 14(13.5) | |
| Widowed | 19(5.1) | 10(3.7) | 9(8.7) | |
| Income | 0.05 | |||
| Less than $50,000 | 183(48.5) | 124(45.4) | 59(56.7) | |
| $50,000 or More | 194(51.5) | 149(54.6) | 45(43.3) | |
| Hispanic | 52(13.8) | 43(15.8) | 9(8.65) | 0.07 |
| Water Insecurity | 0.61 | |||
| Never | 136(36.1) | 102(37.4) | 34(32.7) | |
| Sometimes | 111(29.4) | 80(29.3) | 31(29.8) | |
| Often | 128(34.0) | 89(32.6) | 39(37.5) | |
| Food Assistance Recipient | 169(44.8) | 112(41.0) | 57(54.8) | 0.02 |
| Perceived Health Status | 0.44 | |||
| Excellent | 54(14.3) | 41 | 13 | |
| Very Good | 83(22.0) | 63 | 20 | |
| Good | 158(41.9) | 112 | 46 | |
| Fair | 67(17.8) | 49 | 18 | |
| Poor | 15(3.98) | 8 | 7 |
Distribution of DFSS Item Responses by Rural Status of Participants
Table 3 describes the DFSS survey questions and answer options, as well as the number and percentage of participants who chose the different answer option for each item of interest from the survey. Overall, there were no significant differences between the responses provided by rural and non-rural participants for any of the survey items. Only complete cases were used in this and subsequent analyses. As such, there were no missing values for any of the items.
Table 3. Distribution of Responses to Disaster Food Security Scale Items
| Disaster Food Security Scale Items | Non-Rural | Rural | Total | p-value |
| (n%) | n(%) | (n %) | ||
| Respondants | 273 (72.4) | 104 (27.6) | 377 (100%) | |
| I did not have a clean and sanitary area to prepare meals | 0.49 | |||
| Never True | 181(66.3) | 66(63.5) | 247(65.5) | |
| Sometimes True | 59(21.6) | 26(25) | 85(22.5) | |
| Often True | 33(12.1) | 12(11.5) | 45(11.9) | |
| Food supplies were lower than I was used to at my usual food sources | 0.57 | |||
| Never True | 73(26.7) | 27(26) | 100(26.5) | |
| Sometimes True | 133(48.7) | 46(44.2) | 179(47.5) | |
| Often True | 67(24.2) | 31(29.8) | 98(26) | |
| The selection of foods that I enjoy was limited or not diverse enough at my usual source | 0.9 | |||
| Never True | 79(28.9) | 32(30.8) | 111(29.4) | |
| Sometimes True | 128(46.9) | 46(44.2) | 174(46.2) | |
| Often True | 66(24.2) | 26(25) | 92(24.4) | |
| I could not get the right kinds of foods for my dietary needs from my usual food sources | 0.46 | |||
| Never True | 138(50.5) | 60(57.7) | 198(52.5) | |
| Sometimes True | 91(33.3) | 30(28.8) | 121(32.1) | |
| Often True | 52(19) | 21(20.2) | 73(19.4) | |
| The food available to me from my usual food sources was not of adequate quality | 0.72 | |||
| Never True | 125(45.8) | 51(49) | 176(46.7) | |
| Sometimes True | 96(35.2) | 32(30.8) | 128(34) | |
| Often True | 52(19) | 21(20.2) | 73(19.4) | |
| The food available to me form my usual sources was not safe | ||||
| Never True | 170(62.3) | 66(63.5) | 236(62.6) | |
| Sometimes True | 59(21.6) | 19(18.3) | 78(20.7) | |
| Often True | 44(16.1) | 19(18.3) | 63(16.7) | |
| I could not go grocery shopping or get food because I did not have transportation | 0.37 | |||
| Never True | 124(45.4) | 55(52.9) | 179(47.5) | |
| Sometimes True | 92(33.7) | 28(26.9) | 120(31.8) | |
| Often True | 57(20.9) | 21(20.2) | 78(20.7) | |
| I could not go grocery shopping or to get food because there were physical barriers to getting there (such as road closures, store closures, lockdowns/curfews) | 0.32 | |||
| Never True | 110(40.3) | 35(33.7) | 145(38.5) | |
| Sometimes True | 105(38.5) | 40(38.5) | 145(38.5) | |
| Often True | 58(21.2) | 29(27.9) | 87(23.1) | |
| I could not go grocery shopping or to get food because I was concerned about health and safety risks of getting there or being in stores | 0.57 | |||
| Never True | 115(42.1) | 49(47.1) | 164(43.5) | |
| Sometimes True | 102(37.4) | 33(31.7) | 135(35.8) | |
| Often True | 56(20.5) | 22(21.2) | 78(20.7) | |
| Food was a source of worry, anxiety, and/or stress to me | 0.51 | |||
| Never True | 123(45.1) | 49(47.1) | 172(45.6) | |
| Sometimes True | 97(35.5) | 33(31.7) | 130(34.5) | |
| Often True | 53(19.4) | 18(17.3) | 71(18.8) | |
| I was not able to enjoy my meals because I could not eat in the company of others | 0.51 | |||
| Never True | 161(59) | 67(64.4) | 228(60.5) | |
| Sometimes True | 90(33) | 28(26.9) | 118(31.3) | |
| Often True | 49(17.9) | 20(19.2) | 69(18.3) | |
| I was not able to cook or prepare meals that I enjoy | ||||
| Never True | 123(45.1) | 53(51) | 176(46.7) | |
| Sometimes True | 97(35.5) | 33(31.7) | 130(34.5) | |
| Often True | 53(19.4) | 18(17.3) | 71(18.8) | |
| I lacked necessary equipment (such as a stove, refrigerator) to prepare meals and safely store food | 0.53 | |||
| Never True | 134(49.1) | 56(53.8) | 190(50.4) | |
| Sometimes True | 90(33) | 28(26.9) | 118(31.3) | |
| Often True | 49(17.9) | 20(19.2) | 69(18.3) | |
| I lacked necessary services (such as electricity, water) to prepare meals and safely store food | 0.84 | |||
| Never True | 100(36.6) | 40(38.5) | 140(37.1) | |
| Sometimes True | 113(41.4) | 44(42.3) | 157(41.6) | |
| Often True | 60(22) | 20(19.2) | 80(21.2) | |
| I had to make changes to my food purchases because of changes in my budget or because the price of food increased | 0.94 | |||
| Never True | 104(38.1) | 39(37.5) | 143(37.9) | |
| Sometimes True | 100(36.6) | 40(38.5) | 140(37.1) | |
| Often True | 69(25.3) | 25(24) | 94(24.9) | |
Multiple Correspondence Analysis
The measures of item adequacy, namely the Keiser-Meyer-Olkin statistic was 0.95 and the Barlett’s Test of Sphericity was p < 0.05. The scree plot indicated only one factor of relevance. Inter-item correlation indicated strong positive associations across the 15 DFSS variables. These analyses supported the decision that these items were adequate for conducting factor analysis using the set of data selected. Table 4 highlights the factor loadings of each of the 15 DFSS survey items onto the one relevant factor identified. For the overall 377 sample of participants who had experienced a disaster, all survey items loaded significantly at > 0.3 onto the factor, and 11 items loaded at > 0.5. These variables explain 63.9% of the variance in the data. When the sample was stratified by rural participants vs. non-rural participants, the factor loadings did not change significantly and neither did the variance. This suggested that the scale with 15 items may be structurally valid across both groups in separate geographical locations.
Table 4. Multiple Correspondence Analysis Reporting on Factor Loadings and Variance Explained by Disaster Food Security Scale Items
| Disaster Food Security Scale Items | Overall | Rural | Non-Rural |
| Food Supply | 0.47 | 0.43 | 0.49 |
| Food Selection | 0.45 | 0.37 | 0.49 |
| Right Foods for Dietary Needs | 0.54 | 0.43 | 0.59 |
| Adequate Food Quality | 0.63 | 0.59 | 0.64 |
| Adequate Food Safety | 0.61 | 0.70 | 0.58 |
| Transportation | 0.55 | 0.61 | 0.53 |
| Physical Barriers | 0.48 | 0.51 | 0.47 |
| Health and Safety Issues | 0.51 | 0.48 | 0.53 |
| Food as a Source of Worry | 0.61 | 0.66 | 0.59 |
| Meal Enjoyment | 0.57 | 0.59 | 0.57 |
| Cooking | 0.61 | 0.56 | 0.63 |
| Equipment | 0.60 | 0.62 | 0.60 |
| Services | 0.45 | 0.35 | 0.49 |
| Food Budget | 0.53 | 0.43 | 0.57 |
| Clean and Safe Preparation Space | 0.55 | 0.66 | 0.51 |
| Eigen Value | 0.30 | 0.28 | 0.30 |
| Variances (%) | 63.8 | 61.3 | 63.9 |
Confirmatory Factor Analysis
The results of the confirmatory factor analysis performed following the identification of the items that load onto the factor are presented in Table 5. First, for the full 15-item scale, all the model fit statistics were adequate at their respective cut-off values described in the methods section, with the exception of Root Mean Square Error of Approximation. Since four out of the five statistics were adequate, the analysis suggested that the internal validity of the scale was also adequate. For that same model, when multigroup confirmatory factor analysis was conducted to test measurement invariance of the scale when applied to rural vs. non-rural populations, the results were sustained, indicating that the scale worked just as well in both groups.
Additionally, in a second confirmatory factor analysis, the scale was restricted to the 11 items which loaded at > 0.50 onto the factor. Similarly, to the previous analysis, all the model fit statistics were adequate at their respective cut-off values described in the methods section, with the exception of Root Mean Square Error of Approximation. These statistics confirm that the 11-item scale was also a good fit across rural vs. non-rural populations.
Table 5. Model Fits From Confirmatory Factor Analysis for Disaster Food Security Scale Chosen Items
| Full Model Considering Items Loading at >0.3 on the Factor (15 items) | |||||
| Modified Model Considering Items Loading at >0.5 on the Factor (11 items) | |||||
Validity Assessment
The validity assessments focused on convergent, predictive, discriminant and differentiation by different groups. As illustrated in Table 6 below, all four validity analyses indicated significant correlation with the scale among the total participants who remembered their disaster experience. As expected, those who received food assistance had higher scores of food insecurity during disasters indicating convergent validity, i.e., it shows how the scale is related to another construct that is close to the disaster food security construct. Similarly, those who reported being water insufficient during the disaster event had higher scores on the DFSS indicating discriminant validity, i.e., it indicates how similar the scale is to another closely related construct. Hispanic groups were found to score higher on the disaster food security scale as well suggesting differentiation by known groups, i.e., it shows how the scale differentiates between groups known to have differential food security status. Those with better self-reported perceived health status had lower scores on the scale indicating predictive validity, i.e., how the scale is related to a variable it is known to be associated with. While the results were consistent among the non-rural populations, only convergent and discriminant validities were adequate for the rural population.
Table 6. Validity Analyses for the Disaster Food Security Scale
| Validity type | Convergent | Predictive | Discriminant | Differentiation |
| β (95% Confidence Internal) | ||||
| Total Sample Assessment (n=377) | ||||
| Food Assistance | 3.88 (2.89, 4.87) |
|||
| Perceived Health Status | -0.61 (-1.12) |
|||
| Water Insufficiency | ||||
| Sometimes | 5.84 (4.68, 6.99) |
|||
| Often | 4.30 (3.19, 5.41) |
|||
| Hispanic Ethnicity | 2.31 (0.80, 3.83) |
|||
| Rural Sample Only (n=104) | ||||
| Food Assistance | 4.83 (3.06, 6.59) |
|||
| Perceived Health Status | -0.26 (-1.20, 0.68) |
|||
| Water Insufficiency | ||||
| Sometimes | 4.97 (2.69, 7.24) |
|||
| Often | 4.56 (2.41, 6.71) |
|||
| Hispanic Ethnicity | 0.53 (-3.00, 4.09) |
|||
| Non-Rural Sample Only (n=273) | ||||
| Food Assistance | 3.65 (2.45, 4.85) |
|||
| Perceived Health Status | -0.75 (-1.36, -0.14) |
|||
| Water Insufficiency | ||||
| Sometimes | 6.19 (4.85, 7.53) |
|||
| Often | 4.21 (2.91, 5.52) |
|||
| Hispanic Ethnicity | 2.69 (1.00, 4.38) |
|||
Discussion
The goal of this study was to develop a measure for food security in disaster settings. We used rigorous analytical procedures to develop and validate these measures among U.S. households who had experienced disasters in the five years prior to April 2023. Although disaster food security was defined as multidimensional, the construct created through the scale development process was unidimensional (Clay, L.A. et al., 2023). This is helpful since it will allow the development and scoring of a single composite scale to capture multiple aspects of food security during, when preparing for, and when recovering from disasters. For instance, the scale created here includes items representative of the four dimensions of accessibility, acceptability, availability, and agency, beyond the financial aspect of food security.
When the DFSS was stratified by rural and non-rural populations, no significant differences in the disaster food security experience items were identified between the two groups. This indicates that the items used to create the scale to represent the disaster food security construct were consistent suggesting that the scale is structurally valid across different types of populations. Given the distinct differences in the built and social environment between rural and non-rural contexts, needing more or different items or dimensions to capture the full experience of barriers to food security was a potential. A single scale across contexts is beneficial for monitoring communities following disasters when time and resources are limited.
When selecting a reduced set of items to create the scale, there were slight differences in the magnitude of the item correlations with the factor, but no differences in which items loaded on the factor between the rural and non-rural groups. This further supports the structural validity of the scale developed. It should be noted that in the 11-item scale, the four variables that were excluded (lower food supply, limited food selection, physical barriers to food sources and access to services such as electricity) may be more relevant for consideration in rural settings where it can be more difficult to address issues of food supply, food delivery to stores, flooding, road closures and getting services back up. Nevertheless, based on our validity assessments, there is no indication that the current DFSS is not an adequate measure of the disaster food security construct even in rural communities. Nevertheless, in future research activities, accuracy of the scale needs to be further investigated.
For the full sample and the non-rural sample of participants having experienced a disaster, there was significant convergent, predictive, discriminant and differentiation validity for the DFSS. However, predictive and differentiation for the rural population were not correlated with the scale. This may be due to the small sample size that does not allow enough power for these analyses, as summarized in Table 2.
Conclusions
Public Health Implications
A validated scale for a disaster context is beneficial for monitoring food and nutrition security when time and resources are finite. With increasing frequency and severity of climate disasters in the United States, this scale provides a more comprehensive tool for conducting surveillance of food security over time compared to the USDA Household Food Security Scale Module. The DFSS measures food security disruption from a systems perspective and therefore identifies where a disruption is occurring in the food system and can provide information about a more diverse set of food system interventions beyond monetary assistance. Public health and emergency management professionals can use the DFSS to conduct surveillance of food security over time amid climate change. In the aftermath of a disaster event, local officials can use the DFSS to monitor food security in disaster affected areas and identify types of disruption so that interventions address the specific disruption occurring.
Preliminary analyses support the use of a single scale for non-rural and rural populations. For a health department that wants to monitor food security in the context of disasters or to monitor changes in food access over time in the context of climate change, a single measure is sufficient. The benefits of this approach are a single data collection effort that is briefer for a jurisdiction that includes both non-rural and rural areas. Further the measure can remain brief with one set of questions that apply to both the non-rural and rural context instead of a measure for a heterogeneous non-rural and rural population that includes a longer set of items to capture both contexts. In a post-disaster context, time and resources are limited and there is greater need than resources are available.
The data collection instrument has already been published on DesignSafe-CI with the protocol for development and validation (Clay et al., 2023). Health departments can access this instrument freely for data collection in their jurisdiction. Information from the DFSS data can provide information on the proportion of the population experiencing food insecurity and what barriers to food access are driving the insecurity (e.g., infrastructure, social, or dietary barriers) beyond financial limitations of current food insecurity measures. With information on specific barriers to food access, interventions can be planned to bolster food security. For example, if kitchen infrastructure is lacking for a proportion of the population, interventions to provide kitchen infrastructure could be implemented to improve food security or if foods appropriate for medical or cultural dietary needs are a barrier to food security, then interventions to increase the availability of specific foods could improve food security.
Limitations
While this study is novel and its implementation will bring about significant improvements in the measures of food security, it is not without limitations. First, the number of respondents who reported remembering disasters in the five years prior to the survey was small. Monte Carlo simulation studies suggest that a sample of at least 300 participants is adequate for factor analysis, even with missing observations and with at least 4 variables per factor (Kyriazos, 201851; Wirth & Edwards, 200752). Therefore, while the full sample of 377 participants was adequate for the factor analysis, the rural and non-rural samples alone were not. Nevertheless, all variables loaded at significantly high positive correlations with the factor representing the disaster food security construct. Second, the survey responses may include recall bias since the timeframe for recall was long. However, prior studies on experiences of disasters suggest that people do not easily forget their experiences of such traumatic events (Norris et al., 200253). Therefore, we may assume that those who reported remembering the experiences were able to answer the disaster food security questions with high accuracy. Third, this scale has been developed in the U.S. context only and it is unclear how valid disaster food security experiences compare to low- and middle-income countries or even other high-income countries. Additionally, although we asked about the type of disaster that the participants experienced, we did not have enough power to do a multigroup confirmatory factor analysis to determine whether the DFSS is valid across different types of hazards.
Future Research Directions
To address some of the limitations listed above, we will conduct future research on these four topics to further enhance the validity of this scale:
- recruiting a larger sample of participants with the ability to recall their food security experiences during disasters to increase the power of the study for statistical reliability;
- collecting data from a sample of the population having experienced disasters more recently to minimize recall bias and ensure accuracy of responses to survey items;
- conducting focus groups to further expand the scale to represent the severity of disaster food security, thus allowing the scale to identify populations at greater risk; and
- testing the validity of the scale in different populations, countries, languages and types of hazards
Acknowledgments. The research team would like to acknowledge the team that developed and validated the Disaster Food Security Framework: Stephanie Rogus, Ph.D., New Mexico State University, Department of Family and Consumer Sciences, New Mexico State University; Uriyoán Colón-Ramos, ScD, MPA, George Washington University; Azmal Hossan, MA, Doctoral Student, Department of Sociology, Colorado State University; Roni Neff, Ph.D., Department of Environmental Health and Engineering and Program Director at the Center for a Livable Future, Johns Hopkins Bloomberg School of Public Health; Rachel M. Zack, ScD, ScM, The Greater Boston Food Bank; and Meredith T. Niles, Ph.D., Department of Nutrition and Food Sciences at the University of Vermont.
References
-
Gundersen, C., & Ziliak, J. P. (2015). Food insecurity and health outcomes. Health Affairs, 34(11), 1830–1839. ↩
-
Feeding America. (n.d.a). Hunger in America. Retrieved June 1, 2023, from https://www.feedingamerica.org/hunger-in-america ↩
-
Economic Research Service. (2022). Food security in the US - Survey tools. U.S. Department of Agriculture. https://www.ers.usda.gov/topics/food-nutrition-assistance/food-security-in-the-u-s/survey-tools/ ↩
-
Marques, E. S., Reichenheim, M. E., de Moraes, C. L., Antunes, M. M. L., & Salles-Costa, R. (2015). Household food insecurity: A systematic review of the measuring instruments used in epidemiological studies. Public Health Nutrition, 18(5), 877–892. ↩
-
Economic Research Service. (2015). Food security in the US - Measurement. USDA. http://www.ers.usda.gov/topics/food-nutrition-assistance/food-security-in-the-us/measurement.aspx ↩
-
Clay, L., Koyratty, N., Rogus, S., Niles, M., Colón-Ramos, U., Hossan, A., Neff, R., Josephson, A., & Zack, R. (2023). Disaster Food Security Framework. DesignSafe-CI. https://doi.org/10.17603/ds2-by4d-2q92 ↩
-
Clay, L. A., Koyratty, N., Rogus, S., Colon-Ramos, U., Hossan, A., Josephson, A., Neff, R., Zack, R. M., & Niles, M. T. (2023). Disaster Food Security Framework development, validation, and testing [Manuscript submitted for publication]. Department of Emergency Health Services, University of Maryland Baltimore County ↩
-
Economic Research Service (n.d.) Twenty-five years of food security measurement: Extramural research grants. U.S. Department of Agriculture. Retrieved June 1, 2023, from https://www.ers.usda.gov/topics/food-nutrition-assistance/food-assistance-data-collaborative-research-programs/twenty-five-years-of-food-security-measurement-extramural-research-grants/ ↩
-
Clay, L. (2023). Post-disaster food & nutrition security: The Disaster Food Security Framework (DFSF). Local and Regional Food System Response to COVID. https://lfscovid.localfoodeconomics.com/resources/post-disaster-food-nutrition-security-the-disaster-food-security-framework-dfsf/ ↩
-
Christensen, K. A., Hazzard, V. M., Richson, B. N., & Hagan, K. E. (2022). Measures used with populations with food insecurity: A call for increased psychometric validation. Journal of the Academy of Nutrition and Dietetics, 122(10), 1833–1836. https://doi.org/10.1016/j.jand.2022.05.017 ↩
-
Ayala, A., & Meier, B. M. (2017). A human rights approach to the health implications of food and nutrition insecurity. Public Health Reviews, 38(1), 10. https://doi.org/10.1186/s40985-017-0056-5 ↩
-
Universal Declaration of Human Rights. (1948). https://www.un.org/en/universal-declaration-human-rights/ ↩
-
American Red Cross. (2014). Annual Report 2014. https://www.redcross.org/content/dam/redcross/atg/PDF_s/Publications/Annual_Reports/2014AnnualReport.pdf ↩
-
Food Research Action Center. (2006). An advocate’s guide to the disaster food stamp program. Food Research and Action Center. ↩
-
U.S. Department of Agriculture. (2012, November 5). USDA offers food assistance to those affected by Hurricane Sandy. https://www.fns.usda.gov/pressrelease/2012/034012 ↩
-
Food and Nutrition Service. (n.d.). State guidance on coronavirus pandemic EBT (P-EBT). U.S. Department of Agriculture Retrieved June 1, 2023, from https://www.fns.usda.gov/snap/state-guidance-coronavirus-pandemic-ebt-pebt ↩
-
Healthy Eating Research. (2020). COVID-19 Rapid-Response Funding Opportunity Focused on the Federal Nutrition Assistance Programs. Healthy Eating Research, a project of the Robert Wood Johnson Foundation. ↩
-
Coleman, L. (2006). Frequency of man‐made disasters in the 20th century. Journal of Contingencies and Crisis Management, 14(1), 3–11. https://doi.org/10.1111/j.1468-5973.2006.00476.x ↩
-
Intergovernmental Panel on Climate Change. (2014). AR5 Climate Change 2014: Impacts, adaptation, and vulnerability. Cambridge University Press. https://www.ipcc.ch/report/ar5/wg2/ ↩
-
Carmichael, T., Collins, A. J., & Hadžikadić, M. (2019). Complex adaptive systems. Springer. ↩
-
Cook, J. T., Black, M., Chilton, M., Cutts, D., Ettinger de Cuba, S., Heeren, T. C., Rose-Jacobs, R., Sandel, M., Casey, P. H., & Coleman, S. (2013). Are food insecurity’s health impacts underestimated in the US population? Marginal food security also predicts adverse health outcomes in young US children and mothers. Advances in Nutrition, 4(1), 51–61. ↩
-
Drennen, C. R., Coleman, S. M., Ettinger de Cuba, S., Frank, D. A., Chilton, M., Cook, J. T., Cutts, D. B., Heeren, T., Casey, P. H., & Black, M. M. (2019). Food insecurity, health, and development in children under age four years. Pediatrics, 144(4). ↩
-
Lee, J., Gundersen, C., Cook, J., Laraia, B., & Johnson, M. (2012). Food insecurity and health across the lifespan. Advances in Nutrition, 3(5), 744–745. https://doi.org/10.3945/an.112.002543 ↩
-
Shankar, P., Chung, R., & Frank, D. A. (2017). Association of food insecurity with children’s behavioral, emotional, and academic outcomes: A systematic review. Journal of Developmental & Behavioral Pediatrics, 38(2), 135–150. ↩
-
Cook, J. T. (2002). Clinical implications of household food security: Definitions, monitoring, and policy. Nutrition in Clinical Care, 5(4), 152–167. ↩
-
Cook, J. T., Frank, D. A., Berkowitz, C., Black, M. M., Casey, P. H., Cutts, D. B., Meyers, A. F., Zaldivar, N., Skalicky, A., Levenson, S., Heeren, T., & Nord, M. (2004). Food insecurity is associated with adverse health outcomes among human infants and toddlers. The Journal of Nutrition, 134(6), 1432–1438. https://doi.org/10.1093/jn/134.6.## ↩
-
Cook, J. T., & Frank, D. A. (2008). Food security, poverty, and human development in the United States. Annals of the New York Academy of Sciences, 1136(1), 193–209. ↩
-
Ettinger de Cuba, S., Casey, P. H., Cutts, D., Heeren, T. C., Coleman, S., Bovell-Ammon, A. R., Frank, D. A., & Cook, J. T. (2018). Household food insecurity positively associated with increased hospital charges for infants. Journal of Applied Research on Children: Informing Policy for Children at Risk, 9(1), 8. ↩
-
Coleman-Jensen, A., Rabbitt, M., & Singh, A. (2020). Household food security in the United States in 2019. U.S. Department of Agriculture, Economic Research Service. https://www.ers.usda.gov/publications/pub-details/?pubid=99281 ↩
-
Thomas, D. S. K., Phillips, B. D., Lovekamp, W. E., & Fothergill, A. (2013). Social vulnerability to disasters. CRC Press. ↩
-
Rose, D. (1999). Economic determinants and dietary consequences of food insecurity in the United States. The Journal of Nutrition, 129(2S Suppl), 517S-520S. https://doi.org/10.1093/jn/129.2.517S ↩
-
Rose, D., Gundersen, C., & Oliveira, V. (1998). Socio-economic determinants of food insecurity in the United States: Evidence from the SIPP and CSFII Datasets. Technical Bulletin No. TB-1869 20. Economic Research Service, U.S. Department of Agriculture. https://www.ers.usda.gov/publications/pub-details/?pubid=47215 ↩
-
Clay, L., Papas, M., Gill, K., & Abramson, D. (2018). Application of a theoretical model toward understanding continued food insecurity post Hurricane Katrina. Disaster Medicine and Public Health Preparedness, 12(1), 47–56. https://doi.org/10.1017/dmp.2017.35 ↩
-
Clay, L., & Ross, A. (2020). Factors associated with food insecurity following Hurricane Harvey in Texas. International Journal of Environmental Research and Public Health, 17(3), 762. https://doi.org/10.3390/ijerph17030762 ↩
-
Clay, L. (2019). Field report: Issues in the post-disaster food environment during the immediate response to Hurricane Florence. Disaster Prevention and Management: An International Journal, 29(3), 379–389. https://doi.org/10.1108/DPM-12-2018-0381 ↩
-
Glanz, K., Sallis, J., Saelens, B., & Frank, L. (2007). Nutrition Environment Measures Survey in stores (NEMS-S): Development and evaluation. American Journal of Preventive Medicine, 32(4), 282–289. ↩
-
Clay, L., Slotter, R., Heath, B., Lange (Leach), V., & Colón-Ramos, U. (2021). Capturing disruptions to food availability after disasters: Assessing the food environment following Hurricane Florence and Maria. Disaster Medicine and Public Health Preparedness, 17, 1–8. https://doi.org/10.1017/dmp.2021.145 ↩
-
Clay, L., & Heath, B. (2020, July 16). Health and social consequences of food environment disruption due to COVID-19 [Meeting presentation]. International Research Committee on Disasters Meeting. ↩
-
Coleman-Jensen, A., Rabbitt, M. P., Gregory, C. A., & Singh, A. (2022). Household food security in the United States in 2021. U.S. Department of Agriculture, Economic Research Service. https://www.ers.usda.gov/webdocs/publications/104656/err-309.pdf ↩
-
Feeding America. (n.d.b). Rural hunger facts. https://www.feedingamerica.org/hunger-in-america/rural-hunger-facts ↩
-
Rural Health Information Hub. (n.d.). Rural hunger and access to healthy food overview. Retrieved June 1, 2023, from https://www.ruralhealthinfo.org/topics/food-and-hunger ↩
-
Davis, J. R., Wilson, S., Brock-Martin, A., Glover, S., & Svendsen, E. R. (2010). The impact of disasters on populations with health and health care disparities. Disaster Medicine and Public Health Preparedness, 4(1), 30–38. ↩
-
National Center for Health Statistics. (2023, April 6). Urban Rural Classification Scheme for Counties. https://www.cdc.gov/nchs/data_access/urban_rural.htm ↩
-
Greenacre, M., & Blasius, J. (2006). Multiple correspondence analysis and related methods. Chapman and Hall/CRC. ↩
-
Tobias, S., & Carlson, J. E. (1969). Brief report: Bartlett’s test of sphericity and chance findings in factor analysis. Multivariate Behavioral Research, 4(3), 375–377. ↩
-
Hays, R. D., Sherbourne, C. D., & Mazel, R. M. (1993). The rand 36‐item health survey 1.0. Health Economics, 2(3), 217–227. ↩
-
Hu, L., & Bentler, P. M. (1999). Cutoff criteria for fit indexes in covariance structure analysis: Conventional criteria versus new alternatives. Structural Equation Modeling: A Multidisciplinary Journal, 6(1), 1–55. ↩
-
Kline, R. B. (2023). Principles and practice of structural equation modeling. Guilford Publications. ↩
-
Lê, S., Josse, J., & Husson, F. (2008). FactoMineR: An R package for multivariate analysis. Journal of Statistical Software, 25, 1–18. ↩
-
StataCorp. 2021. Stata Statistical Software: Release 17. https://www.stata.com/stata-news/news36-2/. ↩
-
Kyriazos, T. A. (2018). Applied psychometrics: Writing-up a factor analysis construct validation study with examples. Psychology, 9(11), 2503. ↩
-
Wirth, R., & Edwards, M. C. (2007). Item factor analysis: Current approaches and future directions. Psychological Methods, 12(1), 58. ↩
-
Norris, F. H., Friedman, M. J., & Watson, P. J. (2002). 60,000 disaster victims speak: Part II. Summary and implications of the disaster mental health research. Psychiatry: Interpersonal and Biological Processes, 65(3), 240–260. ↩
Clay, L., Koyratty, N., Josephson, A., & Byker Shanks, C. (2023). Validating the Disaster Food Security Scale for Rural U.S. Populations (Natural Hazards Center Public Health Disaster Research Report Series, Report 33). Natural Hazards Center, University of Colorado Boulder. https://hazards.colorado.edu/public-health-disaster-research/validating-the-disaster-food-security-scale-for-rural-u-s-populations