Dynamic Risk Perception and Behavior in Response to COVID-19
Publication Date: 2021
Abstract
The frequencies and magnitudes of hazards and associated risks in modern society can be exacerbated by globalization and environmental change at local, regional, and global levels. Risk perception and related behavior constitute a fundamental theme in risk analysis. Despite the inherent dynamic nature of risk events, the temporal dimension of risk perception and behavior has been understudied in the current risk science literature. Longitudinal research design is largely lacking in this field as previous studies mostly used cross-sectional data. Infectious disease outbreaks provide a key setting for analyzing changing perception of and response to natural or human-induced hazards. In this study, we examine dynamic risk perception and behavior in response to the coronavirus disease 2019 (COVID-19) in four major U.S. cities (Seattle, Los Angeles, Chicago, and New York City). The main objectives of this research are: (1) to assess temporal changes in major dimensions of perceived COVID-19 risk and behavioral response; (2) to explore the dynamic relationship between risk perception and behavior in response to COVID-19; and (3) to analyze key factors influencing temporal changes in COVID-19 risk perception. We collected timely data on residents’ perceptions and actions related to the COVID-19 outbreak through a series of three online surveys. The analysis of panel survey data revealed significant temporal changes in different dimensions of COVID-19 risk perceptions (perceived likelihood of infection, perceived harmfulness if infected, and level of anxiety) and preventive actions. Cross-lagged path models exhibited positive correlations between risk perceptions and preventive actions in each study phase, and varied across-time relationships between individual dimensions of risk perception and actions. Further regression analysis also showed that level of preventive actions had a negative effect on subsequent changes in all three risk perception indicators. These findings can inform further development of conceptual approaches to the interactions between risk perception and behavioral responses, and have important implications for both health risk management and future research directions.
Introduction
The frequencies and magnitudes of hazards and associated risks in modern society can be exacerbated by globalization and environmental change at local, regional, and global levels. Risk perception and related behavior constitute a fundamental theme in risk analysis. Despite the inherent dynamic nature of risk events, the temporal dimension of risk perception and behavior has been understudied in the current risk science literature. Longitudinal research design is largely lacking in this field as previous studies mostly used cross-sectional data (Bubeck & Botzen, 20131; Loewenstein & Mather, 19902; Rogers, 19973; Siegrist, 20134). Infectious disease outbreaks provide a key setting for analyzing changing perception of and response to natural or human-induced hazards. In this study, we examine the dynamic risk perception and behavior in response to the coronavirus disease 2019 (COVID-19) in four major U.S. cities (Seattle, Los Angeles, Chicago, and New York City). The main objectives of this research are: (1) to assess temporal changes in major dimensions of perceived COVID-19 risk and behavioral response; (2) to explore the dynamic relationship between risk perception and behavior in response to COVID-19; and (3) to analyze key factors influencing temporal changes in COVID-19 risk perception. This quick response research can contribute to a better understanding of the dynamics of risk perception and behavior through collecting timely information on study city residents’ attitudes and actions in response to the new coronavirus outbreak. Our data and analysis have the potential to strengthen research infrastructure for longitudinal risk studies. Additionally, this work can help to increase local public awareness of the COVID-19 outbreak in the study cities, and support the development of future epidemic management strategies.
Literature Review
Theories of risk generally overlook the temporal dimension of perceived risk and behavioral response. However, several long-standing frameworks can shed light on the dynamics of risk perception and action. The well-known “issue-attention cycle” model suggests people’s concerns about societal problems generally decline as they fade from public attention (Downs, 19725). The social amplification of risk framework also moves beyond a typical static perspective and illuminates the psychological, sociocultural, institutional, and environmental processes through which risk perception and risk-related behavior are amplified or attenuated (Kasperson et al., 19886).
Existing empirical risk studies have examined temporal changes in the perceptions of a range of social, technological, and environmental risks, such as transport accidents, groundwater contamination, forest disturbance, extreme rainfalls, and global warming (e.g., Champ & Brenkert-Smith, 20167; Fitchen et al., 19878; Milfont, 20129; Nordfjærn & Rundmo10, 2010; Qin et al., 201511; Su et al., 201512). Risk perception is generally assumed to be a key factor influencing prevention or mitigation behavior. Nevertheless, the empirical relationship between risk perception and behavioral response is often found to be weak due to the dominant cross-sectional approach in risk analysis (Bubeck et al., 201213; Bubeck & Botzen, 2013; Siegrist, 2013; Weinstein et al., 199814). Using panel data on Lyme disease vaccination, (Brewer et al, 200415) provided evidence for three possible paths in the interrelationships between health risk perception (measured as perceived likelihood of infection) and preventive behavior: perception-behavior accuracy (risk perception accurately reflects risk/protective behavior), behavior motivation (risk perception causes the adoption of preventive action), and risk reappraisal (preventive behavior in turn lowers risk perception). Several trend studies (also known as repeated cross-sectional studies) traced temporal changes in public risk perception and prevention behavior in response to the H1N1 pandemic influenza (Ibuka et al., 201016; Jones & Salathe, 200917; Sherlaw & Raude, 201318). Perceived risk of being infected with H1N1 largely followed an inverted U-shape curve and was positively correlated with protective response or behavioral intention.
Overall, there has been increasing research on temporal changes in risk perception and the dynamic relationships between risk perceptions and related behavior in recent literature. However, existing studies have mainly adopted the trend study design and have not incorporated various dimensions of risk perceptions (perceived likelihood, perceived negative consequences, and affective factors) in the longitudinal analysis. Moreover, little is known about the influencing factors of different aspects of evolving risk perception. The present research attempts to address these literature gaps through the collection and analysis of panel data on perceived COVID-19 risk and behavioral response in the United States.
Based on a synthesis of relevant theoretical perspectives and empirical research, we have developed a number of research hypotheses to guide our data analysis and interpretation of results:
Perceived COVID-19 risk (including cognitive and affective factors) and preventive behavior can change over time.
COVID-19 risk perception is significantly related with preventive behavior both within and across time (adapted perception-behavior and behavior motivation hypotheses).
Preventive behavior has a strong effect on changes in individual dimensions of perceived COVID-19 risk (adapted risk reappraisal hypothesis).
Research Design
Sampling and Participants
COVID-19 was first reported from Wuhan, China in late December 2019. Currently it has spread to over 200 countries and infected more than 55 million people worldwide, including nearly 11 million confirmed cases within the United States. In early February 2020, Centers for Disease Control and Prevention (CDC) officials announced that a coronavirus outbreak in the United States. would be inevitable. Four major U.S. metropolitan areas (Seattle, Los Angeles, Chicago, and New York City) were selected for this study as they are located in the states where evidence of community transmission of the coronavirus disease first emerged. We conducted three sequential online surveys at key stages of the U.S. COVID-19 episode. Potential panel survey participants in the four selected U.S. cities were recruited via email by the survey management company Qualtrics. This company has a large pool of individuals who have consented to receive invitations for online surveys. The initial sample for the first survey was generated based on the age, gender, and race/ethnicity distribution of the four study cities’ adult population. We collected 2,000 responses (approximately 500 for each city) for this baseline survey during the initial weeks of the COVID-19 outbreak (March 6-16). Internet surveys were then replicated with these respondents at two subsequent key junctions of this epidemic. The timing of the second survey corresponded with a period of rapidly increasing confirmed cases and the emergence of a peaking trend (March 27-April 14), while the third survey aligned with another surge of the COVID-19 outbreak in the study cities and across the whole country (July 9-August 7). In these two follow-up surveys, we replaced non-responders with new participants so that each of these three surveys had about 2,000 participants.
Data and Procedures
The survey instrument was designed to get a rapid assessment of respondents’ perceived severity of the new coronavirus outbreak, knowledge of the new coronavirus, satisfaction with relevant management entities, sources of information, risk perception, and preventive behaviors. It was pilot tested by colleagues with relevant specialties and further checked during the soft launch stage. We built on relevant measures and scales in the existing disaster and risk literature to develop major survey questions. Respondents were asked to describe the severity of the new coronavirus outbreak in their city and in the whole country using a scale ranging from 1 (not at all severe) to 5 (very severe). Knowledge of the new coronavirus was evaluated with a series of True/False questions based on COVID-19 materials from CDC, such as “The main symptoms of the new coronavirus disease include fever, cough, and difficulty breathing.” Responses were recoded (“0” incorrect and “1” correct) and summed to create an aggregate knowledge measure.
We asked participants to identify whether or not they relied on any of the COVID-19 information sources listed in the surveys, such as newspaper, radio, social media, healthcare providers, and federal government. A variable representing the total number of information sources was created based on answers (“0” no and “1” yes) to these questions. Respondents also indicated their satisfaction/dissatisfaction with how the new coronavirus issue had been managed by a number of entities: school districts, employers, local healthcare providers, city government, county government, state government, and federal government. Response options range from 1 (very dissatisfied) to 5 (very satisfied).
Key dimensions of perceived new coronavirus risk were measured by asking respondents to describe their perceived likelihood of infection, perceived potential harmfulness of infection, and level of anxiety using a 5-point ordinal scale, from 1 (very unlikely/not at all harmful or anxious) to 5 (very likely/harmful/anxious). They also self-reported changes in these aspects of risk perception during the past month using a scale ranging from 1 (strongly decreased) to 5 (strongly increased). Additionally, respondents were asked if they had taken any of a series of actions, such as washing hands frequently and avoiding public gatherings, in response to the new coronavirus outbreak during the past month. A composite preventive behavior index was created by summing dichotomous answers (“0” no and “1” yes). The surveys then ended with a few questions on socio-demographic characteristics including age (years), gender (female=1), race/ethnicity (recoded as white=1), education (1=less than a high school degree to 6=advanced degree, i.e., Master’s, JD, MD, PhD), political view (1=liberal to 3=moderate to 5=conservative), and income (1=less than $35,000 to 5=more than $100,000).
The primary unit and level of analysis is the individual. Data collected from those respondents who participate all three surveys were merged into a panel dataset. We assessed the representativeness of the Qualtrics survey samples by comparing information on respondent sociodemographic characteristics (age, gender, race/ethnicity, income, and educational attainment) with available census data for the study cities. Potential non-response bias in the follow-up surveys was also evaluated by checking if there were significant differences between respondents and non-respondents regarding sociodemographic characteristics and/or responses to major questions in the previous survey(s).
Ethical Considerations
There was severe urgency regarding quick response research on the new coronavirus disease as it was spreading fast in the United States and many other countries at the early stages of this global pandemic. The data collected in this study were perishable due to the dynamics of risk perception and behavior in response to infectious disease outbreaks. This research was approved by the University of Missouri-Columbia Institutional Review Board (Project Number: 2020744). Although the survey was conducted by researchers at the University of Missouri-Columbia, the corresponding study was not part of the University’s formal response to the COVID-19 outbreak.
Preliminary Findings
Data Analysis
This report focuses on analysis of the panel data including those 736 respondents who participated in all three online surveys. Data analysis procedures mainly followed the three research objectives and hypotheses (see above). First, we examined descriptive statistics of major variables in the survey data and checked bivariate correlations using appropriate statistical techniques (e.g., Pearson’s r statistic, Spearman’s rank correlation). We also ran one-way repeated measures ANOVA with post hoc tests to determine whether there were significant changes in risk perceptions, preventive behavior, and related indicators across different study phases. Next, longitudinal cross-lagged path analysis was used to evaluate the dynamic relationships between the three risk perception variables and preventive behavior. We generated final reduced models by removing non-significant parameters from initial saturated models. Variables with highly skewed distributions were first transformed to reduce the degree of skewness. Finally, we conducted a series of regression analyses to assess the effects of preventive actions on temporal changes in different dimensions of COVID-19 risk perception, while controlling for variations in major sociodemographic characteristics. Each regression model included two jointly determined outcome variables: change between Phases 1 and 2, and change between Phases 2 and 3. All the statistical analyses were conducted with SPSS and AMOS software (26.0.0 version).
Results
Characteristics of Panel Respondents
The personal characteristics of panel survey respondents where characterized as follows Endnote 1. The average age of these respondents was about 55 years, with a majority of them in the 35-64 age category. They reported living in their cities for an average of about 37 years. Other demographics include:
Gender: Female 44.7%; male 55.3%
Race/Ethnicity: White 68.1%; African American 9.0%; Asian 14.7%, and Hispanic/Latino 5.4%. The composition of this sample is comparable to relevant census data for the study cities.
Education and Income: More than 60% of the panel respondents attained four-year or higher college degrees, while nearly 75% earned $50,000 or more in 2019. The average education and income levels were between two year technical/associate degree and four-year college degree, and between $50,000 to $74,999 and $75,000 to $99,999, respectively.
Political Views: The sample as a whole held largely balanced political views. About 36.3% of respondents described their views as liberal or moderate liberal, 35.8% as moderate, and 27.9% as moderate conservative or conservative.
Temporal Changes in Major Variables
As shown in Table 1, there were significant changes across the three survey phases in panel respondents’ perceived severity of the COVID-19 outbreak, knowledge about COVID-19, sources of information, perceptions of COVID-19 risk, satisfaction with management entities, and preventive actions. Reported levels of COVID-19 severity in cities and in the whole country were moderate at first and increased substantially during the second phase. In Phase 3, perceived severity in cities decreased (but was still higher than the initial level), while perceived severity in the country remained largely the same. The panel respondents also generally showed good knowledge about COVID-19 and relied on multiple sources for relevant information. While both the composite knowledge indicator and the total number of information sources increased from Phase 1 to Phase 2, only the latter exhibited a statistically significant change (a reduction) in Phase 3.
Overall, panel respondents indicated moderate to high perceptions of COVID-19 risks. In each study phase, the reported level of perceived harmfulness if infected was relatively greater than levels of perceived likelihood of infection and anxiety. These three dimensions of COVID-19 risk perception also showed somewhat different patterns of change over time. Levels of both perceived likelihood of infection and perceived potential harmfulness became significantly higher in Phase 2 and stayed mostly unchanged afterwards. Level of anxiety about COVID-19 also initially saw an increase, but was relatively lower in Phase 3. Respondents also self-reported increases in all three risk perception dimensions in each study phase, particularly Phase 2.
Respondents were largely satisfied with all management entities except for the federal government regarding how the COVID-19 outbreak was handled. Satisfaction with these entities was higher in Phase 2 than in the other two phases, and there was generally no significant difference in this aspect between Phases 1 and 3. Nevertheless, satisfaction with local health providers was relatively greater in Phase 3 than in Phase 1. Respondents indicated similar levels of dissatisfaction with the federal government in the first two phases, and became even less satisfied in the last study period.
Additionally, the panel survey sample as a whole exhibited a rather high level of actions in response to the COVID-19 pandemic. The reported total number of preventive actions increased consistently across the three study phases (particularly the first two). Respondents generally considered these measures highly effective in terms of preventing infection with COVID-19. Wearing a face mask in public places was the least implemented action and was perceived as the least effective measure during the first two study phases. However, both its adoption and perceived effectiveness increased substantially in Phase 3.
Table 1. Temporal Change in Major Variables*
| Variable | P1 | P2 | P3 | Variable | P1 | P2 | P3 |
| Perceived COVID-19 severity in city | 2.68** | 3.95** | 3.64** | Satisfaction with non-federal government entities | 3.35** | 3.81** | 3.45** |
| Perceived COVID-19 severity in the country | 3.01** | 4.22 | 4.30 | Satisfaction with school districts | 3.33 | 3.91** | 3.27 |
| Knowledge about COVID-19 | 4.47** | 4.59 | 4.54 | Satisfaction with employers | 3.30 | 3.58** | 3.38 |
| Number of information sources | 4.18** | 4.91** | 4.47** | Satisfaction with local healthcare providers | 3.51** | 3.98** | 3.82** |
| Perceived likelihood of infection | 2.41** | 3.03 | 3.02 | Satisfaction with city government | 3.31 | 3.76** | 3.41 |
| Perceived harmfulness if infected | 3.47** | 4.00 | 3.95 | Satisfaction with county government | 3.30 | 3.73** | 3.33 |
| Level of anxiety | 2.89** | 3.65** | 3.44** | Satisfaction with state government | 3.32 | 3.88** | 3.47 |
| Number of preventive actions | 6.39** | 8.26** | 8.80** | Satisfaction with federal government | 2.69 | 2.77 | 2.17** |
Cross-Lagged Path Models
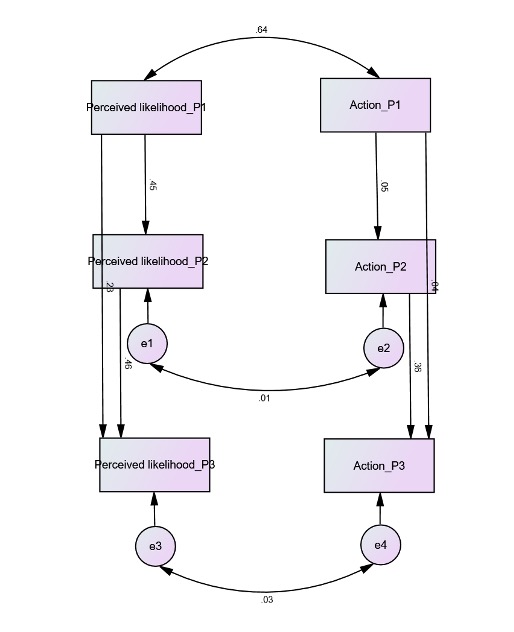
We built three path models to evaluate the dynamic relationships between individual dimensions of COVID-19 risk perception and preventive behavior across the study phases.Endnote 2 Figure 1 presents the final reduced model of the reciprocal relations between perceived likelihood of infection and actions. The analysis revealed strong temporal autoregressive paths for both indicators. The two were also positively related with each other at each study stage. However, none of the cross-lagged links between perceived likelihood of infection and actions showed a significant effect. Overall, major model fit measures were all considerably above desired thresholds (χ2 = 12.036, df = 6, p = 0.061; RMSEA = 0.037; CFI = 0.994).
Figure 1. Path Model of Cross-Lagged Relationships Between Perceived Likelihood of Infection and Preventive Action
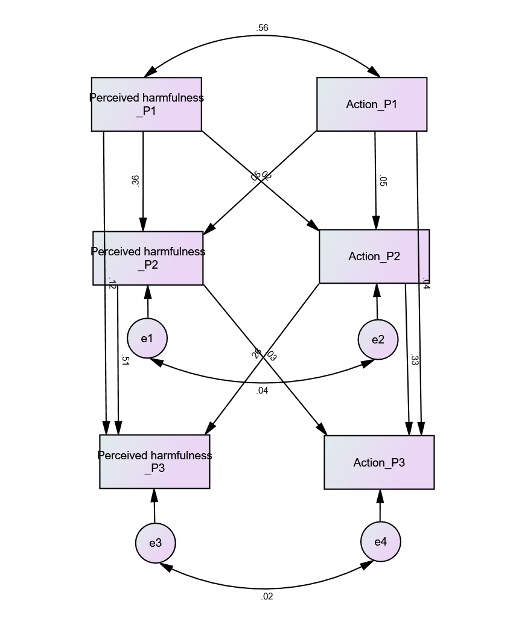
The final model of changing relations between perceived harmfulness if infected and preventive actions is shown in Figure 2. These two indicators also exhibited both significant temporal autocorrelations and within-time positive correlations through the three study phases. Additionally, the model identified significant cross-lagged relationships between perceived potential harmfulness and preventive action. Respective regression paths from perceived harmfulness in Phases 1 and 2 to action in Phases 2 and 3, and from action in Phases 1 and 2 to perceived harmfulness in Phases 2 and 3 all demonstrated a positive effect.Endnote 3 Good model fitness was again denoted by fit statistics (χ2 = 3.560, df = 2, p = 0.169; RMSEA = 0.033; CFI = 0.998).
Figure 2. Path Model of Cross-Lagged Relationships Between Perceived Harmfulness of Infection and Preventive Action
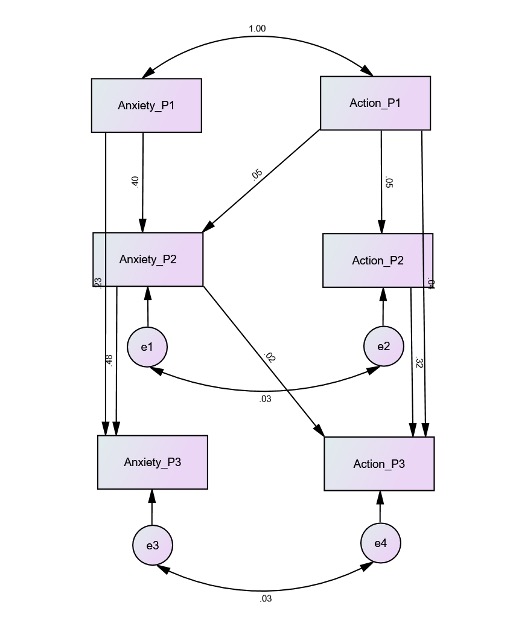
Finally, the reduced path model of the level of anxiety and preventive actions (Figure 3) shares some similar pattens with the previous two. Both anxiety and action had significant autoregressive paths from Phase 1 to Phases 2 and 3, and from Phase 2 to Phase 3. The model also includes positive correlations between anxiety and action within each study period. Only two cross-lagged regression paths were statistically significant: one from Phase 1 action to Phase 2 anxiety, and the other from Phase 2 anxiety to Phase 3 action. The fit measures consistently suggested satisfactory model fitness (χ2 = 3.510, df = 4, p = 0.476; RMSEA = 0.000; CFI = 1.000).
Figure 3. Path Model of Cross-Lagged Relationships Between Level of Anxiety and Preventive Action
Structural Regression Models
Figure 4 presents the template of structural regression models with two change outcome variables, their corresponding preventive action indicators, and a set of sociodemographic variables. Results of the regressions on changes in the three risk perception indicators are summarized in Table 2. Preventive actions in Phase 1 and Phase 2 consistently had a negative effect on changes in perceived likelihood, perceived potential harmfulness, and level of anxiety during Phases 1-2 and Phases 2-3, respectively. Greater Phase 2 activeness was related with increased levels of perceived harmfulness and anxiety from Phase 1 to Phase 2. Likewise, Phase 3 activeness was positively related with all three change measures for Phases 2 and 3.
Figure 4. Template of Structural Regression Models
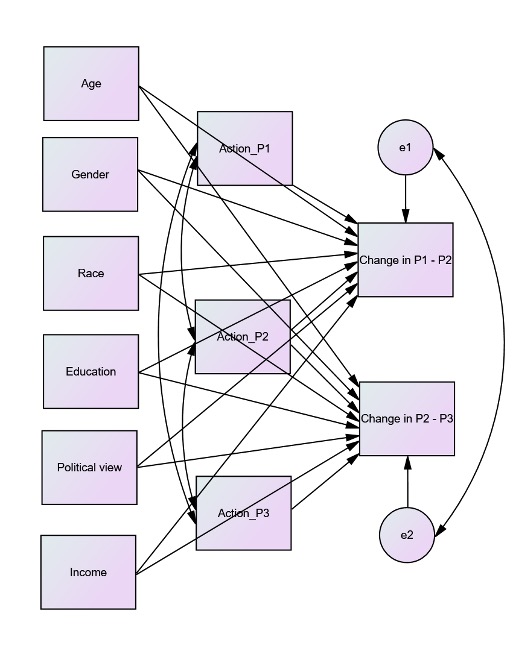
Table 2. Structural Regression Models of Risk Perception Change Variables
| Variable | Change in perceived likelihood of infection | Change in perceived harmfulness of infection | Change in the level of anxiety | |||
| Phases 1 and 2 | Phases 2 and 3 | Phases 1 and 2 | Phases 2 and 3 | Phases 1 and 2 | Phases 2 and 3 | |
| Age | 0.000 | 0.001 | -0.001 | 0.004(*) | 0.006* | -0.001 |
| Gender (female=1) | -0.069 | -0.075 | 0.023 | 0.089 | 0.085 | 0.071 |
| Race (white=1) | 0.046 | -0.067 | 0.260** | -0.049 | 0.162(*) | 0.123 |
| Education | -0.039 | 0.011 | 0.058(*) | -0.036 | 0.017 | 0.017 |
| Political view | -0.057(*) | 0.016 | -0.085** | -0.042 | -0.068* | -0.057(*) |
| Income | 0.031 | -0.067** | 0.004 | 0.030 | 0.028 | -0.042 |
| Action in Phase 1 | -0.064*** | n/a | -0.044* | n/a | -0.098*** | n/a |
| Action in Phase 2 | 0.279 | -0.516*** | 0.649*** | -0.408** | 0.624** | -0.395* |
| Action in Phase 3 | n/a | 0.638*** | n/a | 0.280* | n/a | 0.317* |
| N | 736 | 736 | 736 | |||
| χ2 (df) | 18.843 (18) | 19.381 (18) | 18.370 (18) | |||
| p | 0.402 | 0.369 | 0.432 | |||
| RMSEA | 0.008 | 0.010 | 0.005 | |||
| CFI | 0.999 | 0.998 | 1.000 | |||
Among the sociodemographic characteristics of respondents, political view showed the strongest influences on the dependent variables. Those with more conservative political views tended to report more negative (or less positive) changes in perceived likelihood and harmfulness of infection during Phases 1 and 2. They were also less likely to exhibit increased levels of anxiety across the three study stages. Several other sociodemographic factors affected temporal variations in specific dimensions of COVID-19 risk perceptions. Age was positively related with change in the level of anxiety during the first two study stages, and was also almost significant in its positive relation with adjustment in perceived harmfulness of infection through the latter two phases. White respondents were more likely to indicate increases in perceived harmfulness and anxiety (albeit to a smaller extent) than non-white and other respondents in Phase 2 as compared to Phase 1. Personal total income only showed a strong and negative effect on the difference in perceived likelihood of infection between Phase 2 and Phase 3. Gender and education were generally not significantly related to change in any of the three risk perception dimensions.
Discussion
This study examines the dynamic relationships between risk perception and related behavior in the context of the COVID-19 pandemic. The analysis revealed significant temporal changes in different dimensions of COVID-19 risk perceptions and preventive actions, as well as in perceived severity of the COVID-19 outbreak, knowledge about COVID-19, use of information sources, and satisfaction with management entities. Cross-lagged path models also exhibited significant temporal autocorrelations of all risk perception and behavior indictors, positive correlations between risk perception and preventive actions, and varied across-time relationships between individual dimensions of risk perception and actions. In particular, there were strong, reciprocal relations between perceived harmfulness of infection and preventive actions across the three study phases. Additionally, the regression analysis consistently showed that level of preventive actions had a negative effect on subsequent changes in perceived likelihood of infection, perceived harmfulness if infected, and level of anxiety. Preventive activeness was also found to be positively related with changes in individual dimensions of perceived COVID-19 risk at a given point of time. In contrast, sociodemographic factors largely had weaker and variant influences on these change outcome measures in the analysis.
Overall, findings of this research provide empirical support for the perception-behavior, behavior motivation, and risk reappraisal hypotheses on evolving relationships between risk perception and risk-related behavior, albeit to different degrees. While the perception-behavior accuracy hypothesis mostly postulates a negative relationship between risk perception and behavior (Brewer et al. 2004; Weinstein & Nicolich 199319; Weinstein et al. 1998), the empirical correlations between these two factors can be negative, positive, or non-significant depending on various conditions such as the types of risk, the effectiveness of preventive actions, and the timing of study. Their relations tend to be more positive than negative if the risk of interest involves a high level of uncertainty, if actions cannot completely prevent risk events, and/or if evaluations are conducted before the potential negative feedback of risk behavior on risk perception takes effect. Thus, the positive within-time correlations between measures of perceived COVID-19 risk and preventive actions identified in our path analysis are generally in line with results of many previous cross-sectional and longitudinal studies on risk perception and behavior in a range of settings (e.g., Champ et al., 201620; Ibuka et al., 2010; Jones & Salathe, 2009; Qin et al., 2015). Such conjoint linkages between risk perception and behavior are further confirmed by the positive relations between risk perception change measures and preventive action at specific study phases in the structural regression models.
This study also contributes to a refined understanding of the causation effect of risk perception on related behavior by measuring both cognitive and affective aspects of perceived risk. The analysis showed that perceived harmfulness of infection had a relative stronger influence on action in response to the COVID-19 outbreak than perceived likelihood of infection and anxiousness. This is not surprising as it is widely believed that only elder people and those with underlying health conditions (e.g., heart disease, diabetes) are at high risk of serious illness if infected with this disease.
Finally, this research produces mixed results with respect to the risk reappraisal effect. On one hand, the path analysis revealed preventive actions had a positive feedback effect on some risk perception dimensions, particularly perceived harmfulness of infection. On the other hand, the negative effects of preventive actions on relevant risk perception change variables in all regression models suggested that the risk reappraisal mechanism might not merely result in an absolute decrease in risk perception. Other possible outcomes along this path include a relatively slower increase in perceived risk or stabilized risk perception.
Conclusions and Implications
This quick response research project generates important empirical evidence on temporal changes in risk perception and related behavior as well as their changing relationships. These findings can inform further development of conceptual approaches to the interactions between dynamic risk perception and behavioral responses. The study also has direct implications for risk management in health and other relevant sectors. First, the analysis found perception of the COVID-19 risk, particularly perceived harmfulness of infection, is a major correlate or determinant of preventive actions. Therefore, measures to increase public awareness of or concern about health threats should be helpful in promoting proactive actions in response to risks. Second, health risk prevention and mitigation should adopt a dynamic perspective as both risk perception and related behavior do evolve over time. Community health management entities should track changing risk perceptions and responses, and adjust accordingly risk communication and preparedness strategies. Furthermore, since activeness may have a negative feedback on risk perception, special attention is needed for reinforcing cognitive and behavioral responses to health risks over a longer time span.
Additionally, this research can provide useful implications for future longitudinal risk analysis. Although we tried to match the sociodemographic characteristics of our survey samples with those of the general populations in the study cities, the final panel sample was not completely representative of local populations due to the use of Qualtrics’s pool of registered participants and the attrition of respondents across study phases. Nevertheless, the perishable nature of data collected for this study and our emphasis on the panel data analysis can lessen the concern on this limitation to an extent. Further research on the dynamic relationships between risk perception and risk behavior can benefit from a refined sampling process and enhanced representativeness of the panel data.
While our findings partially support major risk perception-behavior hypotheses, the analysis suggested their dynamic relationships were more complicated than conventionally conceived. The reciprocal relations between risk perception and risk behavior are contingent on a range of factors including specific categories of hazards and risks, dimensions of risk perception, characteristics of behavioral responses, and stages of evolving risk events. Thus, it is necessary to repeat and expand this longitudinal research design in the contexts of other health, socioeconomic, technological, and environmental risks. Convergent research approaches, such as comparative analysis and meta-studies, can eventually help to identify common patterns across individual case studies when sufficient empirical evidence is accumulated in the risk analysis literature.
Endnotes
Endnote 1: Compared to the three full survey samples, the panel sample had a higher average age, a lower proportion of female respondents, and relatively higher levels of educational attainment and personal income.↩
Endnote 2: Numbers of preventive actions in Phases 2 and 3 were first transformed in the path analysis as they had negatively skewed distributions.↩
Endnote 3: All of these regression paths except for the one from action in Phase 2 to perceived harmfulness in Phase 3 were significant at the 0.05 or higher levels. The effect of Phase 2 action on Phase 3 perceived harmfulness was marginally significant (p = 0.052).↩
References
-
Bubeck, P., & Botzen, W. J. W. (2013). Response to “The Necessity for Longitudinal Studies in Risk Perception Research”. Risk Analysis, 33(5), 760-762. ↩
-
Loewenstein, G., & Mather, J. (1990). Dynamic processes in risk perception. Journal of Risk Uncertainty, 3(2), 155-175. ↩
-
Rogers, G. O. (1997). Dynamic risk perception in two communities: Risk events and changes in perceived risk. Journal of Environmental Planning and Management, 40(1), 59-80. ↩
-
Siegrist, M. (2013). The necessity for longitudinal studies in risk perception research. Risk Analysis, 33(1), 50-51. ↩
-
Downs, A. (1972). Up and down with ecology—the “issue-attention cycle”. The Public Interest, 28, 38-50. ↩
-
Kasperson, R. E., Renn, O., Slovic, P., Brown, H. S., Emel, J., Goble, R., Kasperson, J. X., & Ratick, S. (1988). The social amplification of risk: A conceptual framework. Risk Analysis, 8(2), 177-187. ↩
-
Champ, P. A., & Brenkert-Smith, H. (2016). Is seeing believing? Wildfire risk perceptions after a catastrophic fire. Risk Analysis, 36(4), 816-830 ↩
-
Fitchen, J. M., Heath, J. S., & Fessenden-Raden, J. (1987). Risk perception in community context: A case study. In B. B. Johnson & V. T. Covello (Eds.), The Social and Cultural Construction of Risk (pp. 31-54). D. Reidel. ↩
-
Milfont, T. L. (2012). The interplay between knowledge, perceived efficacy, and concern about global warming and climate change: A one-year longitudinal study. Risk Analysis, 32(6), 1003-1020. ↩
-
Nordfjærn, T., & Rundmo, T. (2010). Differences in risk perception, priorities, worry and demand for risk mitigation in transport among Norwegians in 2004 and 2008. Safety Science, 48(3), 357-364. ↩
-
Qin, H., Romero-Lankao, P., Hardoy, J., & Rosas-Huerta, A. (2015). Household responses to climate-related hazards in four Latin American cities: A conceptual framework and exploratory analysis. Urban Climate, 14(Part 1), 94-110. ↩
-
Su, Y., F. Zhao, & Tan, L. (2015). Whether a large disaster could change public concern and risk perception: a case study of the 7/21 extraordinary rainstorm disaster in Beijing in 2012. Natural Hazards, 78(1), 555-567. ↩
-
Bubeck, P., Botzen, W. J. W., & Aerts., J. C. J. H. (2012). A review of risk perceptions and other factors that influence flood mitigation behavior. Risk Analysis, 32(9), 1481-1495. ↩
-
Weinstein, N. D., Rothman, A. J., & Nicolich, M. (1998). Use of correlational data to examine the effects of risk perceptions on precautionary behavior. Psychology & Health, 13(3), 479-501. ↩
-
Brewer, N. T., Weinstein, N.D, Cuite, C.L., & Herrington, J.E. (2004). Risk perceptions and their relation to risk behavior. Annals of Behavioral Medicine, 27(2), 125-130. ↩
-
Ibuka, Y., Chapman, G., Meyers, L., Li, M., & Galvani, A. (2010). The dynamics of risk perceptions and precautionary behavior in response to 2009 (H1N1) pandemic influenza. BMC Infectious Diseases, 10(1), 296. ↩
-
Jones, J. H., & Salathé, M. (2009). Early assessment of anxiety and behavioral response to novel swine-origin influenza A(H1N1). PLoS ONE, 4(12), e8032. ↩
-
Sherlaw, W., & Raude, J. (2013). Why the French did not choose to panic: A dynamic analysis of the public response to the influenza pandemic. Sociology of Health and Illness, 35(2), 332-344. ↩
-
Weinstein, N. D., & Nicolich, M. (1993). Correct and incorrect interpretations of correlations between risk perceptions and risk behaviors. Health Psychology, 12(3), 235-245. ↩
-
Champ, P. A., Donovan, G. H., & Barth, C. M. (2016). Living in a tinderbox: Wildfire risk perceptions and mitigating behaviours. International Journal of Wildland Fire, 22(6), 832-840. ↩
Qin, H., Sanders, C., & Prasetyo, Y. (2021). Dynamic Risk Perception and Behavior in Response to COVID-19 (Natural Hazards Center Quick Response Research Report Series, Report 317). Natural Hazards Center, University of Colorado Boulder. https://hazards.colorado.edu/quick-response-report/dynamic-risk-perception-and-behavior-in-response-to-the-coronavirus-disease-2019-covid-19