Examining Public Response and Climate Conditions During Overlapping Tornado and Flash Flood Warnings
Publication Date: 2022
Executive Summary
Overview
Severe weather often involves multiple overlapping threats. Simultaneous tornados and flash floods—known as TORFF events—are one such example. The warning protocols for TORFF events are challenging for weather forecasters to issue and for members of the public to receive, because the recommended protective actions for the two hazards are contradictory—sheltering below ground during a tornado and moving to high ground during flash flooding events. Public response to these warnings, which occur approximately 400 times per year, has not yet been studied, and other critical questions related to TORFF climatology and public vulnerability remain.
Research Design
We conducted a survey (N = 247) among adults who were exposed to one of eight clusters of TORFF events that occurred in southeastern Arkansas, southern Tennessee, northern Mississippi, and northern Alabama on March 25 and 27, 2021. We also assessed the climatology of TORFFs in the same area, including their frequency, seasonality, and types of storms that cause them.
Research Questions
This study examined the following research questions:
How do members of the public perceive and respond to warnings during TORFF events?
What are the climatological TORFF characteristics for a given location, and how do these factors influence public perceptions, warning outcomes, and the TORFF information timeline received by the public?
Findings
Our results showed that during TORFF events, public perceptions of tornado threats led to prioritizing protective actions for tornados, but decreased protective actions for flash flood events. In terms of exposure and vulnerability for this region, we found the greatest difference between TORFF-affected census tracts and the rest of the United States was that TORFF-affected tracts had a higher mean percentage of homes that are mobile/manufactured. In terms of climatological risk in the Southeast region we sampled, we found that TORFF warnings happened in all seasons but were most common in the spring followed by the winter. They were slightly more common during the day, though more common at night in the winter and fall due to shortened day length hours. For timeline of threats, flash flood warnings usually preceded tornado warnings and were more likely to be verified than tornados.
Practical Implications
Traditionally, disaster planning and communication has focused on specific, singular events. Our findings highlight that TORFF events create complex weather scenarios with conflicting safety protocols that create uncertainty and constraints on protective decisions, particularly among socially vulnerable populations living in mobile/manufactured homes. For the public living in high-TORFF risk areas, information on the frequency of TORFF events, along with guidance on how to take protective action during TORFF events is needed, particularly for socially vulnerable populations living in mobile/manufactured homes.
Introduction
On average, tornado and flooding hazards have killed 156 people per year since 1990, making them the second (flooding) and third (tornado) deadliest types of weather events behind heat (NWS, 20201). Approximately 400 times per year within the United States, the National Weather Service (NWS) forecasters issue simultaneous tornado and flood warnings in a given area—events known as potential TORFFs. To be classified as a potential TORFF, warnings must overlap in space and be issued within 30 minutes of one another (Nielson et al., 20152). Those that are then verified via local storm reports are considered verified TORFFs. These dual warnings occur most frequently in south-central Missouri and the lower Mississippi River valley (Nielson et al., 2015). Figure 1 is a map from the Precipitation Systems Research Group (n.d.3) which shows the location of potential TORFF warnings issued between January 1 and December 16, 2021.
Figure 1. Tornado and Flash Flood Events in the United States Between January 1 and December 16, 2021
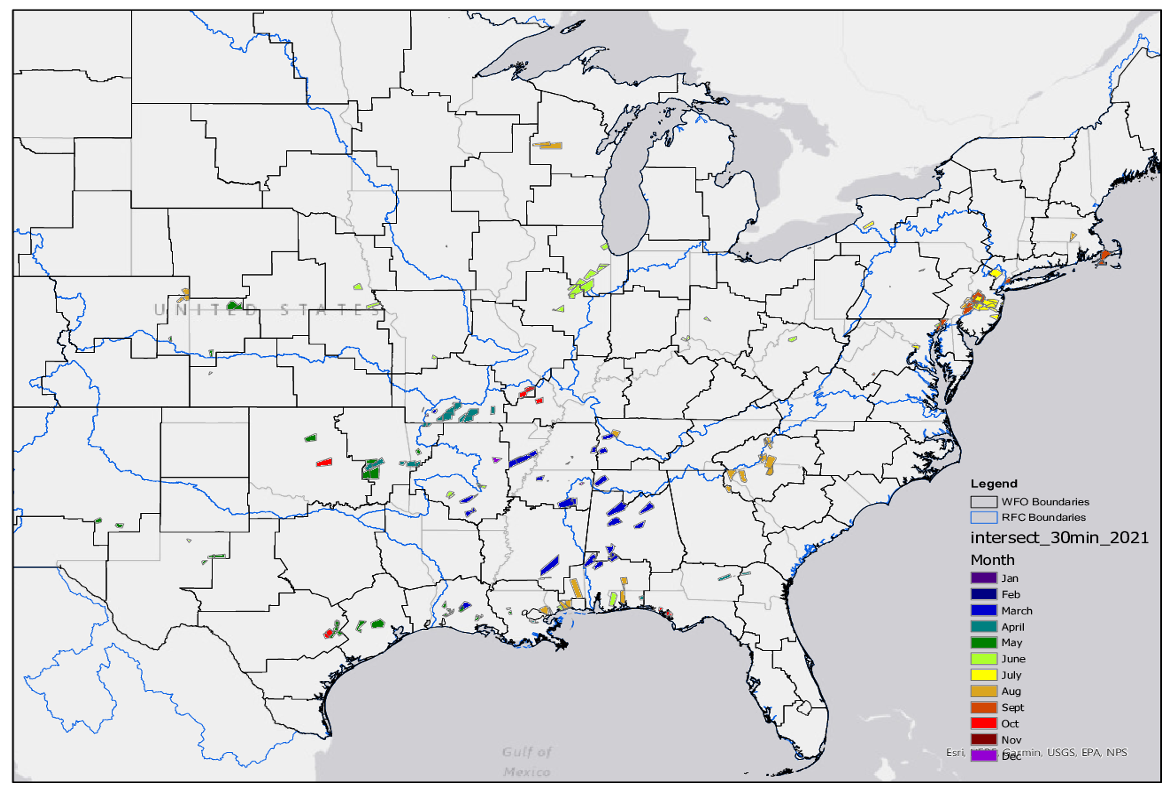
TORFFs can be caused by a variety of storm modes––e.g., cellular, linear, and tropical (Nielson et al., 2015). The climatology of TORFF storm modes, including their frequency and seasonality, and the degree to which these affect other characteristics of the event, including the timing of each warning and the likelihood of the TORFF being verified, are unknown.
Literature Review
TORFF events are challenging for weather forecasters issuing warning protocols and for members of the public receiving those warning protocols, because the recommended protective actions for the two hazards are contradictory––sheltering below ground during a tornado and moving to high ground during flash flooding events (Burow et al., 20214; Nielson et al., 2015; Henderson et al., 20205). TORFF events, therefore, can create confusion for the public about the level of danger for each threat and what protective action they are recommended to take. For example, in May 2013 a lethal tornado developed west of Oklahoma City, killing eight people. In addition, the storm caused extensive flooding and 12 people were killed from flash flooding when they took shelter from the tornado in a drainage ditch (NWS, 20146). The NWS found that people were warned about the tornado, but many members of the public indicated they were not aware of a flash flood warning despite warnings being issued (NWS, 2014). This event and other similar events (e.g., concurrent tornados and floods from Hurricane Harvey, NWS, 20187) highlight the life-threatening situations that TORFFs can produce.
Furthermore, many people do not have access to the resources (i.e., basement, storm shelter, vehicle, higher ground, etc.) necessary to respond safely to one or both hazards (Ash et al., 20208; Gruntfest & Handmer, 20019; Schmidlin et al., 200110; Špitalar et al., 201411; Strader et al., 201912). For instance, someone without access to a basement may drive to a storm shelter, thereby increasing their exposure to risks from flash flooding. Thus, a major risk factor in TORFF events is social vulnerability, a term used to explain how various social conditions (e.g., race, class, age, and gender) generate unequal access among social groups to the resources and capacities people need to prepare for, cope with, and recover from disasters (Ashley & Ashley, 200813; First et al., 202114; Morss et al., 201015; Paul, 201116; Strader & Ashley, 201817; Tierney, 201418; Wisner et al., 200419). During a TORFF event, socially vulnerable populations are also less likely to receive clear warning information that addresses their needs and access barriers.
During warnings, the protective decisions people make are based upon a variety of factors, including: (1) their knowledge and understanding of their local risk and exposure, (2) how they receive hazard information and warnings, (3) their perceptions of threat and forecast uncertainty, and (4) their available resources (Ash et al., 2020; Lindell & Perry, 201220; Morss & Hayden, 201021; Ripberger et al., 201522; Trumbo et al., 201623; Walters et al., 202024). While recent studies have examined TORFF events in relation to the timing of their formation and the operational challenges they create for NWS forecasters (Nielson et al., 2015; Henderson et al., 2020), research has yet to examine how members of the public understand their risk and interpret and respond to TORFF warnings.
Methods
The current study aimed to close that gap by combining empirical evidence of public experiences and climatological risk factors during TORFF events. We gathered information on resident risk perception and protective actions by surveying a sample of the public who experienced a potential TORFF event that occurred across the Southeast United States in March 2021 (n = 247) and assessed the climatology of TORFFs in the same area, including their frequency, seasonality, and types of storms that caused them.
Research Questions
Specifically, our research questions included:
- Research Question 1: How do members of the public perceive and respond to warnings during TORFF events?
- Research Question 2: What are the climatological TORFF characteristics for a given location, and how do these factors influence public perceptions, warning outcomes, and the TORFF information timeline received by the public?
Study Site Description
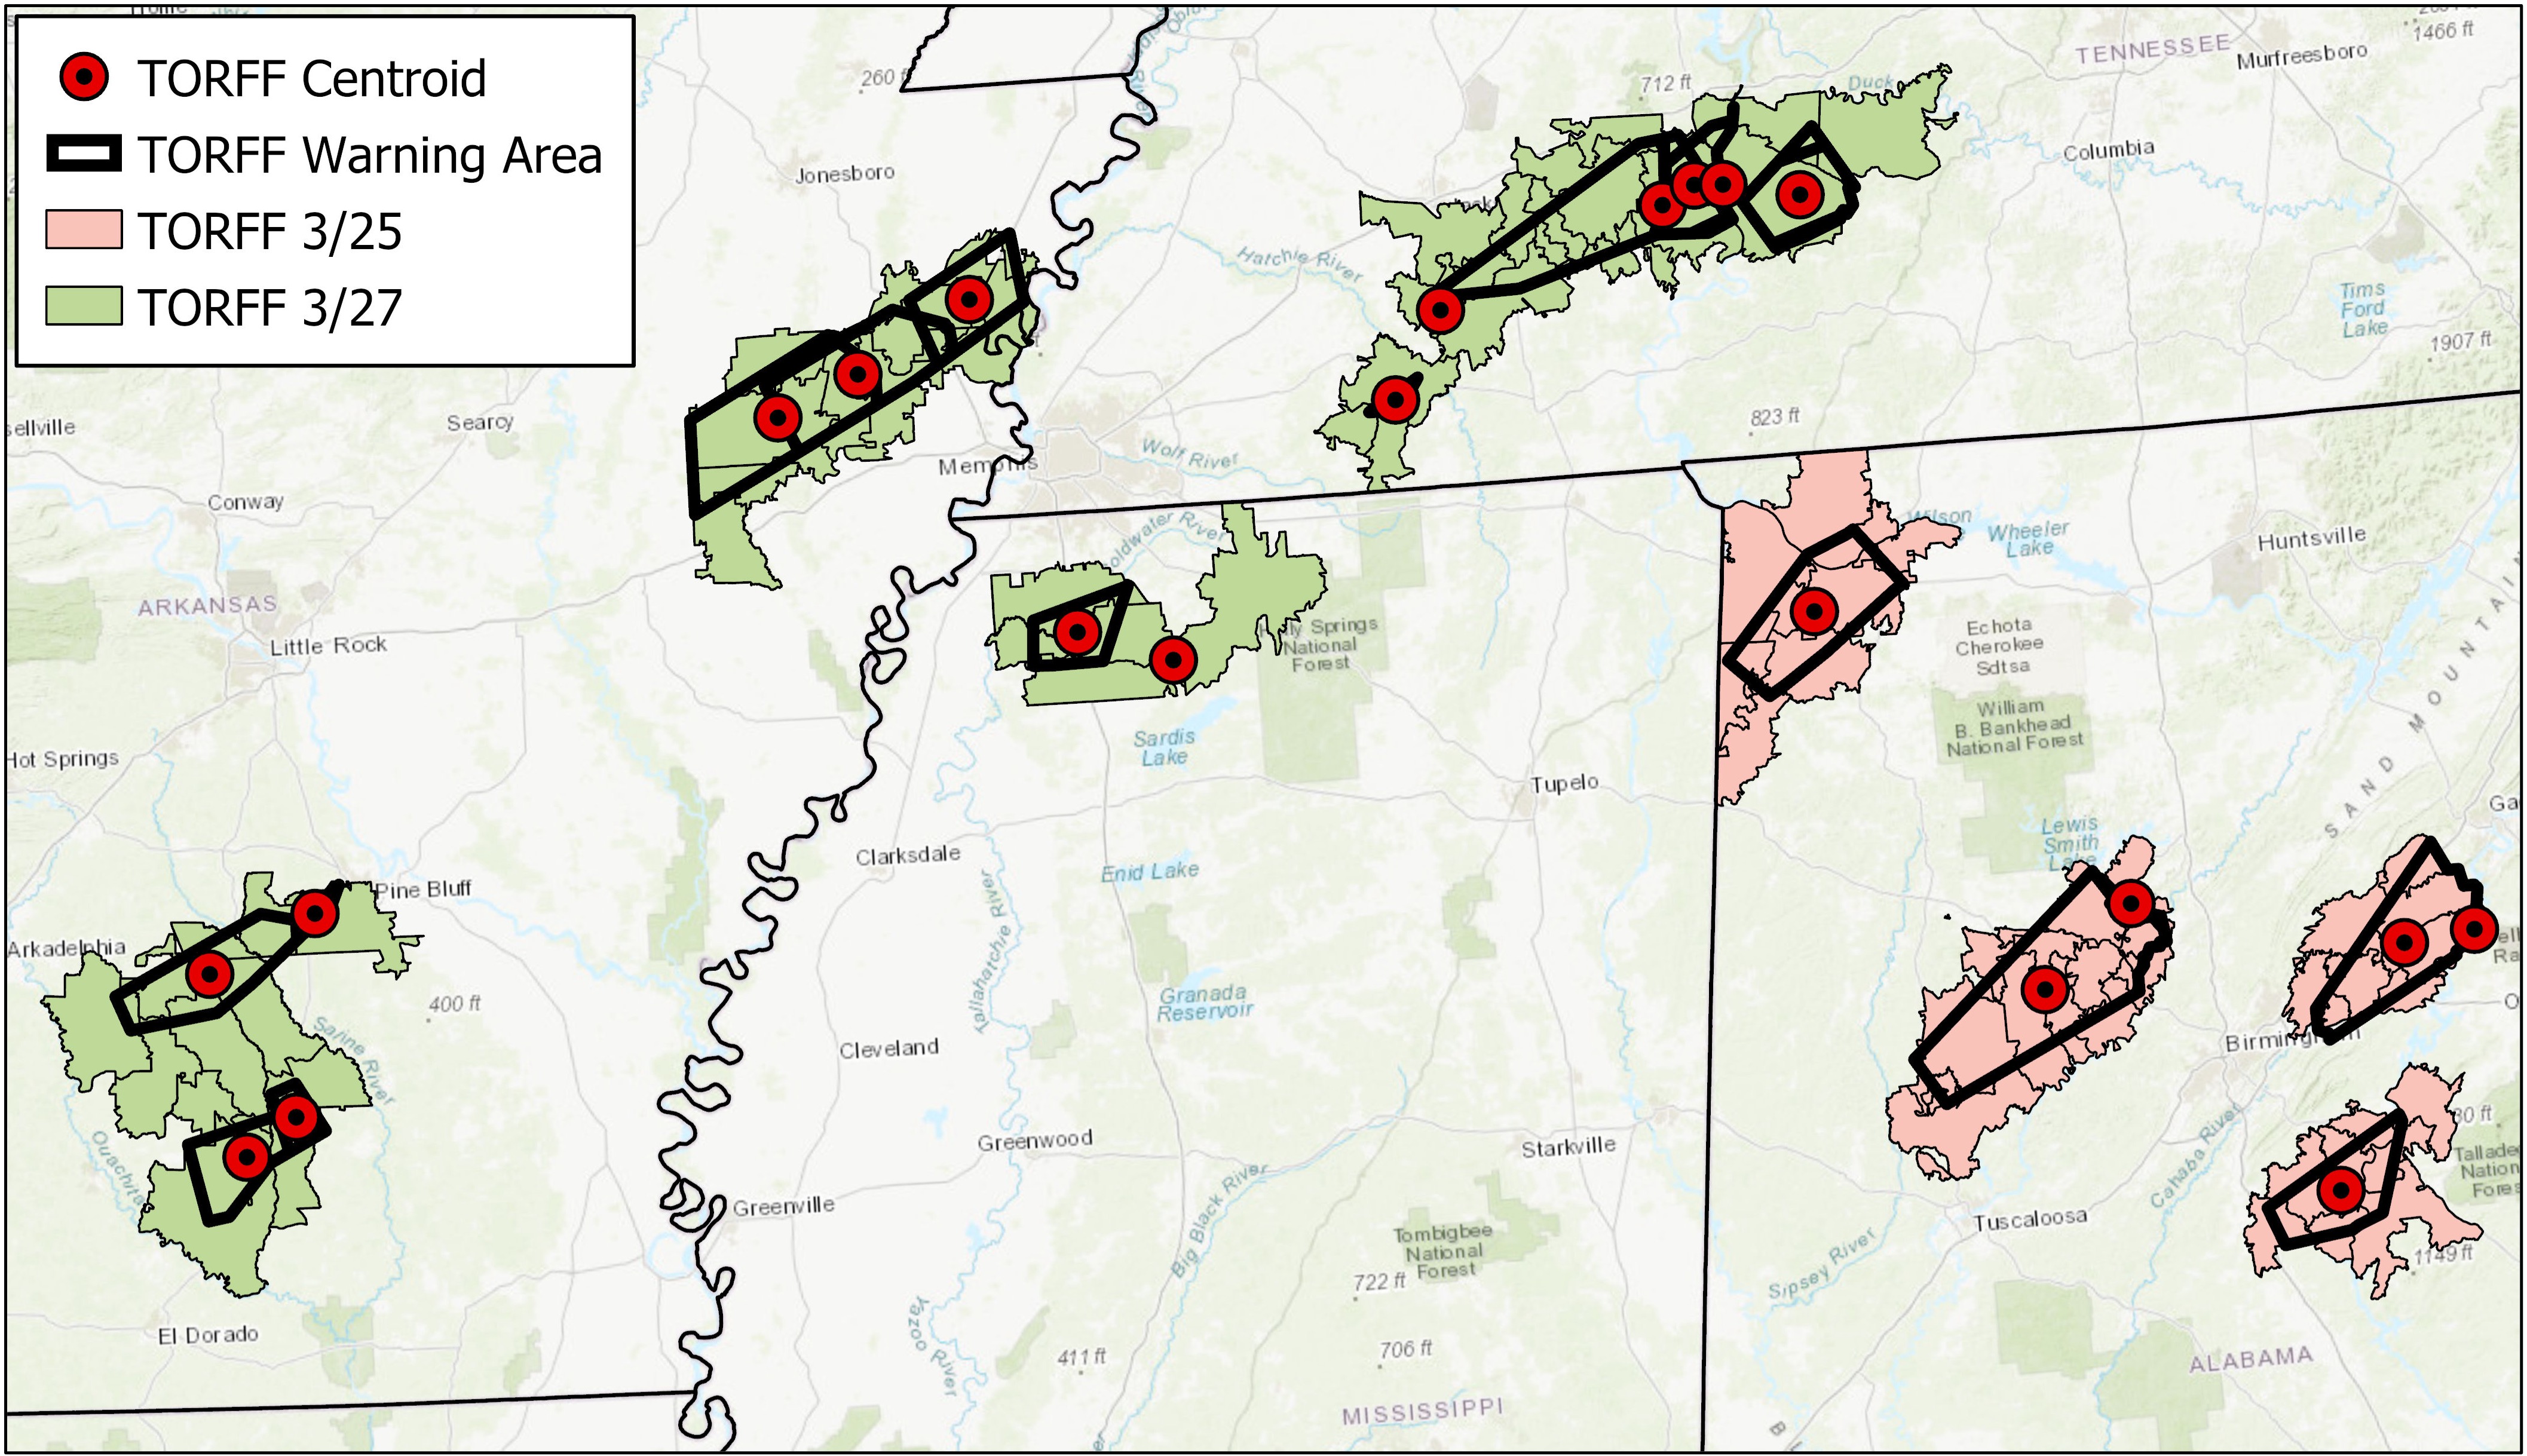
The Mid-South is the most tornado disaster-prone region of the United States (Ashley, 200725; Dixon et al., 201126; Ashley & Strader, 201627). Tornado mortality in this region, however, is driven by the combination of elevated climatological risk with higher social vulnerability levels and behavioral factors (e.g., Ashley et al., 2008; Ashley & Strader, 2016; Strader & Ashley, 2018). This area is also subject to increased flash flooding risk (Ashley & Ashley, 2008), especially during simultaneous tornadic events (i.e., TORFFs; Burrow et al., 2021). In our study, we focused on two dates (25 and 27 March 2021) where TORFF events occurred. As shown in Figure 2, eight clusters of TORFF events occurred in southeastern Arkansas, southern Tennessee, northern Mississippi, and northern Alabama on those dates.
Figure 2. Tornado and Flash Flood Events on March 25 and 27 in the Southeast United States
These TORFF events occurred in the Mid-South in areas where the population has a variety of socioeconomic and demographic vulnerabilities which affect their ability to take protective actions and increase their risk of mortality. The Center for Disease Control (CDC) Social Vulnerability Index (SVI) uses 15 population measures (e.g., income, employment, age, race, language, mobile homes) to map hazard vulnerability at the Census tract-level. More specifically, the index maps four distinct categories of vulnerability: socioeconomic status, household composition and disability, minority status and language, and housing type and transportation.
As shown in Table 1, we used the CDC SVI (201828) to compare the levels of social vulnerability in our study site to the rest of the conterminous United States. As the table reflects, the Census tracts affected by the March 2021 TORFF events had higher average percentages of individuals in poverty (17.1%), unemployed (6.9%), and with no high school diploma (17.1%). This suggests that people affected by the TORFF events were more socioeconomically vulnerable. Focusing on the CDC SVI vulnerability Theme 2 (Household composition), persons in the TORFF-affected tracts were also more likely to be aged 65 years or older (18.1%) and have a disability (19.5%). However, the percentages of households with minor populations (less than 17 years old) and single parents were less than the conterminous United States. Only 19.3% of all persons impacted by the TORFF events were considered racial/ethnic minorities and 0.6% spoke English “less than well.” The greatest difference between TORFF-affected tracts and the rest of the United States was found in the mean percentage of homes that are mobile/manufactured (23% vs. 6% for the conterminous United States).
Table 1. Comparison of Social Vulnerability in the Study Site and Coterminous United States
| Variable | Study Site Mean | Coterminous United States Mean | |
| Socioeconomic Theme 1 | % Below Poverty | 17.1 | 15.2 |
| % Unemployed | 6.9 | 6.5 | |
| Income (per capita) | $ 24,323 | $ 32,279 | |
| % No High School Diploma | 17.1 | 17.1 | |
| Household Composition Theme 2 | % Aged 65 or Older | 18.1 | 16.0 |
| % Aged 17 or Younger | 22.0 | 22.1 | |
| % Civilian with a Disability | 19.5 | 13.3 | |
| % Single-Parent Households | 7.8 | 9.2 | Minority Status and Language Theme 3 | % Minority | 19.3 | 38.3 |
| % Speaks English "Less than Well" | 0.55 | 4.2 | |
| Housing Type and Transportation Theme 4 | % Multi-Unit Structures | 1.6 | 12.4 |
| % Mobile Homes | 23.0 | 6.0 | |
| % Crowding | 1.7 | 3.6 | |
| % No Vehicle | 5.8 | 9.4 | |
| % Group Quarters | 1.9 | 2.4 |
Data Collection Methods
Survey
To answer RQ1, we designed an internet survey of adults in the Southeast who were exposed to TORFF events on either March 25 or March 27, 2021. Data collection procedures with human subjects were approved by the University of Tennessee Institutional Review Board. The study sample included 247 adults (18 years or older) residing in zip codes which were affected by the TORFF events on March 25 and 27, 2021 in the Southeast United States. Participants were recruited via a Qualtrics Panel aggregator system which recruits participation from a pool of United States adults who have volunteered to be in online research via the company. Data were collected April 15-20, 2021.
As previously stated, protective decisions are often based upon a variety of factors such as receiving hazard information and warning, perceptions of threat and forecast uncertainty, and their available resources and capacities to take protective action (Ash et al., 2020; Lindell & Perry, 2012; Morss & Hayden, 2010; Ripberger et al., 2015; Trumbo et al., 2016). Therefore, we proposed the following hypotheses:
- Hypothesis 1: Access to more hazard-related information sources will be associated with (a) increased tornado threat perceptions and (b) increased flash flood threat perceptions.
- Hypothesis 2: Having increased tornado threat perceptions will be associated with (a) more tornado protective actions, and (b) less flash flood protective actions.
- Hypothesis 3: Having increased flash flood threat perceptions will be associated with (a) more flash flood protective actions, and (b) less tornado protective actions.
To test these hypotheses, we developed the following survey measures:
Hazard information sources. Hazard information sources was measured by asking participants the following question: “Which of the following were sources of information you used during the recent severe weather events in your area? (1) Television (e.g., TV news, emergency broadcast system announcements), (2) AM/FM commercial radio (e.g., weather forecasting radio sites), (3) news media websites, (4) Wireless Emergency Alerts (smart phone alerts), (5) landline phone (e.g., reverse 911), (6) outdoor warning sirens, (7) National Oceanic and Atmospheric Administration (NOAA) weather radio, and (8) family, friends, neighbors.” Response options were not at all (0), a little (1), somewhat (2), or a great deal (3). The scores of all items were summed to reflect indexes of hazard information sources. The scores ranged from 2 to 21, with a higher score indicating access to more hazard information sources.
Tornado threat perceptions. Tornado threat perceptions were measured with six items assessing the degree to which the respondent perceives tornado hazard situations as a threat. These items included: “I think that tornados are likely to happen in my area,” “I think that a tornado can cause major damage to my home,” “I think that a tornado can cause injury to me or other family members,” “I think that tornados are unpredictable,” “I think that tornados can pose great financial threat,” and “Thinking about the possibility of a tornado makes me feel fearful or worried.” Each item is scored on a 5-point Likert scale from 1 (strongly disagree) to 5 (strongly agree). Items were summed to create a measured variable.
Flash flood threat perceptions. Flash flood threat perceptions were measured with six items assessing the degree to which the respondent perceives flash flood hazard situations as a threat. These questions included: “I think that flash floods are likely to happen in my area,” “I think that flash floods can cause major damage to my home,” “I think that flash floods can cause injury to me or other family members,” “I think that flash floods are unpredictable,” “I think that flash floods can pose great financial threat,” and “Thinking about the possibility of a flash floods makes me feel fearful or worried.” Each item is scored on a 5-point Likert scale from 1 (strongly disagree) to 5 (strongly agree). Items were summed to create a measured variable.
Tornado protective actions. Tornado protective actions were measured by the following: “On March 25th or 27th, 2021, tornado and flash flood warnings were issued in your area at overlapping times. Below are statements about that experience. Please indicate the degree to which each statement was true for you. (1) I searched for more information of forecasted timing and severity of the tornado threats (e.g., look to TV, social media, online, apps). (2) I searched for more information of forecasted timing and severity of tornado threats (e.g., look to TV, social media, online, apps). (3) I took action to protect myself or my loved ones against the threat of tornados that day (e.g., sought shelter below ground or in an interior room).” Each item is scored on a 5-point Likert scale from 1 (strongly disagree) to 5 (strongly agree). Items were summed to create a measured variable.
Flash flood protective actions. Flash flood protective actions were measured by the following: “On March 25th or 27th, 2021, tornado and flash flood warnings were issued in your area at overlapping times. Below are statements about that experience. Please indicate the degree to which each statement was true for you. (1) I paid attention to the weather forecasts and warnings because I knew about the threat of flash floods that day. (2) I searched for more information of forecasted timing and severity of flash flood threats (e.g., look to TV, social media, online, apps). (3) I took action to protect myself or my loved ones against the threat of flash flooding that day (e.g., went to higher ground, avoided risky areas).” Each item is scored on a 5-point Likert scale from 1 (strongly disagree) to 5 (strongly agree). Items were summed to create a measured variable.
Demographic information. Gender, race, age, income, education, housing structure, and severe weather exposure were also assessed.
Additional measures. The survey also included open-ended, qualitative questions on experiences during TORFF events and additional variables designed to assess hazard protective factors, barriers, and trust in warning communication sources for use in future analyses.
Data Analysis
Survey Analysis
Survey data were analyzed using R statistical software and packages (R Development Core Team, 2011). Demographic characteristics of respondents were analyzed using univariate methods including means, standard deviations, frequencies, and percentages as appropriate. To examine public protective decision-making during TORFF events we used structural equation modeling (SEM) to conduct a path analysis of measured variables using a robust maximum likelihood estimation to ensure multivariate normality. Path analysis allows for the examination of a set of relationships between multiple independent and dependent variables, either continuous or discrete (Kline, 201529; Ullman, 1996). We modeled direct and indirect relationships between the different factors that are hypothesized to influence people’s protective actions during dual hazards (e.g., information seeking and sources, risk perception).
Archival Data Analysis
To answer RQ2, climatological risk of TORFF events was assessed for the NWS County Warning Areas (CWAs) in the region of the March 25 and 27, 2021 events: Birmingham, Alabama; Huntsville, Alabama; Jackson, Mississippi; Little Rock, Arkansas; Memphis, Tennessee; and Nashville, Tennessee. To assess the local TORFF climatology we used warning data from the Iowa Environmental Mesonet (IEM Cow n.d.30). Within each CWA, we gathered concurrent and overlapping flash flood and tornado warnings from 2008–2020, resulting in 1,468 samples. We categorized the seasonality of each event as well as the daily timing. For the daily timing, we assigned a binary code of daytime/nocturnal by determining whether the TOFF warning occurred during daylight or nighttime based on the average sunrise and sunset time for the given CWA and month. For seasonality, we separated the TORFFs based on their month of occurrence: December, January and February in winter; March, April, and May in spring, June, July, and August in summer; and September, October, and November in fall.
We then used a 20% subsample of potential TORFFs for the given CWAs for the remaining analysis (n = 294). This included using archived radar data to determine what type of storm mode was responsible for the TORFF, providing a unique climatology of TORFF storm modes, warning verification rates, and typical TORFF-event warning timing. First, the list of potential TORFFs was cross-listed with a list of tropical cyclones to determine which events should be listed as a tropical storm type. The remaining events were classified using archived NEXRAD Level II base reflectivity data from the National Centers for Environmental Information (NCEI) Amazon Web Services using Gibson Ridge radar viewer (GR2Analyst). For each potential TORFF, the radar data were downloaded at the time the event was initiated, meaning the closest scan to when the second warning was added to overlap the first. Two students separately classified the events as one of three storm types based on their radar characteristics: discrete cellular; multicell, which includes cells in lines and clusters; and quasi-linear convective system (QLCS). An event was considered a discrete cell if no part of its reflectivity was connected via reflectivity greater than 35 dbz to a storm with a separate updraft. If the storm did not satisfy this criterion, it was called multicell or QLCS. An event was considered a QLCS if it was associated with a line of convection with base reflectivity greater than 35 dbz for 100 km or more and storm motion was perpendicular to the line. The two separate classification sets were compared, and when there were disagreements, the classification was finalized as a group of two students and two faculty members. The classification data were used to assess the climatology of potential TORFF storm modes, using Kruskal-Wallis tests to assess significant differences between seasons, locations, etc. Warning verifications were determined using Local Storm Reports from IEM Cow. The flash flood and tornado warnings for each potential TORFF were looked up in IEM Cow and it was noted whether the flash flood, tornado, or both were verified by local storm reports. These data allowed us to draw connections between storm mode and verification rates of potential TORFFs.
Results
Survey Results
Demographic and descriptive information. The majority of participants were female (55.5%) and White (78.9%) followed by participants identifying as Black (16.6%), Hispanic (2.8%), and Asian American (1.2%). Nearly one-third (29.9%) of participants made less than $29,000 per year and 14.6% resided in a mobile/manufactured home. More than one-third (35.6%) of participants indicated their property was damaged by the severe weather events, 79.6% of participants indicated that at the time of the severe weather events they believed they or someone they knew could be killed or harmed and 87.6% of participants viewed damaged areas in their community. See Table 2 for demographic and descriptive information.
Table 2. Survey Descriptive Statistics
| N | % | ||
| Gender | Male | 107 | 43.3 |
| Female | 137 | 55.5 | |
| Race | Black/African American/Afro-Caribbean | 41 | 16.6 |
| Asian American | 3 | 1.2 | |
| Hispanic/Latino | 7 | 2.8 | |
| White | 195 | 178.9 | |
| Native Hawaiian or other Pacific Islander | 1 | 0.4 | |
| Age | 18 - 25 | 40 | 16.2 |
| 26 - 35 | 41 | 16.6 | |
| 36 - 45 | 57 | 23.1 | |
| 46 - 55 | 37 | 15.0 | |
| 56 - 65 | 30 | 12.1 | |
| 66 - 74 | 33 | 13.4 | |
| 75 and older | 9 | 3.6 | |
| Income | Less than $15,000 | 27 | 10.9 |
| $15,000 to $29,999 | 47 | 19.0 | |
| $30,000 to $44,999 | 29 | 11.7 | |
| $45,000 to $59,999 | 35 | 14.2 | |
| $60,000 to $74,999 | 34 | 13.8 | |
| $75,000 to $104,999 | 29 | 11.7 | |
| $105,000 or more | 46 | 18.6 | |
| Education | Grade School | 1 | 0.4 |
| Some High School | 10 | 4.0 | |
| High School Graduate | 62 | 25.1 | |
| Some College | 61 | 24.7 | |
| College Graduate | 66 | 26.7 | |
| Advanced Degree | 47 | 19.0 | |
| Housing Structure | Mobile Home | 36 | 14.6 |
| One-family house detached from other buildings | 149 | 60.3 | |
| One-family house attached to other buildings | 25 | 10.1 | |
| A building with apartments | 33 | 13.4 | |
| A boat, RV, van, etc. | 4 | 1.6 | |
| Severe Weather Exposure | Had property damage | 88 | 35.6 |
| Had Injuries | 67 | 27.1 | |
| Knew people who had damage to their property | 158 | 63.9 | |
| At the time of the event, believed they or someone they knew could be killed or harmed | 197 | 79.7 | |
| Viewed scenes of the aftermath (damaged areas, debris) | 220 | 87.6 |
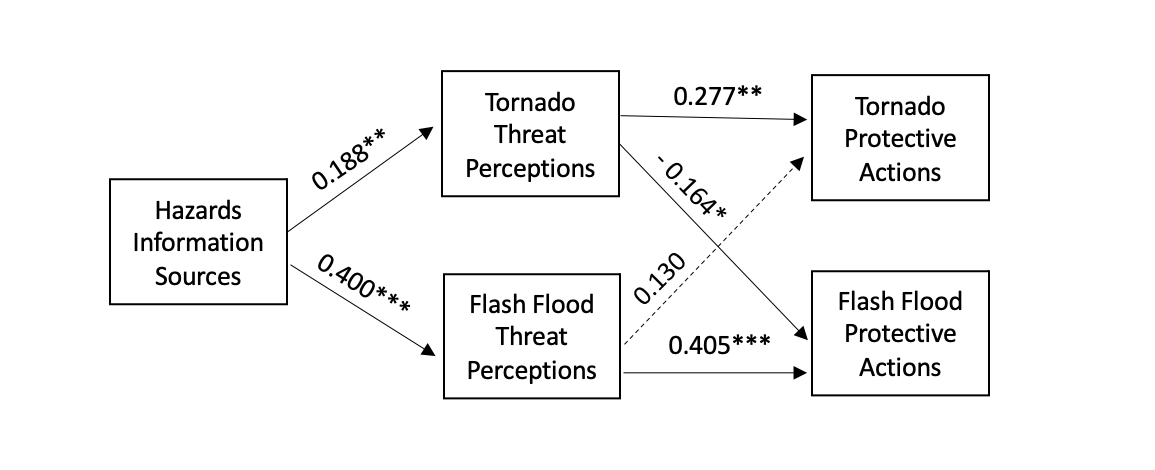
Path analysis results showed that people with access to more hazard-related information sources had increased tornado threat perceptions (β = 0.188, p<.01) and flash flood threat perceptions (β = 0.400, p<.001). In addition, results showed that having increased tornado threat perceptions was associated with tornado protective actions (β = 0.277, p<.01). Likewise, results found that having increased flash flood threat perceptions was associated with flash flood protective actions (β = 0.405, p<.001). However, when examining how respondents perceived dual threats simultaneously, results showed that tornado threat perceptions decreased flash flood protective actions (β = - 0.164, p<.05), but flash flood threat perceptions had no significant effect on tornado protective actions (p = >.05). See Table 3 and Figure 3 for regression paths for surveyed responses.
Table 3. Regression Estimates Between Hazard Information Sources, Perceived Risk, and Protective Behaviors
| Regression Paths | Unstandardized Estimate | Standard Error | Standard Estimate |
| Tornado Perceived Risk (R2= 0.08) | |||
| Hazard Info Sources | 0.087 | 0.026 | 0.188** |
| Flash Flood Perceived Risk (R2= 0.17) | |||
| Hazard Info Sources | 0.197 | 0.027 | 0.400*** |
| Tornado Protective Behaviors (R2= 0.19) | |||
| Tornado Perceived Risk | 0.334 | 0.099 | 0.277** |
| Flash Flood Perceived Risk | 0.147 | 0.096 | 0.130 |
| Gender | 0.515 | 0.265 | 0.123* |
| Income | 0.155 | 0.066 | 0.141* |
| Race | 0.335 | 0.389 | 0.059 |
| Having Dependents | -0.175 | 0.268 | -0.034 |
| Tornado Protective Behaviors (R2= 0.14) | |||
| Tornado Perceived Risk | -0.276 | 0.138 | -0.164* |
| Flash Flood Perceived Risk | 0.534 | 0.114 | 0.405*** |
| Gender | -0.007 | 0.369 | -0.001 |
| Income | 0.118 | 0.094 | 0.077 |
| Race | 0.470 | 0.482 | 0.060 |
| Having Dependents | -0.242 | 0.438 | -0.034 |
Figure 3. Diagram of Tornado and Flash Flood Protective Decision-Making
Archival Results
During the study period, potential TORFFs were most prevalent in Memphis and Jackson, and least prevalent in Birmingham and Nashville. They were most likely in the spring and during the day, though nighttime winter TORFF warnings were not infrequent. According to our Kruskal-Wallis tests, CWA caused significant differences in the seasonality (H=248.8, p<0.01) and daily timing (H=91.8, p<0.01) of TORFF warnings. The largest differences between observed and expected values for daily timing were that more TORFF warnings happened at night in Jackson and Memphis than expected, and during the day and in Huntsville than expected. Seasonally, the largest differences were that more TORFF warnings happened more often than expected in the spring in Huntsville and Little Rock, the cool season in Jackson in lieu of the spring, and more often than expected in seasons other than fall in Memphis. The median duration of the warning overlaps was 31 minutes. Median duration varied significantly based on CWA (H=70.1, p<0.01), with Nashville having the shortest median TORFF warning time (23.5 minutes) and Memphis having the longest (36 minutes). Duration did not vary based on time of day, but did vary based on season (H=11.6, p=0.01).
According to our random sample from the study area, the most frequent TORFF-warning producers were multicell events (n = 138), followed by QLCS (n = 92), discrete cells (n = 38), and tropical cyclones (n = 22). The storm modes caused TORFF warnings in different seasonal distributions (H=154.5, p<0.01), with more QLCS TORFF warnings in the winter, discrete and multicell in the spring, and tropical cyclone in the fall and summer than expected. There were also significant differences in the diurnal timing (H=7.6, p=0.05) of the TORFF warnings based on storm mode, with more QLCS TORFF warnings than expected at night, and all other modes during the day.
Of the sample TORFF warnings, for nearly two thirds, the flash flood warning preceded the tornado warning. Warning verification rates by mode are shown in Table 4. Flash floods were more likely to be verified than tornados, though discrete cells were less likely to have caused confirmed flooding. Tropical cyclones had the biggest difference between the likelihood of tornado verification and flood verification.
Table 4. Verified Tornado and Flash Floods From the Warning Sample
| Tornado | Flash Flood | |
| Total | 27% | 45% |
| Discrete Cell | 29% | 38% |
| Multicell | 30% | 56% |
| QLCS | 23% | 48% |
| Tropical | 18% | 59% |
Discussion
While research has recently begun to examine TORFF events in conjunction to when they occur and the operational challenges faced by NWS forecasters (Nielson et al., 2015; Henderson et al., 2020), research has yet to examine how members of the public respond to TORFF events. Our results highlight that TORFF events create complex weather scenarios that can impact protective decisions, particularly among socially vulnerable populations.
First, our findings demonstrate that upon receiving warnings issued for hazardous weather, people often responded by taking a series of protective actions based on their perceptions of the hazard’s threat (Ash et al., 2020; Lindell & Perry, 2012; Morss & Hayden, 2010; Ripberger et al., 2015; Trumbo et al., 2016; Walters et al., 2020). However, our results also suggested that TORFF events create uncertainty and may lead to potentially dangerous protective decision-making by public because the recommended protective actions for the two hazards were conflicting–seeking higher ground and not driving during a flash flood, versus sheltering below ground or evacuating (i.e., mobile homes) during a tornado.. More specifically, our results showed that during TORFF events, public perceptions of tornado threats led them to prioritize protective actions for tornados, but decreased their protective actions for flash flood events.
In terms of exposure and vulnerability for this region, we found the greatest difference between TORFF-affected tracts and the rest of the United States was for the mean percentage of homes that are mobile/manufactured. This result is unsurprising considering the Southeast United States contains the greatest density of mobile/manufactured homes compared to any other region in the country (Ashley, 2007). Prior research has illustrated that the elevated mobile/manufactured housing density leads to greater odds of tornado fatalities (Schmidlin et al., 2001; Ashley, 2007; Ashley et al., 2008; Sutter & Simmons, 2010; Emrich & Cutter, 201131; Flanagan et al., 201132; Simmons & Sutter, 2011; Strader & Ashley, 2018; Strader et al., 2019). However, when tornado threats arise, NOAA, NWS, and the Federal Emergency Management Agency recommend that residents flee their home for more sturdy shelter (Strader et al., 2019). This presents an issue given most residents will evacuate their home in a vehicle, placing themselves at greater risk for flash flooding. Complicating the issue even further, the Southeast is home to the greatest frequency of nocturnal tornado events (Ashley et al., 2008; Krocak et al., 2018; Bunker et al., 2019; Ellis et al., 2020), which makes driving during heavy rains whilst being in a tornado warning area at nighttime challenging.
Second, for the NWS CWAs in the region of the March 25 and 27, 2021 TORFF events, we found that they experience differences in the seasonality of their TORFF events, with some of this being a result of the storm modes causing TORFFs in those areas. Thus, operational trainings to improve TORFF warning communication and success should be focused at the CWA level, not the region as a whole. Because flash flood warnings were typically issued first and were more likely to be verified, preceding tornado warnings should remind those being warned that flash flooding is still a dangerous concern. This is especially important to address with NWS forecasters because, according a Henderson et al. (2020) case study, forecasters noted tornados tended to occur first, followed by flash floods. While we did not look at the timing of verifications, our work demonstrates the importance of understanding that the warning timing and likelihood of verification complicate this notion held by forecasters.
Implications for the Weather Community
Assessing how the public interpret TORFF events and act upon them within various contexts of uncertainty and vulnerability is essential for reducing TORFF-related deaths and injuries, and for developing mitigation and resilience-building strategies. In terms of practical implications, more public education and awareness on TORFF hazards is needed, especially within high TORFF risk areas in the Southeast. Information on the frequency of TORFF events, along with guidance on how the public might assess their potential for compounding risk given their location (e.g., located near a flood plain) and shelter vulnerabilities (e.g., residing in a mobile home), could help increase public awareness for both threats. Given that our results found the public attended to flashflood threats less than tornado threats, NWS Weather Forecast Offices (WFOs) should ensure they are not amplifying tornado threats more than flash flood threats when communicating about both hazards during TORFF events. WFO messages should avoid giving conflicting safety protocols and instead focus on messages that combine tornado and flashflood protective actions such as “Get to a storm shelter that is safe from flooding. Do not shelter in roadside or drainage ditches. Do not drive through flooded waters.”
In addition, during a TORFF event socially vulnerable populations may not receive clear warning information that addresses the recipients’ needs and potential sheltering challenges. WFOs should amplify protective actions that mobile home residents can take during TORFF events. WFOs can motivate mobile home residents to create shelter plans that include safety planning for when both extreme winds and flash flooding occur. For example, WFOs can recommend mobile home residents prepare shelter evacuation plans in advance that are routed to avoid flood-prone areas. Likewise, during TORFF warning situations, forecasters should communicate both tornado and flash flood threats equally and provide specific guidance on what mobile home residents should do. For example, forecasters can communicate, “If you live in a mobile home you need to evacuate to a sturdy shelter. If you are driving to shelter, know what roads are safe from flooding and do not attempt to drive through flooded roads. Roadside ditches are not safe to shelter in during heavy rainfall.”
Limitations and Future Research Directions
As with all research, this study had multiple limitations. First, while we were able to compare our SVI variables to our survey results our sample size and geographic scope limited the ability to provide direct statistical comparisons between the survey and SVI variables. Future work should examine statistical relationships between SVI variables and public protective-decision-making during TORFF Events. Second, this study utilized an online questionnaire which required survey participants to have internet access, which may have limited sampling among those with lower incomes, less education, older adults, and those living in rural areas. Third, this study was cross-sectional in design and therefore the survey data collected precludes causal claims of temporal order. However, the present study presents a model that is grounded in the theoretical literature and was supported by previous research investigations (Ash et al., 2020; Lindell & Perry, 2012; Morss & Hayden, 2010; Ripberger et al., 2015; Trumbo et al., 2016; Walters et al., 2020), all of which provide a compelling case for investigating the direct and indirect relationships we conducted. Future research could improve on this limitation and employ a longitudinal design that collects data at multiple points of time. Fourth, while we assessed protective decision-making among the public during TORFF events and provide recommendations for the weather community, future research is needed to test how to effectively communicate risk and uncertainties related to TORFF events in locally relevant ways. Finally, future studies should employ qualitative methods for providing further context into the protective decision-making process during dual hazards.
Related Publication
First, J.M., Ellis, K., Strader, S. (2022). Double trouble: Examining public protective decision-making during concurrent tornado and flash flood threats in the U.S. Southeast. International Journal of Disaster Risk Reduction (81). https://doi.org/10.1016/j.ijdrr.2022.103297.
References
-
National Weather Service. (2020). Weather related fatality and injury statistics. https://www.weather.gov/hazstat/ ↩
-
Nielsen, E. R., Herman, G. R., Tournay, R. C., Peters, J. M., & Schumacher, R. S. (2015). Double Impact: When Both Tornados and Flash Floods Threaten the Same Place at the Same Time. Weather & Forecasting, 30(6), 1673-1693. https://journals.ametsoc.org/view/journals/wefo/30/6/waf-d-15-0084_1.xml ↩
-
Precipitation Systems Research Group. (n.d.). Monitoring of concurrent, co-located tornado and flash flood (TORFF) warnings. [Map of Weather Data]. Department of Atmospheric Science, Colorado State University. Retrieved December 20, 2021, from http://schumacher.atmos.colostate.edu/weather/TORFF_rt/ ↩
-
Burow, D., Ellis, K. & Tran, L. (2021). Simultaneous and collocated tornado and flash flood (TORFF) warnings associated with tropical cyclones in the contiguous United States. International Journal of Climatology, 41, 4253– 4264. https://doi.org/10.1002/joc.7071 ↩
-
Henderson, J., Nielsen, E.R., Herman, G.R., & Schumacher, R.S. (2020). A Hazard Multiple: Overlapping Tornado and Flash Flood Warnings in a National Weather Service Forecast Office in the Southeastern United States. Weather and Forecasting, 35(4), 1459-1481. https://doi.org/10.1175/WAF-D-19-0216.1 ↩
-
National Weather Service. (2014). May 2013 Oklahoma tornadoes and flash flooding. https://www.weather.gov/media/publications/assessments/13oklahoma_tornadoes.pdf ↩
-
National Weather Service. (2018). August/September 2017 Hurricane Harvey. https://www.weather.gov/media/publications/assessments/harvey6-18.pdf ↩
-
Ash, K.D., Egnoto, M.J., Strader, S.M., Ashley, W.S., Roueche, D.B., Klockow-McClain, K.E., Caplen, D. & Dickerson, M. (2020). Structural Forces: Perception and Vulnerability Factors for Tornado Sheltering within Mobile and Manufactured Housing in Alabama and Mississippi. Weather, Climate, and Society, 12(3), 453–472. https://doi.org/10.1175/2007JAMC1611.1 ↩
-
Gruntfest, E. & Handmer, J. (Eds.) (2001). Coping with flash floods (Vol. 77). Springer Science & Business Media. ↩
-
Schmidlin, T.W., Hammer, B. and Knabe, J. (2001). Tornado shelters in mobile home parks in the United States. Journal of the American Society of Professional Emergency Planners, 8, 1–15. ↩
-
Špitalar, M., Gourley, J.J., Lutoff, C., Kirstetter, P.E., Brilly, M. & Carr, N. (2014). Analysis of flash flood parameters and human impacts in the US from 2006 to 2012. Journal of Hydrology, 519, 863–870. http://dx.doi.org/10.1016/j.jhydrol.2014.07.004 ↩
-
Strader, S.M., Ash, K., Wagner, E. & Sherrod, C. (2019). Mobile home resident evacuation vulnerability and emergency medical service access during tornado events in the Southeast United States. International Journal of Disaster Risk Reduction, 38, 101210. https://doi.org/10.1016/j.ijdrr.2019.101210 ↩
-
Ashley, S. T., & Ashley, W.S. (2008). Flood fatalities in the United States. Journal of Applied Meteorology and Climatology, 47, 805-818. DOI: https://doi.org/10.1175/2007JAMC1611.1 ↩
-
First, J. M., Ellis, K., Held, M. L., & Glass, F. (2021). Identifying Risk and Resilience Factors Impacting Mental Health among Black and Latinx Adults following Nocturnal Tornadoes in the U.S. Southeast. International Journal of Environmental Research and Public Health. 18(16): 8609. https://doi.org/10.3390/ijerph18168609 ↩
-
Morss, R.E., Lazo, J.K. & Demuth, J.L. (2010). Examining the use of weather forecasts in decision scenarios: Results from a US survey with implications for uncertainty communication. Meteorological Applications, 17, 149–162. https://doi.org/10.1002/met.196 ↩
-
Paul, B.K. (2011). Environmental hazards and disasters: Contexts, perspectives and management. John Wiley & Sons. ↩
-
Strader, S. M., & Ashley, W. S. (2018). Finescale Assessment of Mobile Home Tornado Vulnerability in the Central and Southeast United States. Weather, Climate, & Society, 10(4), 797-812. https://doi.org/10.1175/WCAS-D-18-0060.1 ↩
-
Tierney, K. (2014). The Social Roots of Risk: Producing Disasters, Promoting Resilience. Stanford University Press. ↩
-
Wisner B., Blaikie .P, Cannon T., Davis I. (2004). At risk: Natural hazards, people’s vulnerability and disasters (2nd ed.). Routledge. ↩
-
Lindell, M.K. & Perry, R.W. (2012). The Protective Action Decision Model: Theoretical Modifications and Additional Evidence. Risk Analysis, 32, 616–632. https://doi.org/10.1111/j.1539-6924.2011.01647.x ↩
-
Morss, R.E. & Hayden, M.H. (2010). Storm Surge and “Certain Death”: Interviews with Texas Coastal Residents following Hurricane Ike. Weather, Climate, and Society, 2, 174–189. https://doi.org/10.1175/2010WCAS1041.1 ↩
-
Ripberger, J.T., Silva, C.L., Jenkins-Smith, H.C., & James, M. (2015). The Influence of Consequence-Based Messages on Public Responses to Tornado Warnings. Bulletin of the American Meteorological Society, 96, 57–590. https://doi.org/10.1175/BAMS-D-13-00213.1 ↩
-
Trumbo, C.W., Peek, L., Meyer, M.A., Marlatt, H.L., Gruntfest, E., McNoldy, B.D. & Schubert, W.H. (2016). A Cognitive‐Affective Scale for Hurricane Risk Perception. Risk Analysis, 36, 2233–2246. https://doi.org/10.1111/risa.12575 ↩
-
Walters, J. E., Mason, L. R., Ellis, K., & Winchester, B. (2020). Staying Safe in a Tornado: A Qualitative Inquiry into Public Knowledge, Access, and Response to Tornado Warnings, Weather and Forecasting, 35(1), 67-81. https://doi.org/10.1175/WAF-D-19-0090.1 ↩
-
Ashley, W. S. (2007). Spatial and temporal analysis of tornado fatalities in the United States: 1880–2005. Weather Forecasting, 22, 1214–1228. https://doi.org/10.1175/2007WAF2007004.1 ↩
-
Dixon, P. G., Mercer, A. E., Choi, J., & Allen, J. S. (2011). Tornado Risk Analysis: Is Dixie Alley an Extension of Tornado Alley? Bulletin of the American Meteorological Society, 92(4), 433-441. https://doi.org/10.1175/2010BAMS3102.1 ↩
-
Ashley, W. S., & Strader, S. M. (2016). Recipe for Disaster: How the Dynamic Ingredients of Risk and Exposure Are Changing the Tornado Disaster Landscape. Bulletin of the American Meteorological Society, 97(5), 767-786. https://doi.org/10.1175/BAMS-D-15-00150.1 ↩
-
Centers for Disease Control and Prevention. (2018). CDC/ATSDR Social Vulnerability Index [Data set.] CDC/ Agency for Toxic Substances and Disease Registry, Geospatial Research, Analysis, and Services Program. https://www.atsdr.cdc.gov/placeandhealth/svi/index.html ↩
-
Kline, R.B. (2015). Principles and practice of structural equation modeling. Guilford publications. ↩
-
Iowa Environmental Mesonet. (n.d.). IEM Cow NWS Storm Based Warning Verification. [Data set]. Iowa State University. Retrieved December 20, 2021, from https://mesonet.agron.iastate.edu/cow/ ↩
-
Emrich, C. T., & Cutter, S. L. (2011). Social vulnerability to climate-sensitive hazards in the southern United States. Weather, Climate, and Society, 3(3), 193-208. https://doi.org/10.1175/2011WCAS1092.1 ↩
-
Flanagan, B. E., Gregory, E. W., Hallisey, E. J., Heitgerd, J. L., & Lewis, B. (2011). A social vulnerability index for disaster management. Journal of homeland security and emergency management, 8(1). ↩
First, J.M., Ellis, K., & Strader, S. (2022). Examining Public Response and Climate Conditions During Overlapping Tornado and Flash Flood Warnings (Natural Hazards Center Weather Ready Research Report Series, Report 1). Natural Hazards Center, University of Colorado Boulder. https://hazards.colorado.edu/weather-ready-research/examining-public-response-and-climate-conditions-during-overlapping-tornado-and-flashflood-warnings