 Return to Quick Response Paper Index
Susan L. Cutter
University of South Carolina
E-mail: scutter@sc.edu
Michael Hodgson
University of South Carolina
Mike Gutekunst
University of South Carolina
Steven Jones
University of South Carolina
Return
to Hazards Center Home Page
Return to Quick Response Paper Index
This material is based upon work supported by the National Science Foundation under Grant No. CMS-0080977. Any opinions, findings, and conclusions or recommendations expressed in this material are those of the author(s) and do not necessarily reflect the views of the National Science Foundation.Citation: Deborah S. K. Thomas, Susan L. Cutter, Michael Hodgson, Mike Gutekunst, and Steven Jones. 2002. Use of Spatial Data and Geographic Technologies in Response to the September 11 Terrorist Attack. Quick Response Research Report #153. Boulder, Colorado: Natural Hazards Research and Applications Information Center, University of Colorado. URL: http://www.colorado.edu/hazards/qr/qr153/qr153.html
The September 11 terrorist attack on the World Trade Center (WTC) in New York City and the Pentagon in Washington D.C. were witnessed live on television by millions of people. As the events unfolded, the use of cell phones as warning devices became clear. Among the most significant lifeline disruptions in the September 11 attack in New York City was the total destruction of the City's Emergency Operations Center (EOC), the nerve center for coordinating response and recovery efforts. In light of the creation of a new EOC, did emergency managers have all the requisite spatial information that was needed to effectively respond to the disaster? Equally important is whether these capabilities existed prior to the loss of the EOC.
The emergency management community is keenly aware of the potential of mapping technologies (geographic information systems (GIS), remote sensing, and global positioning systems (GPS)) in support of emergency response operations (Mileti 1999, Cutter 2001). Despite this awareness, systematic knowledge about and experience with the application of geo-technologies to emergency response is somewhat limited. The September 11 attack on the World Trade Center and the loss of New York City's EOC provided an opportunity to evaluate the use of geographic technologies in response to a catastrophic disaster event. Taking this information, we can begin to identify issues that can inform other communities and hopefully increase their knowledge base about how GIS and related geo-technologies can improve emergency preparedness and response capabilities.
A number of questions guide this analysis. For example, to what extent were GIS-based decision support systems used during the rescue, relief, and initial cleanup phases of the disaster and by whom? Did responders need certain geographic data that were not immediately available? Were new data (e.g., remotely sensed imagery) collected? Was there sufficient expertise and software to support emergency management efforts? How did the use of geographical technologies vary by agency/or sector? What factors enhanced the use of such technology in real time? What factors inhibited its use?
Geographic technologies clearly contribute to all phases of the emergency management cycle (Figure 1), especially in hazard and vulnerability assessments (Hodgson and Cutter 2001; Cutter et. al 2000; FEMA 1997; Carrara and Guzzetti 1996; Hodgson and Palm 1992). Increasingly, geographic technologies are being utilized for hazard mitigation as well as response efforts. These range from damage assessments mapping the event and affected areas to search and rescue, risk assessment, risk perception (Hodgson and Palm, 1992), and risk communication (Hodgson and Cutter 2001). To facilitate our understanding of the immediate post-event application of these technologies, we concentrated our analysis on the first 21 days after the attack, primarily the rescue and initial relief phases. This phase represents the "real-time" application of these technologies so it is important to understand what worked and what did not and why. The identification of lessons learned and their transferability to other communities is an important element of our research.
Figure 1. Emergency Management Cycle
Field work conducted on October 8-10, 2001, provided an impression of mapping activities in New York City and was used to identify key people involved in the geo-technological response efforts. We used a snowball sampling approach based on these initial contacts to identify data providers and users. A structured questionnaire was used to guide the interviews. We also implemented a web-based survey instrument, which had very limited success. Telephone and face-to-face interviews proved to be the most successful methods for acquiring information. Our assessment is based on these interviews as well as the supporting literature on hazards, GIS, and remote sensing. The assessment includes all facets of geographic technologies, including data, personnel, software integration, hardware infrastructure, and organizational arrangements in the rescue and relief and preparedness stages of the emergency management cycle.
There were four primary mapping endeavors directly supporting emergency response efforts. The Urban Search and Rescue teams supported by the National Incidence Management Team (including Federal Emergency Management Agency (FEMA) personnel) provided micro scale mapping focused largely on the World Trade Center site itself. The Phoenix Group out of the New York City (NYC) Fire Department used GIS and remote sensing, again focusing primarily on the 16-acre site, for search and rescue efforts. The major mapping activities for the response were done at the EOC on Pier 92 and were coordinated by the Director of Citywide GIS out of the Department of Information Technology and Telecommunications. The maps produced here were generally at a more macro, city-wide scale. Many people and groups supported this effort, including other GIS specialists from agencies throughout NYC local government, vendors (notably ESRI), volunteer mappers, and local universities. Importantly, GIS was not the only geo-technology utilized. Groups also employed remote sensing technologies, such as LIDAR, thermal radar, air monitoring/modeling, and orthophotography, as well as GPS-based technologies. The New York Office for Technology (OFT) coordinated the remote sensing activities and production of derived products. The EOC processed thousands of map requests in the few months following the September 11 attacks.
New York City had already laid the foundation for a city-wide spatial data system and was well on its way to establishing an Enterprise GIS. Many of the base layers, such as parcel information and street centerlines, were already in place. Although incomplete at the time of the World Trade Center attack, the city was in the process of creating uniform (and unique) building identification codes that integrated those used by various agencies. GIS was used to re-map the changed geography of Manhattan. This included the creation of base maps of Lower Manhattan and affected buildings, as well as search and rescue grids, utility outages, and the altered nature of the transportation system. These maps were not only used to document the impacts of the hazard and identify affected people and places, but they also aided in resource allocation for rescue worker deployment and getting affected people to the proper services. Other technologies were also integrated with GIS.
Numerous remote sensing data collection efforts were planned and successfully implemented after the terrorism events on September 11, 2001. Other remote sensing missions were planned but not implemented. Still other remote sensing data collections took place much earlier than September 11 but these data found a new use because of the event. This section briefly notes the data collections/analysis that were conducted and the agencies/companies involved in this process. Only the public/commercial remote sensing activities are presented here.
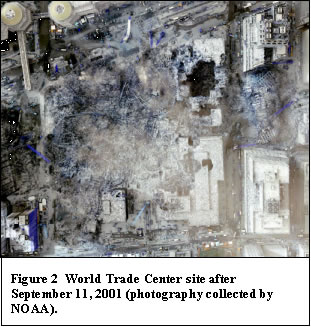
Remotely sensed data were used at the World Trade Center site and the Pentagon site for several hazard related purposes. The most common "purpose" that the public saw was the graphic images of the building destruction - part of the risk communication process. Images were collected from low altitude aircraft (both fixed-wing and helicopters) and through commercial satellites. Imagery from commercial satellites has relatively low spatial resolution (i.e., about 1 meter x 1 meter) and therefore offered little use other than images for the public view. Several companies and agencies collected vertical aerial mapping photography over the World Trade Center site (Figure 2). These data became the current "map" of ground zero as previous mapped features had been obliterated. Because of the rescue and later cleanup efforts the current "map" changed daily.
Similar to the need for an existing source of traditional GIS data of infrastructures to be used to assess damage and plan for response, historic remotely sensed imagery can be used to document the myriad set of landscape features around a hazard event. For the Pentagon site, Pictometry had mapped all of Arlington County, Virginia, in January 2001 using vertical and oblique pointing digital cameras. Earthdata had collected aerial photography of the WTC area in July of 2000. Analysis of the imagery, particularly at the Pentagon site, became useful for damage assessment as they documented transient construction materials at the Pentagon site.
Airborne LIDAR data over the WTC were used to map the surface elevations each day and analyze the debris pile for changes between days. Ground control points for controlling the LIDAR-derived surface models were collected by NOAA staff. In part, these data were used to estimate the volume of debris. It was also thought that the spatial changes in volume would reveal shifts in the pile that were not expected and thus, identify risks to the response personnel on the ground.
Thermal imagery was also collected on the same overflights of the WTC site as the LIDAR data. Essentially these data became a map of the absolute temperature of the surface each day (at the moment of imagery collection). Expected uses of thermal data included documenting the location/spread of continuous and new fires within the debris pile.
Post September 11, 2001, meetings to identify lessons learned have been held between some participants associated with remotely sensed data collections. Separate phone interviews by University of South Carolina staff with participants noted other lessons learned that might not have surfaced in the formal "lessons learned" meetings. Most parties agreed that having one agency - the New York Office for Technology (OFT) - coordinating the remote sensing collection streamlined the mission planning process for both federal and private partners. The OFT became the focal point (or "go-between") for user data requests and for coordinating collections. Unlike the contractual problems in historic natural hazard events, the relationship between the State of New York and federal and private partners was quickly established enabling almost immediate collection of photography, LIDAR, and thermal imagery of the New York site. Finally, it should be noted that the remote sensing collections required numerous participants for each overflight, ground control, and subsequent analysis. Collections of remotely sensed imagery after a natural hazard or technological hazard event are often problematic because of the physical environment at the time as well as the political, contractual, and legal hurdles. This specific type of hazard event, a terrorist induced event, presented an entirely new set of problems/restrictions to the remote sensing community.
Many of the maps and visualizations created in NYC were used in support of risk communication to the public. This is a key element of the emergency management cycle, creating useful tools for improved decision-making in the face of a disaster event. The informational needs are not the same for all groups, however, nor are GIS and map reading skills. Emergency responders' information needs are different than managers, or even the public. In the case of NYC, many, many maps were requested, which suggests response teams and managers were utilizing these products to a great degree. However, this research was unable to establish details on how maps were actually used by end-users. Remotely sensed imagery was used to monitor the debris pile but apparently was not a major source of information for the emergency response or cleanup personnel.
In terms of risk communication to the public, a content analysis of maps in The New York Times is revealing because the newspaper was a major source of information about the WTC attack. This was one of the primary ways of reaching the public with practical information about the event to give residents the means for finding relief resources, returning home, or getting back to a daily routine. During the first month after the September 11 attack, approximately 84 maps or mapping stories appeared in The New York Times. Coverage peaked in the first week after the event and diminished as the newspaper's focus shifted to Afghanistan beginning on September 19. The initial map coverage reflected the broad uses for emergency response such as damage assessments, alternative transportation routes, service provision status, risks in the environment, and relief resources. The quality and number of these maps was impressive, only highlighting the importance and prominence of mapping for public risk communication in any future event.
The post-event response experiences in New York City support the premise that geo-technologies can and do support response efforts. While they contain a wealth of valuable information, real-time or near real-time geo-technology efforts are resource intensive and require significant pre-planning efforts in order to perform most effectively. Pre-impact planning efforts serve multiple purposes, by minimizing hazard impacts and the identification of mitigation measures. Rapid-response situations require significant considerations for the use of geo-technologies as illustrated below.
Mapping efforts cannot depend on the Internet, available experts, or even one location for data, software, and hardware. Experiences in NYC clearly point to the need for alternative plans for geo-technology capabilities. As with all response efforts during an event of this magnitude, mobilization and coordination were challenging in the initial few days, especially because the original EOC had been destroyed. In this case, mapping efforts initially depended on local efforts in a make-shift environment. Support staff were not immediately available since air travel was prohibited and additional experts from anywhere outside of NYC were unable to gain access to mapping efforts swiftly. Resources of all types were stretched, and this was no less true of mapping. Computers, people, software, and data were hastily mobilized and the use of geographic technologies expanded in the days following September 11.
Even though there is a heightened awareness on how mapping products can support emergency response, based on the numbers of maps created and requested in New York City, implementing the suite of geo-technologies is no small task. The challenge of integrating geo-spatial data, platforms, and software into the response efforts is technically daunting for most emergency managers even at a pre-impact stage. Real-time or near real-time applications in the aftermath of a disaster are even more complicated. Considering all the potential technologies available (including what was actually used in NYC), advanced knowledge is required up front (pre-positioned) to know where the assets are, to know what they can support during response efforts, and to understand how to process the information with the software. The mechanisms for obtaining and processing data from various sensors and sources should be in place prior to any event and links to technical support established, including universities; private firms; and federal, state, and local government agencies. This points to the need for detailed plans for integrating geographic technologies into the entire pre-impact planning and post-event response effort.
Planning the flow of information through the organizational structure and how geo-technologies fit into this plan is vital to their successful use in a post-event situation. In the face of a disaster with the magnitude of the WTC attack, having a coordinated GIS enterprise in place prior to a disaster is clearly the ideal situation. Many NYC agencies within the city government already had established formal and informal relationships, which became the basis for building an enterprise GIS in the post-event period. There also needs to be coordination among mapping efforts at the federal, state, and local levels. Jurisdictions ideally would not want to depend on informal relationships, having to develop information flow processes, or creating data on the fly. This translates to the need for organizational and personnel plans for technology, as well as integrated data sets. In this way, the duplication of effort and resources among agencies will be minimized and the most effective tools available within the necessary time frame.
Geographic technologies do not just take root overnight within an organization. Creating an effective mapping system requires substantial planning, effort, time, and most importantly, money. It often has modest beginnings within an organization, evolving and becoming increasingly integrated into the decision-making process over time. The challenge at the moment is that preparedness for terrorism or bioterrorism is at the forefront of the American consciousness and there is an impending need to have better mapping capabilities throughout the emergency management cycle, but particularly for response. Facing this challenge requires immediate attention to implementing geo-technologies and integrating them into the emergency management decision-making process.
In conjunction with the vast array of geographic technologies deployed in NYC and the unprecedented local coordination of efforts, there still were some problems in managing geo-technologies. While people's first priority was, no doubt, to aid in the search and rescue, relief, and recovery efforts, there was some competition among vendors and contractors to demonstrate their capabilities. This may have resulted in uncoordinated GIS efforts or the duplication of GIS or remotely sensed data collection effort. More importantly, different endeavors may have complicated risk communication by conveying dissimilar messages. Outside of the vendor arena, even some of the efforts between the levels of government may not have been as efficient as possible. Having detailed plans for geo-technologies in place limits the potential for this.
The importance of having a spatial data infrastructure in place prior to any event is vital to insure successful mapping during rescue, relief, and recovery phases. Many within the GIS community recognize the importance of this for a variety of applications apart from emergency management. A uniform spatial data infrastructure is an absolute necessity in emergency response, especially when the applications occur in real-time or near real-time. With data in place that integrates into a single platform and has the appropriate spatial and temporal resolution, the foundation is set for utilizing geographic technologies to their fullest during response efforts.
GIS is a data-driven technology. Consequently, swift access to high quality pre-positioned data is vital to emergency management operations in crisis, response situations. Although well on their way to completion, fully integrated data sets were not entirely in place in NYC prior to September 11. Many NYC agencies utilized GIS extensively, but it was not an entirely integrated enterprise GIS system containing all of the necessary data elements (both spatial and attribute). For example, some of the sub-terrain features, such as subway lines or underground storage tanks, were not in a GIS, but instead were in CAD (computed aided design) systems, some other database system, or plain paper maps. Broadly speaking, the quality of available GIS data varies extensively across departments, jurisdictions, and communities in the U.S. In addition, many desirable data sets simply do not exist. For example, if we are interested in vulnerable populations, there is little information on homeless people, undocumented workers, or even the day versus night populations of urban centers and/or buildings. These data gaps must be filled for effective response using GIS. Another important point is that data collection is not a finite process. Instead, it is ongoing either because of new data needs or the maintenance and updating of data already collected.
The reality of forming integrated, accessible data sets can be quite difficult for political or economic reasons, but these events only highlight the potential value. Another challenge is the creation of integrated data sets across multiple jurisdictions. While the databases were maintained by various agencies in the case of New York City and September 11, they were not faced with trying to integrate spatial data from multiple jurisdictions. In most other places, faced with a different scenario, spatial data requirements would require these agreements. Unfortunately, few places across the U.S. maintain regional GIS databases.
Data sharing agreements must be in place prior to any event to ease the transition to real-time, response-based GIS. During emergency response efforts, privately held data, such as utilities, as well as classified data will likely be needed. A mechanism for obtaining this type of data should already be negotiated. This may translate to having data stored in a secure environment or obtaining it from a secure site. One point is clear - after the destruction of the EOC in WTC Building 7, these data should be stored in multiple locations including the main center.
The goal is to improve emergency workers abilities to do their jobs by giving them useful tools. If these technologies fail on this account, then they have not effectively supported response efforts. There is a distinct need to ensure that products, including models and maps, meet the needs of end-users and that appropriate tools make it into the hands of the right users. It was unclear in New York City, for example, to what extent the maps were actually used in the response as compared to providing information (and maps) to the media.
Given the unique threat that terrorism presents, many agencies took data off-line in the aftermath of September 11. While not directly part of the NYC local response, the broader implications for data sharing are immense. Many government agencies, particularly in the environmental arena, are making increasing amounts of information and data available to the public as part of community right-to-know efforts. These policies are being re-evaluated out of concern that this same information can fall into the wrong hands, prompting public debate on data access and its corollary, privacy issues. While there are philosophical issues surrounding this debate, in a practical sense it has very real implications for the GIS and emergency management communities. Making data on hazardous threats more difficult to obtain could hinder preparedness or mitigation efforts. Data sharing may become even more difficult than it is already. The challenge of balancing a community's right to know about environmental threats with national security has only just started and how it will play out remains to be seen.
The level of recognition of what geo-technologies can contribute to response and decision-making efforts most certainly increased in the wake of the September 11 events. The original EOC in NYC had one computer terminal devoted to mapping. The make-shift EOC on Pier 92 had an entire section with over 20 computers, a server, and a whole staff dedicated to creating maps. By demonstrating how maps can aid in the rescue, relief, and recovery efforts in this national disaster, the role of mapping in any future NYC EOC, and potentially other locations, will certainly be reassessed. The number of maps included in The New York Times over this period also points to an increased role of mapping for risk communication. In fact, the public and emergency responders and managers may now expect high-quality informative maps in any future events after having a glimpse of mapping products. The full range of ways that mapping can support emergency management is only beginning to be realized and the extensive use of mapping in NYC further emphasizes the need to explore the effective integration of these geo-technologies into the emergency management cycle.
This study provided an overview of how geo-technologies were used in the aftermath of the NYC attack on the WTC, as well as supplying some practical considerations for other communities when incorporating GIS into emergency management plans. We are still far from understanding the full potential for these technologies during response efforts, however. There is clearly a need for a true post-audit of the experiences in NYC to assess the full-range of successes and shortcomings associated with mapping technologies. This would include an assessment of how people actually used the maps, as well as identifying the ways in which they were incorporated into the decision-making process. Further, studies should be conducted on the needs of end-users, apart from the NYC experience, focusing on the types of maps and data various groups need to support their activities.
Carrara, A., and F. Guzzetti (eds.). 1996. Geographical Information Systems in Assessing Natural Hazards. Dordrecht: Kluwer Publishers.
Cutter, S.L. (ed.). 2001. American Hazardscapes: The Regionalization of Hazards and Disasters. Washington, D.C.: Joseph Henry Press.
Cutter, S.L., J.T. Mitchell, and M.S. Scott. 2000. Revealing the Vulnerability of People and Places: A Case Study of Georgetown County, South Carolina. Annals of the Association of American Geographers 90(4): 713-737.
Federal Emergency Management Agency. 1997. Multi Hazard Identification and Risk Assessment: A Cornerstone of the National Mitigation Strategy. Washington D.C.: Government Printing Office.
Hodgson, M.E. and R.I. Palm. 1992. Attitude and Response to Earthquake Hazards: A GIS Design for Analyzing Risk Assessment. GeoInfo Systems 2(7):40-51.
Hodgson, M.E. and S.L. Cutter. 2001. "Mapping and the Spatial Analysis of Hazardscapes" in Cutter, S.L. (ed.), American Hazardscapes: The Regionalization of Environmental Risks and Hazards. Washington D.C.: Joseph Henry Press. pp. 37-60.
Mileti, D.S. 1999. Disasters by Design: A Reassessment of Natural Hazards in the United States. Washington D.C.: Joseph Henry Press.
Return
to Hazards Center Home Page
Return to Quick Response Paper Index