
Snowbirds and Senior Living Developments:
An Analysis of Vulnerability Associated with Hurricane Charley
Burrell E. Montz
Department of Geography
Binghamton University
Binghamton, NY 13902-6000
E-mail: bmontz@binghamton.edu
and
Graham A. Tobin
Department of Geography
University of South Florida
4202 East Fowler Avenue (NES 107)
Tampa, FL 33620-5250
E-mail: gtobin@cas.usf.edu
2005
A printable version of this QR report is available in PDF format.
This material is based upon work supported by the National Science Foundation. Any opinions, findings, and conclusions or recommendations expressed in this material are those of the author(s) and do not necessarily reflect the views of the National Science Foundation or the Natural Hazards Research and Applications Information Center.Citation: Montz, Burrell, E., and Graham A. Tobin. 2005. Snowbirds and Senior Living Developments: An Analysis of Vulnerability Associated with Hurricane Charley. Quick Response Research Report 177. Boulder, CO: Natural Hazards Research and Applications Information Center, University of Colorado. http://www.colorado.edu/hazards/qr/qr177/qr177.html.
Introduction
On Friday, August 13, 2004, Hurricane Charley made landfall as a category 4 storm at Cayo Costa, a barrier island west of Cape Coral, Florida, in the southwestern part of the state. Less than eight hours later, Hurricane Charley moved offshore near Daytona Beach on the northeast coast of Florida. During that short time, Charley cut a swath across the state that resulted in nine deaths, the encouragement of some two million residents to evacuate inland, and insured damage estimated at $6.755 billion (Insurance Information Institute, 2004). While it is difficult to sort out the amount of public disaster aid that came to Florida as a result of Hurricane Charley, every county in the state was declared eligible for some form of assistance, although the categories of assistance differed. All tolled, some $3.3 billion in federal disaster aid was allotted to Florida counties during the 2004 hurricane season.
Charleys characteristics, particularly its size and speed, created a set of problems and impacts that differ from those usually encountered with hurricanes of any magnitude. Charley moved much too fast for any large amount of rain to fall at a given location. Although this was a short-lived system due to its high speed, a swath of damage was seen through Florida as the storm traveled northeast across the central Florida Peninsula, knocking down trees and power lines and ripping homes away from their original spots. Thus, most of the damage was related to wind, and it was distributed along the path of the storm from the coast inland. Damage patterns were not consistent along the swath, forcing consideration of why pockets of damage occur where they do. The impacts from this storm challenge the conventional wisdom that development in coastal areas needs to be undertaken with hurricanes in mind, but areas away from the coast are less at risk and thus require less management. Indeed, social vulnerability appears to be a significant factor in this event, while traditional definitions of geophysical vulnerability seem to be less important. Particularly hard hit were senior living developments comprising manufactured homes, many residents of which were seasonal residents. However, differences in damage and impacts were seen within and between these developments, based partly on exposure to the event, but also based on the age of the development.
In determining impacts on senior living developments, special attention was given to snowbirds and manufactured homes. For the purposes of this research, snowbirds are defined as seasonal residents who generally spend the winter months in Florida and summer months in the northern states or Canada. It was hypothesized that this would lead to different levels of vulnerability and rates of recovery based on the seasonality and permanency of residents. Manufactured homes were formerly called trailers or mobile homes (a term still used in the United States census). According to About.com (2005):
- Manufactured homes are built in a factory.
- These homes conform to a federal building code, called the HUD code, rather than to building codes at their destinations.
- Homes are built on nonremovable steel chassis.
- Sections are transported to the home site on their own wheels.
- Multipart units are joined at their destination.
- Segments are not always placed on a permanent foundation (more difficult to refinance).
- Building inspectors check the work that is done locally (electric hook up, etc.) but are not required to approve the structure.
- Manufactured homes are generally less expensive than site-built and modular homes.
- Manufactured homes often decrease in value over time.
These attributes have also been linked with increased vulnerability, especially in high winds. Thus, differences were expected in damage depending on the extent and construction of mobile homes. The terms mobile home, manufactured home, and trailer are used interchangeably in this report.
Given the above, the research reported here concentrates on the vulnerability of these developments and their residents and on changes in vulnerability throughout the area. The specific research questions that are addressed are:
- What factors seem to explain the differences in impact between senior living developments?
- To what extent is the snowbird population a factor in recovery?
- What spatial patterns are evident among counties most affected by Hurricane Charley with respect to elderly populations and the prevalence of manufactured homes?
- What are the implications for emergency managers and planners in both coastal and noncoastal counties?
Following discussion of Floridas hurricane history with a focus on the area affected by Hurricane Charley, a review of the literature is presented so that the approach used here can be viewed within a theoretical framework. Each research question is then addressed in turn.
Hurricane History
Some 86 hurricanes and 73 tropical storms made landfall in Florida between 1901 and 2002 (Winsberg et al., no date); losses and deaths varied significantly. The data in Table 1 show the impacts of those hurricanes that previously affected areas that were hit by Charley in 2004. These data indicate that losses have been high. Although a major hurricane has not hit the area since 1960, previous experiences coupled with significant population growth suggests an increase in vulnerability.
Prior to Charley, Donna was the most recent hurricane to hit the area under study. Hurricane Donna was one of the longest and strongest hurricanes in recorded U.S. history. Sustained hurricane winds were recorded from Florida all the way into New England (see Figure 1). This category 5 storm had maximum sustained winds of up to 160 miles per hour and caused thirteen deaths and $305 million in damage as the system moved through Florida after making landfall in Naples. In 2004, Charley made a path through Collier, Lee, Charlotte, DeSoto, Hardee, Polk, Orange, and Flagler Counties, which were all hit by Donna in 1960.
Hurricane Charley originated as a tropical depression on August 9, moving quickly across the Caribbean while strengthening (see Table 2). It passed just south of Jamaica about two days after it became a hurricane. Charley made landfall in Cuba and then turned toward the northeast. The system accelerated toward the southwest coast of Florida, rapidly becoming more intense, from a category 2 to a category 4, just prior to landfall. The storm had been predicted to make landfall in Tampa Bay, so preparations were focused there, and two million people were encouraged to evacuate. However, Hurricane Charley suddenly turned toward the Fort Myers-Port Charlotte area and made landfall there on August 13 (see Figures 2 and 3).
Several factors came together to create problems for emergency managers that may have caused the public to be caught off guard. These factors were the eastward turn in Charleys path that led to landfall occurring farther south than predicted, in the Charlotte Harbor region rather than the Tampa Bay area; the rapid intensification of the storm, which changed from a category 3 to a category 4 storm in about three hours; and the contraction of the eye of the storm as it approached land.
While none of these factors are unexpected and each is well within acceptable margins of variance in hurricane forecasting, in combination they complicated matters significantly. Many evacuees from Tampa headed to central Florida, placing them directly in the path of the hurricane. An intense storm with a small eye and rapid forward movement led to less storm surge than predicted and at the same time increased the probability of structural damage from high winds. The numerous meso-vortices and tornadoes reported during the hurricane may also have resulted from the size and speed of the storm (Squires and Karp, 2004).
As mentioned earlier, every county in the state was declared a disaster area following Hurricane Charley, though the categories of assistance differed (see Figure 4). The 26 counties that received both individual and public assistance sustained the greatest damage. The locations of the 17 hardest-hit counties (of the 26) provide an excellent view of Charleys path through Florida (see Figure 5).
The pattern of losses suggests that those areas known to be at highest risk were not necessarily those that experienced the greatest losses. Indeed, many of the counties affected are not coastal. Thus, differences in vulnerability must be attributed to more than geophysical conditions of particular locations. It is this topic, vulnerability, that will now be addressed.
Understanding Vulnerability
Vulnerability is well recognized as being composed of elements of the physical environment as well as social and economic conditions that affect the ability to cope and recover (Clark et al., 1998; Cutter, 1996; Susman et al., 1983). While there is agreement that vulnerability consists of both sets of elements, there is little discussion in the literature as to whether or not, or under what conditions, one or the other set of factors dominates. Some emphasize the natural event (Crozier, 1988), while others focus on social conditions to explain differences among individuals and groups (Blaikie et al., 1994). The pattern of losses attributable to Hurricane Charley, particularly in noncoastal areas, suggests that social, economic, and demographic characteristics are important. In addition, even in the same location, different groups were affected differently, illustrating the importance of social vulnerability in regard to this event.
Social vulnerability has been defined in a variety of ways in the literature, and there is some agreement on characteristics of the population that contribute to higher levels. Factors such as age, mobility, and income have been cited often (Clark et al., 1998; Montz and Tobin, 2003). While much work has been done on defining vulnerability and documenting spatial differences (Hodsgon and Palm, 1992; Montz and Tobin, 1998), much less has been undertaken on the monitoring of changes over time. Part of this is due to difficulties in reaching agreement on what should be used as indicators of vulnerability (King, 2001) as well as problems associated with finding appropriate variables that can be traced reliably over time at an appropriate scale. Indeed, spatial variations in geophysical risk, exposure to hazard, and dwelling type have confounded results (Montz and Tobin, 1998; Cutter et al., 2000; Chakraborty et al., 2005).
The dynamic nature of vulnerability centers on three factors: the geophysical environment, the built environment, and characteristics of the population that make various segments more or less vulnerable. Even if we assume the physical environment is not changing, elements of the other two can significantly affect vulnerability and how it changes over time. In Florida, population numbers are increasing and the proportion of the population that is retired is also increasing. Recent research on the elderly has often focused on their responses to disasters (Bolin and Klenow, 1982-83; Ellen, 2001; Thomas and Soliman, 2002; Sanders et al., 2003), but the results do not provide definitive conclusions. Some studies indicate that the elderly have remarkably successful coping strategies, while others suggest that the elderly are more vulnerable. Nonetheless, as more elderly (as well as younger people) move to hurricane-prone regions, vulnerability increases. It is also well recognized that the structural soundness of homes can increase or decrease vulnerability; manufactured homes are particularly susceptible to damage (Cutter et al., 2000; Chakraborty et al., 2005). Thus, documentation of experiences and patterns of vulnerable populations as well as of changing vulnerability over time can help in the development of dynamic responses.
Methods
Four senior living developments were visited in the immediate aftermath of Hurricane Charley. Characteristics of each are presented below along with descriptions of the damage incurred and issues affecting recovery and rebuilding.
Next, census data were mapped to look at patterns of vulnerability in the 17 hardest-hit counties, which are darkly shaded on the maps in Figures 4 and 5. Although the senior living developments studied here represent only one of the counties (Charlotte), increases in elderly populations were seen throughout the affected area. As these populations increase throughout Florida, so does vulnerability. It is important to recognize the extent to which changes in elderly populations are or are not commensurate with changes in the population as a whole. Similarly, the increase (or lack of increase) in the number of mobile homes presents another issue that merits evaluation. Spatial and temporal changes in vulnerability are evaluated using these characteristics, which are recognized as being associated with higher levels of vulnerability.
Unlike many other studies of vulnerability, the purpose of this project is not to develop an index that incorporates several variables. Instead, it is aimed at understanding how, where, and to what extent vulnerability has changed over time in a given area. Because the counties that comprise the study area are quite different in their socioeconomic characteristics, particularly in the ones that are focused on here, it is important to understand the dynamics of the individual characteristics.
Results
Senior Living Developments
Four senior living communities composed of manufactured homes of various ages and construction qualities were visited. The damage to these structures and the reactions of the residents in each development were documented. Issues related to the redevelopment of each individual community were determined, as were issues that affected all of them.
Pine Acres
Pine Acres is a development of some 125 single-wide homes north of Punta Gorda that has been in existence for a number of years. Indeed, it is the oldest of the developments visited. Although most manufactured homes experienced some damage, some homes experienced total damage, while others came out relatively unscathed (see Figure 6). Virtually all car ports, Florida rooms, and lanais were completely destroyed.
Unfortunately, it was impossible to determine the proportion of residents who were snowbirds because there was no community center or office, so no manager was readily identifiable on site. Pine Acres is also the least affluent of the developments visited. This economic situation complicates recovery. This development predates the most recent county ordinances, and it remains to be seen if rebuilding in kind will be allowed, or if changes to the developments size and configuration will be required.
Harborview Park
As suggested by its name, Harborview Park is located in Charlotte Harbor, along the bay, and is a development of approximately 165 primarily single-wide units, 12 of which were completely destroyed. Numerous others suffered extensive damage. This development appears to be somewhat newer than Pine Acres, and hence may have had better construction.
Immediately following the hurricane, the manager said he intended to rebuild the park. However, several things could alter those plans, including the proportion of snowbirds and demand for the land. With snowbirds approximating 80 percent of the parks residents, their interest in and ability to return and rebuild will have an impact on the parks future. Perhaps more important is the parks location. The manufactured home park is located on the bay, which makes it ripe for redevelopment as a hotel or condominium site (see Figure 7). With high demand for land, particularly waterfront land, the benefits of selling may far outweigh the benefits of rebuilding, no matter what the snowbirds want to do.
Port Charlotte Village
This cooperative consists of 435 units, 40 percent of which are occupied year round. A large proportion of the development is composed of single-wide units; the newer units are double-wides. The large size of the development, perhaps combined with the number of snowbirds, led to a slower cleanup in the immediate aftermath of the hurricane than was seen in the other developments (see Figure 8). According to the assistant manager, the park had its own disaster plan, which was put into effect on Thursday, August 12.
The future of the park is in question as a vote of the membership is required to make a decision. However, any change in Charlotte County regulations would also complicate rebuilding and recovery.
Lakewood Village
Also north of Punta Gorda, Lakewood Village is the newest and most affluent of the senior living developments visited. The 218 units, 60 percent of which are occupied year-round, are mostly double-wides, and most incurred damage to roofs and car ports; little major structural damage was evident. The relative newness of the development along with its year round residential character led to its being the quickest to recover in the immediate aftermath of the hurricane (see Figure 9). This proved to be the most resilient of the developments, probably because of its relative affluence. However, although the residents own the structures, they lease the land on which they are placed. Thus, unlike Port Charlotte Village, for instance, the future of the park is not in their hands.
Implications and Complications
The developments discussed here are similar in that they are all composed of manufactured homes and they are all restricted to people who are at least 55 years of age. In addition, each has residents who can be classified as snowbirds. Thus, they provide a useful means of comparing how vulnerability varies, even in particularly vulnerable populations.
The differences between the developments are striking and may explain variations in recovery. Differences can be found in the size and age of parks and homes, which also illustrate important differences in structural characteristics. Ownership and residency patterns are strikingly different among the developments. For some, snowbirds make up the majority of the population. For others, they only represent a minority of the population.
The findings from this preliminary work suggest that age and size of housing matter. In general, the newer and larger the structures, the less damage incurred. In addition, short-term recovery is helped when there are fewer snowbirds. However, other factors complicate the ability to draw solid conclusions as of yet. The effects of each parks location have not yet been fully analyzed. Clearly, each was in Charleys path, but the extent to which the location influenced damage irrespective of age and size of housing is not fully understood. It may be that some developments incurred less damage than others not because of the factors cited here, but rather because of locational dynamics of winds associated with the hurricane. This factor will be among those included in subsequent research.
While the existence of larger proportions of snowbirds appeared to complicate recovery over the short term, it is not known if long-term recovery is helped or hindered by fewer snowbirds. On one hand, a smaller snowbird population suggests that there are more people on-site to make individual and group decisions to facilitate recovery efforts; on the other hand, a larger population of snowbirds suggests additional resources coming to the community from the outside for recovery. At the same time, since the hurricane season occurs during the summer months and snowbirds are invariably away at that time, fewer people are actually exposed to the hazard.
The role that ownership patterns will play in the ability to rebuild is another unknown. Some communities were based on leased land; one was a cooperative. These differences affect the ability to rebuild and will thus have an effect on the recovery process. In conjunction with ownership considerations is demand for land in Florida for all uses. Any waterfront property is high value, and a development consisting of manufactured homes with a waterfront location will be in great demand. The real estate market is booming, even for damaged properties (see Figure 10). Whether or not these properties remain in the same use or are changed to commercial or multiunit structures depends on local zoning, surrounding land uses, and other factors. The implications of all of these variables have not yet been fully explored, but will serve as the next phase of the research.
Two other factors will influence recovery for the senior living developments, as well as for all areas of the counties affected. The extent and impact of commercial losses will affect the long-term recovery of each county and will have trickle-down effects to all residents, no matter where they live or what damage their residences sustained. Second, Charley was the first of four very damaging hurricanes to strike Florida during the 2004 hurricane season. While the information presented in this report on the senior living developments focuses on the immediate aftermath of Charley, long-term recovery will be affected by the other hurricanes as well. While not a direct concern of subsequent research, these factors will, of necessity, be incorporated into future work.
Changing Vulnerability
This research presents a snapshot of Charlotte County in the aftermath of Hurricane Charley. However, it is important to understand the larger spatial and temporal context in order to understand the patterns of vulnerability that have been reported. To provide a basis for such an understanding, census data on changes in population, population 65 and older, and mobile homes were mapped for the seventeen counties most severely affected by Charley. Two time periods were used. The first, 1970 to 2000, provides a means of evaluating changing vulnerability since the last major hurricane struck the area. The second, 1990 to 2000, allows for analysis of only more recent changes.
Population Change
The 17 counties on which this research is centered are diverse in terms of population characteristics. Populations range from 10,576 (Glades County) to 896,344 (Orange County); all counties have experienced population growth since 1990 (see Table 3). DeSoto, Glades, Hardee, and Highlands Counties have the lowest median household incomes at just over $30,000, while Collier and Seminole Counties have the highest, in excess of $48,000 (U.S. Census Bureau, 2004). These characteristics suggest that vulnerability varies throughout the region under study.
The population of the southeastern United States has increased dramatically in recent decades, and the counties most affected by Hurricane Charley are no exception. Indeed, as shown in Figure 11, only two counties in the study area experienced population growth rates of less than 110 percent, and one, Flagler, experienced growth in excess of 500 percent, increasing from some 4,400 people in 1970 to more than 49,000 in 2000. There is no spatial pattern evident in this growth as coastal counties experienced similar rates to noncoastal counties. These growth rates clearly illustrate that more people are at risk, no matter what other characteristics may exist.
Of particular concern to this work is the more recent population growth, which brought to hurricane-prone regions people who have had little, if any, experience with this hazard. The map in Figure 11 illustrates this. Three counties, Collier, Osceola, and Flagler, experienced growth rates in excess of 40 percent, and all but four counties had population increases in excess of 20 percent. The sheer numbers are clearly of concern when one considers vulnerability of an area. However, it is specific characteristics of that population that serve to define changes in vulnerability more accurately. In this study, age and mobile homes are the variables used to illustrate changes in vulnerability.
Population 65 and Older
As might be expected, the change in the percentage of the population 65 years of age and older is large throughout the study area (see Figure 12). Flagler and Collier Counties, in the extreme north and south respectively, stand out for having experienced the greatest increases during both time periods. However, between 1970 and 2000, all counties increased at rates in excess of 100 percent. The rate of growth was much less between 1990 and 2000, but each county continues to see a greater proportion of elderly residents, whether on the coast or in the interior.
Comparison of Figure 12 with Figure 11 suggests that those counties with the greatest population increases are also seeing increases in vulnerable populations. However, for the three counties experiencing the greatest rates of growth between 1990 and 2000 (Collier, Osceola, and Flagler), the rate of increase in the elderly population is slightly greater than that of the population as a whole. Thus, the populations in these counties are aging.
Mobile Homes
The maps in Figure 13 depict changes in the proportion of mobile homes as part of the housing stock. No county experienced less than a 200 percent increase in the proportion of mobile homes between 1970 and 2000; DeSoto and Flagler counties showed the greatest increases (greater than 1,000 percent). Most of the growth in this time period was in the central part of the study area, which included a few coastal counties. By the reporting period 1990 to 2000, the rate of increase in mobile homes had lessened significantly and several counties saw decreases. Again, the greatest increases were in the central part of the study area and in noncoastal counties. Under a normal hurricane scenario, this pattern makes sense wherein the proportion of mobile homes is decreasing or experiencing smaller increases in the more vulnerable coastal counties.
Discussion of Patterns
The data presented here suggest that vulnerability, at least as measured by these variables, has increased throughout the study area. The patterns vary depending on the characteristic mapped, but overall there is increased population and disproportional increases among the factors considered here. For instance, in both time periods, the increase in the percentage of the population age 65 and older is higher than the total population change in the coastal counties of Charlotte, Collier, Flagler, Lee, and Brevard.
While the number and proportional growth rate of mobile homes is large during the period from 1970 to 2000, this growth was much smaller in the 1990 to 2000 period. Indeed, some counties saw decreases or very small increases in the percentage of homes that are classified as mobile homes. Of these, several are coastal. On the other hand, the coastal counties of Flagler, Volusia, Brevard, Charlotte, and Lee experienced at least a six percent increase in mobile homes. However, it is the continuing increase in the number of mobile homes in the noncoastal counties that is notable. Under ordinary circumstances, locating mobile homes away from coasts makes sense as these are homes that are affordable both as second homes and as primary residences for those with fewer assets.
The results of this stage of the research suggest that the proportion of the population defined as having relatively higher levels of vulnerability is increasing over time, sometimes at very large rates. However, spatial patterns are less obvious. With respect to the population 65 years of age and older, the vulnerability of coastal counties has increased. With respect to the increase in mobile homes, the vulnerability of coastal counties has not increased as much as it has elsewhere in the study area.
These results clearly illustrate that vulnerability changes dramatically even over relatively short periods of time, but the patterns of change depend on how vulnerability is being defined. As an example, Charlotte County, where Hurricane Charley made landfall, experienced a 27 percent increase in population between 1990 and 2000. At the same time, the change in the population 65 years of age and older was slightly greater than that of the population as a whole, and the proportion of mobile homes increased by only a small percent (approximately 10 percent). Still, the elderly and those living in mobile homes were significantly affected by Hurricane Charley as evidenced by the findings from the four senior living developments.
Conclusions
This two-phased research project focused on the impacts of Hurricane Charley on elderly populations living in manufactured homes. To date, little work has been done in this area, but the impacts seen here suggest that it is a fertile ground for subsequent research. Preliminary results lead to considerations of the effects of permanency of residence, age of the population, and structural characteristics as interwoven factors influencing resilience and long-term recovery. This controlled setting provides a useful context in which to test and refine models of vulnerability and recovery, especially in light of the increasing exposure of the elderly population to hurricanes, as populations in coastal regions increase.
On the other hand, the impacts of Hurricane Charley made it clear that evaluating vulnerability in coastal counties is not sufficient. The changes seen throughout this study area suggest that a broader spatial view of vulnerability is needed. The fact that Charley moved quickly through both coastal and noncoastal areas indicates that the locations and characteristics of vulnerable populations (as defined by socioeconomic factors, not geophysical ones) must be known for appropriate and efficient planning, preparation, and recovery efforts. Also, 2004s additional hurricanes further illustrated this point. Thus, a focus on spatial and temporal patterns, with particular emphasis on the elderly population, is required for a full understanding of emergency management needs under different geophysical scenarios.
Acknowledgements
While research presented here began in the immediate aftermath of Hurricane Charley, the subsequent analyses were undertaken with the assistance of Leyla Jafarova and Valerie Blackman at Binghamton University and Linda Whiteford, Erin Hughey, Heather Bell, Clay Kelsey, Mary Pat Everist, and Ray Miller at the University of South Florida. Of course, any errors or omissions must be attributed to the authors.
References
About.com. 2005. Differences between modular homes and manufactured homes. http://homebuying.about.com/cs/modulareducation/a/modularhomes.htm.
Blaikie, P., T. Cannon, I. Davis, and B. Wisner. 1994. At risk: Natural hazards, peoples vulnerability, and disasters. London: Routledge.
Bolin, R.C., and D.J. Klenow. 1982-1983. Response of the elderly to disaster: an age stratified analysis. International Journal of Aging and Human Development 16:283-96.
Chakraborty, J., G.A. Tobin, and B.E. Montz. 2005. Population evacuation: assessing spatial variability in geo-physical risk and social vulnerability to natural hazards. Natural Hazards Review 6:23-33.
Clark, G.E., S.C. Moser, S.J. Ratick, K. Dow, W.B. Meyer, S. Emani, W. Jin, J.X. Kasperson, R.E. Kasperson, and H.E. Schwarz. 1998. Assessing the vulnerability of coastal communities to extreme storms: The case of Revere, MA, USA. Mitigation and Adaptation Strategies for Global Change 3:59-82.
Crozier, M. 1988. The terminology of natural hazards assessment. New Zealand Journal of Geography 86:5-7.
Cutter, S.L. 1996. Vulnerability to environmental hazards. Progress in Human Geography 20 (4): 529-39.
Cutter, S.L., J.T. Mitchell, and M.S. Scott. 2000. Revealing the vulnerability of people and places: A case study of Georgetown County, South Carolina. Annals of the Association of American Geographers 90 (4): 713-737.
Ellen, E.F. 2001. The elderly may have advantage in natural disasters. Psychiatric Times XVII (1).
Hodgson, M.E., and R. Palm. 1992. Attitude and response to earthquake hazards: A GIS design for analyzing risk assessment. Geographic Information Systems 2(7): 40-51.
Insurance Information Institute. 2004. The ten most costly hurricanes in the United States. http://www.iii.org/media/hottopics/additional/florida/.
King, D. 2001. Uses and limitations of socioeconomic indicators of community vulnerability to natural hazards: Data and disasters in northern Australia. Natural Hazards 24 (2): 147-56.
Montz, B.E., and G.A. Tobin. 1998. Hazardousness of location: Critical facilities in the Tampa Bay region. Papers and Proceedings of the Applied Geography Conferences 21:315-22.
Montz, B.E., and G.A. Tobin. 2003. Hazardousness of the Tampa region: Evaluating physical risk and socio-economic vulnerability. Papers of the Applied Geography Conferences 26:380-88.
Pasch, R. J., D. P. Brown, and E.S. Blake. 2004. Tropical cyclone report: Hurricane Charley. http://www.nhc.noaa.gov/2004charley.shtml.
Sanders, S., S. Bowie, and Y. Bowie Dias. 2003. Lesson learned on forced relocation of older adults: The impact of Hurricane Andrew on health, mental health, and social support of public housing residents. Journal of Gerontological Social Work 40 (4).
Squires, C., and D. Karp. 2004. Tree-twisting wind puzzles scientists. St. Petersburg Times 121 (27): 8a.
Susman, P., P. OKeefe, and B. Wisner. 1983. Global disasters, a radical interpretation. In Interpretations of calamity from the viewpoint of human ecology, ed. K. Hewitt, 263-83. Boston: Allen and Unwin.
Thomas, N. and H. Soliman. 2002. Preventable tragedies: heat disaster and the elderly. Journal of Gerontological Social Work 38(4): 53-66.
Tobin, G.A., H.M. Bell, B.E. Montz, E.P. Hughey, L.M. Whiteford, M.P. Everist, C. Kelsey, and Ray Miller, with V. Blackman, A. Freidus, B. Hill, L. Jafarova, and A. Perett. 2005. Hurricane Charley: The aftermath, impacts and responses. Technical Report. Department of Geography, University of South Florida.
U.S. Census Bureau. 2004. Florida quick facts. http://quickfacts.census.gov/qfd/states/12000.html.
Winsberg, M., D.F. Zierden, and J.J. OBrian. no date. Climate of Florida. http://www.coaps.fsu.edu/climate_center/FLClimate.htm.


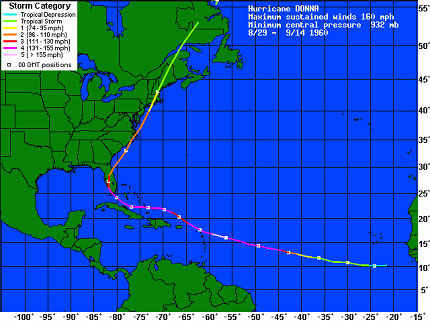
Figure 1. Path of Hurricane Donna. Source: http://www.wunderground.com/hurricane/at196005.asp
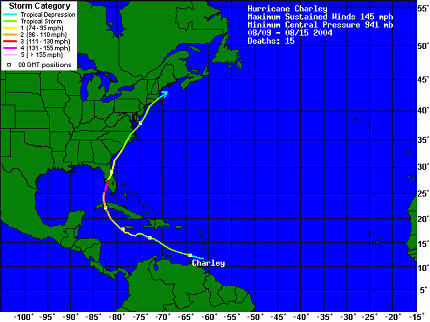
Figure 2. Tracking Map of Hurricane Charley. Source: http://www.wunderground.com/hurricane/at200403.asp
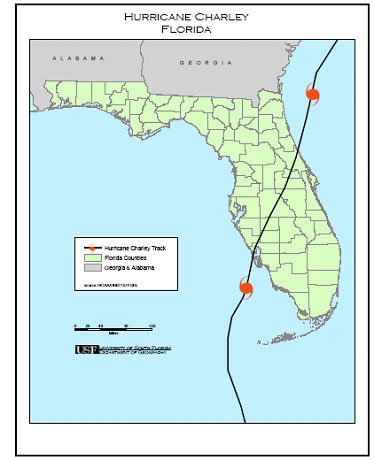
Figure 3. Hurricane Charley storm track through Florida. Source: Tobin et al., 2005
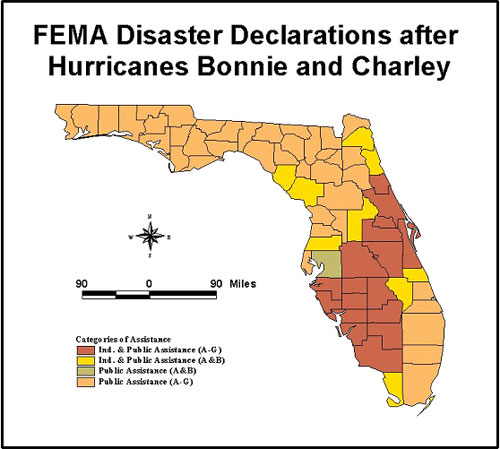
Figure 4. FEMA disaster declarations after Hurricanes Bonnie and Charley.
Source: http://www.gismaps.fema.gov/2004graphics/dr1539/dec_1539.jpg
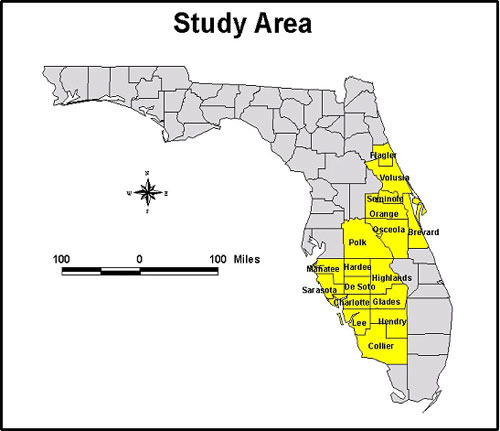
Figure 5. Study area.
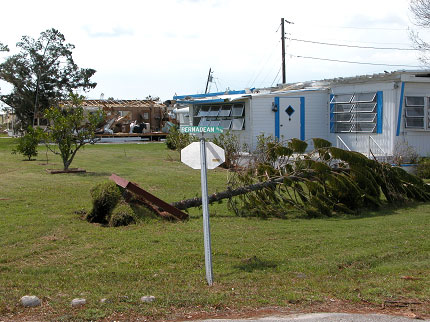
Figure 6. Differences in damage in Pine Acres.
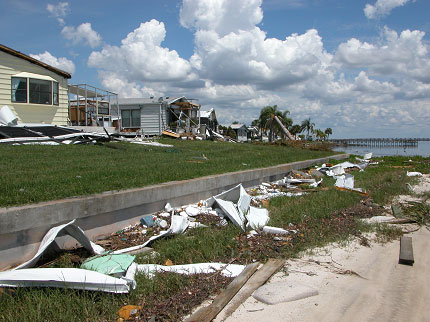
Figure 7. Harborview Parks location and damage.
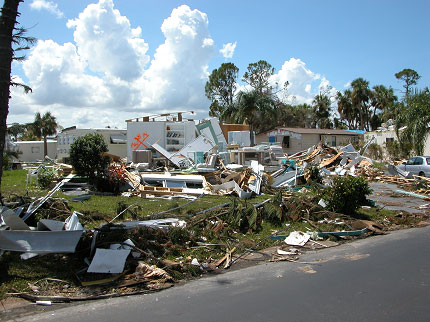
Figure 8. Differences in damage in Port Charlotte Village.
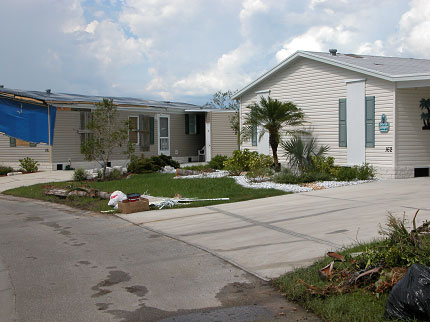
Figure 9. Lakewood Village.
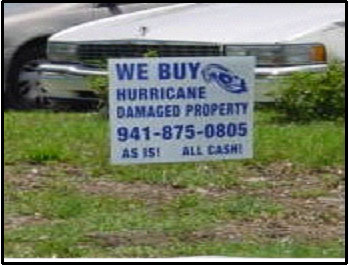
Figure 10. Example of demand for land in Florida.
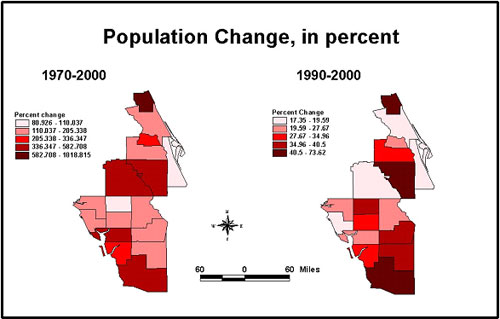
Figure 11. Population change, in percent.
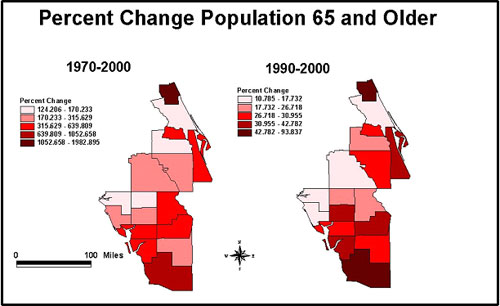
Figure 12. Percent change population 65 and older.
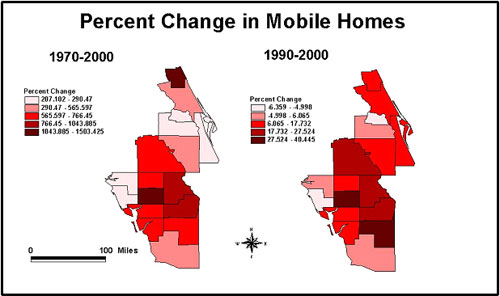
Figure 13. Percent change in mobile homes.