

Evacuation Behavior in Response to the
Graniteville, South Carolina, Chlorine Spill
Jerry T. Mitchell 2005
Andrew S. Edmonds
Susan L. Cutter
Mathew Schmidtlein
Reggie McCarn
Michael E. Hodgson
Hazards Research Lab
Department of Geography
Sonya Duhé
Hazards Research Lab
Department of Journalism and Mass Communications
University of South Carolina
A printable version of this QR report is available in pdf format.
This material is based upon work supported by the National Science Foundation. Any opinions, findings, and conclusions or recommendations expressed in this material are those of the author(s) and do not necessarily reflect the views of the National Science Foundation or the Natural Hazards Center.Citation: Mitchell, Jerry T., Andrew S. Edmonds, Susan L. Cutter, Mathew Schmidtlein, Reggie McCarn, Michael E. Hodgson, and Sonya Duhé. 2005. Evacuation behavior in response to the Graniteville, South Carolina, chlorine spill. Quick Response Research Report 178. Boulder, CO: Natural Hazards Center, University of Colorado. http://www.colorado.edu/hazards/qr/qr178/qr178.html.
This material is based upon work supported by the National Science Foundation (NSF)/Natural Hazards Center and a National Aeronautics and Space Administration (NASA) Earth Science Research, Education, and Applications Solution Network Cooperative Agreement (REASoN #NCC-1303008). Any opinions, findings, and conclusions or recommendations expressed in this material are those of the authors and do not necessarily reflect the views of the NSF, the Natural Hazards Center, or NASA.
Introduction
At 2:39 a.m. on the morning of January 6, 2005, a Norfolk Southern Railway freight train traveling from Macon, Georgia, towards Columbia, South Carolina, missed a switch and crashed into a parked locomotive in the town of Graniteville, South Carolina. Graniteville is located in western Aiken County approximately 10 miles from the Georgia/South Carolina border (see Figure 1). The collision ruptured one of the trains tank cars, which was carrying 90 tons of chlorine, sending a plume of chlorine gas across the northern portion of town. Four other tankers carrying chlorine, liquid sodium hydroxide, and liquid cresol derailed but did not rupture.(1) Nine people died as a result of injuries suffered from chlorine inhalation; more than 550 people sought medical assistance. A mandatory evacuation order was given at 2:30 p.m. to residents within a one-mile radius of the crash site. County officials estimated 5,400 residents evacuated that day and returned home one to two weeks later. The physical, psychological, and financial toll endured will remain with Graniteville area residents for some time to come.
Other communities have experienced similar accidents. Three deaths and 41 injuries occurred as the result of a train collision in Bexar County, Texas, in June 2004 (NBC5 2004; JAMA 2005). This accident involved chlorine as well as anhydrous ammonia. A train derailment near Minot, North Dakota, in January 2002 killed one person and injured more than 300 (NTSB 2002). Even the routine transfer of chlorine from the train to a storage tank can be threatening: at least 400 people were evacuated and 67 sought medical treatment near Festus, Missouri, in August 2002 following a leak (DNN 2002; JAMA 2005).
Like these other incidents, the Graniteville experience provided an opportunity to assess preparedness for and response to hazardous materials spills. This report provides the results from a mail survey of Graniteville area residents conducted February through April 2005 by the Hazards Research Lab in the Department of Geography at the University of South Carolina and details the ways that the media (local, regional, and national) framed the news event. The primary purpose of the study was to examine the evacuation behavior of residents. The lessons learned from the experiences of the affected residents will help improve preparedness efforts in the future. Additionally, this research will assist in our understanding of how people respond to extreme events and those factors that influence evacuation decision making.
Place and Event Background
Graniteville, South Carolina
Founded in the 1840s, Graniteville remains a rural textile mill village (see Figures 2 and 3). Early in its history, Graniteville was the largest mill in South Carolina, but today the textile-based community shows the effects of an industry that is declining in the American South. The factors that once made Graniteville an industrial giant in textilesnamely less expensive labor and proximity to raw materials and powerhave shifted in favor of manufacturing locations elsewhere in the United States and abroad.
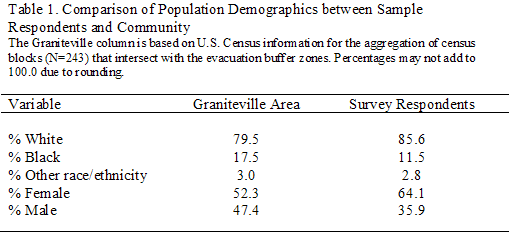
Because Graniteville is unincorporated, no census data specific to its political boundaries are available. Instead, we used aggregated census blocks (N=243) that intersect with the buffer zones (see Figure 4) to determine the demographic characteristics of the community. The demography of Graniteville is similar to that of many rural South Carolina towns in the Midlands region. Of the 7,112 residents (2000 Census), 80 percent are white and 18 percent are black while the remaining 2 percent are Hispanic or other ethnicities. Slightly more than half the population is female.
The community of Warrenville, also unincorporated and located just south of Graniteville across U.S. Highway 1, is included within these demographic tallies. Several blocks of this town were located inside the one-mile evacuation zone and many of the respondents to the survey were actually residents of Warrenville. Demonstrating a strong sense of individual community identity, some of these Warrenville respondents expressed dissatisfaction that the media consistently referred to the incident as a Graniteville disaster. While recognizing that this event affected Warrenville residents, we chose in this paper to refer to all descriptions and analyses as Graniteville-based.
The immediate area surrounding the crash site includes one census tract (204) and two of its block groups (001 and 002) (see Figure 4). The population in these areas is 2,483. Nearly 60 percent of the homes are single-family dwelling units with an even distribution of multifamily units (19.2 percent) and mobile homes (18.8 percent). The median house value ranges from $47,600 to $49,100. Approximately 68 percent of the housing stock was constructed prior to 1980. Renters make up 44 percent of the population in these two block groups. The largest age grouping is under age 18 (33 percent), and no other group exceeds 16 percent of the total population (U.S. Census 2000).
Abbreviated Event Time Line
The Graniteville crash story began on Wednesday, January 5, 2005. A complete, referenced time line is found in Appendix 1. Figures 5-10 illustrate the time line as well.
The Day Before: Wednesday, January 5, 2005
6:59 p.m. The crew who last used the sidetrack and parked a train on the spur went off duty. It was the responsibility of this crew to set the switch back to the main line.
Day 1: Thursday, January 6, 2005
2:40 a.m. Norfolk Southern Railway train #192 departing from Macon, Georgia, for Columbia, South Carolina, traveling at 45 miles per hour missed a switch and ran into the parked locomotive. Fourteen cars derailed. The train carried three chlorine gas cars, one liquid sodium hydroxide car, and one liquid creosol car. One tanker carrying 131 tons of chlorine was breached and immediately released 70 percent of its contents.
3:00 a.m. Sheriff Michael Hunt was notified of the accident.
3:45 a.m. South Carolina Emergency Management Division (SCEMD) was notified.
5:00 a.m. Media, hearing of the wreck on police scanners, began broadcasting news coverage.
5:09 a.m. The Emergency Alert System used by the SCEMD to alert media was activated and the message told residents to evacuate.
6:01 a.m. The National Weather Service weather band radio system was activated; radios emit a loud noise that could wake sleeping residents.
6:27 a.m. Reverse 911 was used to notify 3,600 homes with a shelter-in-place message. The shelter-in-place order was also given by local officials. Residents were told to turn off their air conditioning and heating systems.
12:00 p.m. Governor Mark Sanford issued Executive Order 2005-01, which declared a state of emergency for Aiken County.
2:30 p.m. All residents within one mile of the crash site were asked to evacuate by 6:00 p.m. Approximately 5,400 individuals evacuated, while 12 refused to leave. A two-mile radius curfew was in effect from 6:00 p.m. to 7:00 a.m.
4:004:30 p.m. An evacuation message was delivered via reverse 911.
Day 2: Friday, January 7, 2005
5:00 p.m. Updated hospital information: treated 200, admitted 53
Day 3: Saturday, January 8, 2005
4:00 p.m. Public safety officers began to distribute food and water to family pets, which could be seen from the roadway within the one-mile evacuation zone.
6:00 p.m. The dusk-to-dawn curfew changed from a two- to one-mile radius around the crash site.
Day 4: Sunday, January 9, 2005
12:00 p.m. The operations to transload 16,000 gallons of sodium hydroxide were completed.
5:00, 6:30, and 8:00 p.m. Crisis counseling town meetings were scheduled to be held at the Etheridge Center at the University of South Carolina Aiken.
Day 5: Monday, January 10, 2005
5:30 p.m. Mass care shelters were closed.
Days 6 and 7: Tuesday, January 11 and Wednesday, January 12, 2005
The liquid chlorine was removed from the tanker cars.
Days 8 thru 13: Thursday, January 13 though Tuesday, January 18, 2005
Graniteville residents returned in six phases.
Day 14: Wednesday, January 19, 2005
12:00 p.m. Residents remained displaced from an estimated 75 homes in the immediate area of the derailment. The Environmental Protection Agency would not permit residents of an estimated 50 homes to return to their residences until the chlorine transfer was completed and the derailment site was deemed safe.
3:00 p.m. The chlorine purging process was completed.
Day 19: Saturday, January 24, 2005
Governor Mark Sanford issued Executive Order 2005-03, which rescinded the state of emergency for Aiken County.
Day 24: Saturday, January 29, 2005
4:00 p.m. Norfolk Southern resumed train service through Graniteville.
Methods
Survey Design and Administration
To better understand how Graniteville area residents responded to the spill, two mail survey instruments were created. The two surveys measured the behavioral differences between two distinct groups: 1) those faced with a mandatory evacuation and 2) those who evacuated without an express directive to do so.
The first survey (the Evacuation Zone Survey) was sent to all households within the one-mile evacuation zone. This survey contained 33 questions about involvement with the event, evacuation decisions made, and basic demographics. A copy of this survey is available in Appendix 2 of this report. In addition to the survey mailing, a series of postcards were also mailed to residents reminding them to complete the initial survey if they had not already done so. These were mailed one week after the initial survey mailing.
An evacuation shadow refers to an evacuation by a group of people that were not required to evacuate. The second survey (the Shadow Zone Survey) was sent to all households between one and two miles from the crash site. This survey contained 35 questions. The difference between the two surveys was the inclusion of questions that asked why the respondent did or did not evacuate. A copy of this survey is available in Appendix 3 of this report. A series of follow-up reminder postcards were also mailed to these residents following the standard protocol for mail surveys (Dillman 1977).(2)
The sample population was derived from address databases. The lack of a single, comprehensive address database for Graniteville posed a challenge for the research team. It was necessary to blend three unique datasets acquired from three Aiken County departments: 1) a GIS-based boundary file that articulated the geographic extent of all the parcels in the county; 2) an electronic tax assessor table that provided owner information, including both property and mailing addresses; and 3) an electronic Emergency 911 (E911) table that contained resident address data.
At issue was the ability to derive an address database that inclusively contained all the residential properties of the Graniteville area, be they single-family residences or multiunit households located on a single parcel. The tax assessor table included one record for each parcel in the county but did not include a property address for every residence. The E911 table, conversely, offered less than 100 percent reporting of parcels but did include multiple records for individual phone numbers associated with any given parcel. This was vitally important for obtaining address information on unique households within apartment buildings and retirement communities.
The E911 table was the primary source utilized in the construction of the address database. The tax assessor table was used to fill in the coverage gaps, but this portion of the methodology was subject to minor caveats. For example, the tax assessor table contained many records for which there were no property addresses and some of the mailing addresses were out of state, thus they were eliminated from the sample. Additionally, care was taken to add in only those records that represented residential properties. Lastly, using published names and addresses in newspaper reports as a guide, the research team made an effort not to send surveys to residents whose family members had died during the event.
All identified residents in the Graniteville area were sent surveys. Initially, 2,727 surveys were mailed in early February 2005, 1,272 to the one-mile evacuation zone and 1,455 to the one- to two-mile shadow zone. A total of 497 surveys were undeliverable (erroneous address, etc.). Of the 2,230 surveys that could potentially be completed by residents, 526 were returned to the research team. The response rate for this initial mailing was 23.6 percent (526/2,230). Additional targeted mailings were made to reduce the undeliverable rate and improve responses from underrepresented groups.(3)
This iterative process resulted in a total of 610 returned surveys (for a total response rate of 22.1 percent). Eight of these surveys were incomplete or unusable, 27 were received from residents who were not in town at the time of the accident, and 9 were received in the months after the analysis was done. Therefore, the majority of the findings discussed within this report are based upon the responses of 574 households (or a 20.8 percent usable response rate). Based on this response rate, our confidence interval for the responses was +/- 3.64 percent at the 95 percent confidence level.
Data Entry and Analysis
Survey data were entered through April 30, 2005, into a customized Microsoft Access form and table. Contact data, if given by the respondent, were stored in a separate table from the survey answers so as to ensure the privacy of the participants. Quantitative and qualitative assessments of the responses were performed through a variety of methods. Descriptive statistics were derived within Microsoft Excel, Chi-square means testing was run within the SPSS (Statistical Package for Social Sciences) framework, and spatial analysis was executed with ArcGIS 9.0. Qualitative evaluation of the free-form questions on the survey instrument provided insight into the respondents opinions of the management of the incident. Some analyses and tests were performed on all 601 of the usable returned surveys, while the examination of spatial trends in evacuations were limited only to those surveys that could be matched to a known parceland whose residents were home at the time of the accident (thereby eliminating 24 and 27 surveys, respectively, from such inspection).
General Results
The results are provided in two distinct ways. The first is a descriptive narrative of the findings based on the overall responses to the survey instrument by our respondents. The second provides a more detailed analysis based on three specific research questions that drove the research.
Survey Population Demographics
Whites and females were overrepresented in our sample compared to the community as a whole (see Table 1). Nearly 86 percent of the respondents were white and 64 percent were female. Eighty percent of the female respondents were white females; white males represented 90 percent of the male responses. The median age (both genders) of respondents was 55 years old.
Fifty percent of the respondents had high school degrees. Eleven percent had less than a high school education, 31 percent had either a two- or four-year college degree, and 8 percent held a graduate degree.(4) Twenty-one percent of the respondents reported having someone in the household with special needs, although there was no elaboration on what special needs meant (e.g., wheel-chair bound, in need of medicine or home care, etc.). Home ownership was 81.7 percent. The average length of residence in Graniteville and Aiken County, South Carolina, was 30 and 41.5 years, respectively.
Learned about the Accident
The majority of respondents were in the area and at home when the derailment occurred. Most respondents first learned of the accident from family or friends (57.2 percent), but a sizeable number first learned about the accident from television (16.5 percent).(5) Interestingly, 19 percent of the respondents residing within the one-mile evacuation zone reported they saw, heard, or smelled the crash compared to 2.5 percent outside this zone.
Warnings
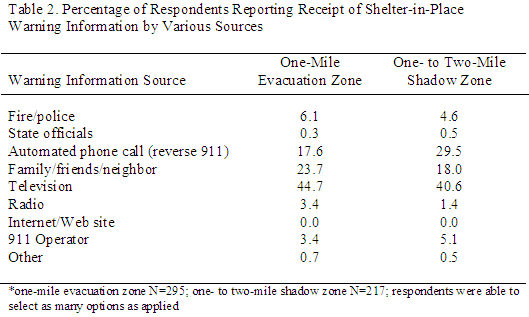
According to our time line, the reverse 911 was used to notify 3,600 homes with a shelter-in-place message around 6:30 a.m. on Thursday, January 6. This was the first use of the system since its installation a year earlier. Shelter-in-place orders were also given by local officials who told residents to turn off heating systems.
A number of the survey questions addressed warningshow respondents received them and from whom. More than three-fourths of the respondents (76.8 percent) received a message to stay in their home or work area until the danger passed (commonly known as sheltering-in-place). This was consistent among those within the one-mile evacuation zone and those in the one- to two-mile shadow zone. Most respondents reported receiving the message from television reports (41.8 percent), although a significant number reported receiving the information from emergency management officials (reverse 911 calling) (24.0 percent), or family/friends (21.5 percent). There were some differences between residents in the one-mile evacuation zone versus those in the one- to two-mile shadow zone (see Table 2) in terms of the source of the warning. In particular, the reverse 911 notifications were more dominant in the one- to two-mile shadow zone than closer to the accident site, while family/friends were more dominant within the one-mile evacuation zone.
Evacuation Decision Making and Timing
At noon on Thursday, January 6, South Carolina governor Mark Sanford issued Executive Order 2005-01 declaring a state of emergency for Aiken County. At 2:30 p.m. an evacuation order was given for a one-mile buffer surrounding the crash site asking all residents within the affected zone to evacuate by 6:00 p.m. A curfew (lasting from 6:00 p.m. to 7:00 a.m.) was put into effect within a two-mile radius of the site. From 4:00 p.m. to 4:30 p.m., the evacuation message was delivered to affected residents through reverse 911 calls.
Eighty-three percent of the respondents in the one-mile evacuation zone reported receiving a message to evacuate. The primary source of the evacuation message was fire/police officials (35.3 percent). A sizeable number of respondents within the one-mile evacuation zone stated they were told to evacuate by television news broadcasts (26.1 percent), reverse 911 phone calls (12.9 percent), or family/friends (13.1 percent). While the official evacuation order was targeted to residents in the one-mile evacuation zone, respondents within the one- to two-mile shadow zone also thought the mandatory evacuation order was directed at them and 54 percent of these respondents said they received a message to evacuate. The primary sources of the evacuation message for this group were reverse 911 phone calls (25.9 percent), fire/police officials (25.3 percent), and television news reports (23.5 percent).
Evacuation Behavior
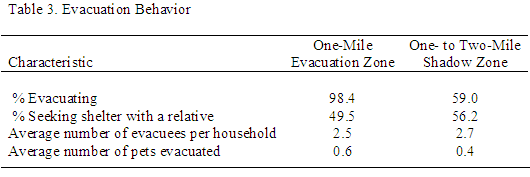
Seventy-six percent of the respondents evacuated in response to the accident. As expected, this percentage was much higher in the one-mile evacuation zone (98.4 percent) than in the one- to two-mile shadow zone (59 percent) (see Table 3). For the majority of our respondents, the chlorine spill was their first experience with a mandatory evacuation order. Most of the evacuees left on Thursday, January 6: 98.7 percent in the one-mile evacuation zone and 93.4 percent in the one- to two-mile shadow zone. For all responding households, the mean number of people who evacuated was 2.56. However, within the one-mile evacuation zone, the average number of evacuees per household was 2.5, while in the one- to two-mile shadow zone, the average number of people evacuated per household was slightly higher at 2.7. Historically, the presence of pets in the household has been shown to reduce compliance with mandatory evacuation orders. For our respondents, 30.8 percent evacuated with a pet. In 30 instances, households with multiple pets left one or more of the pets at home while evacuating the others. Dogs outnumbered cats in terms of evacuated species. This trend reflects other studies (Heath and Voeks 2000) that acknowledge the relative ease of evacuating dogs over cats. On Saturday, January 8, public safety officials distributed food and water to family pets left behind within the one-mile evacuation zone. Also, Aiken County Animal Control began a retrieval operation for domestic pets (at the request of owners) and brought them to the local high school where they were reunited with their owners.
Local emergency management officials controlled the reentry for evacuated residents in phases based on air quality and surface tests completed by the Environmental Protection Agency and the South Carolina Department of Health and Environmental Control. The first evacuees began returning home one week after the accident. By January 24, nineteen days after the accident, nearly all residents were home and the state of emergency was rescinded by Governor Sanford.
Shelter Options and Choices
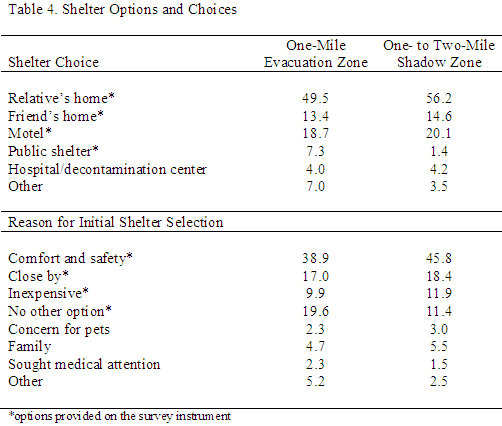
In most mandatory evacuations within the United States, the use of public shelters by evacuating residents is the least-preferred option. Whether it is in response to a hurricane or chemical spill, research has shown time and time again that evacuees seek shelter with family/friends or in private accommodations and only use public shelters as the last resort (Phillips 1993; Tierney 1988). Our results were consistent with these findings.
Four emergency shelters were opened by 6:00 p.m. on Thursday, January 6: the University of South Carolina (USC) Aiken, First Baptist Church in Aiken, Midland Valley High School, and South Aiken High School. Decontamination units were also set up at USC Aiken and at Midlands Valley High School. Most of our respondents sought shelter with relatives (52 percent). Interestingly, there were few differences between those in the mandatory evacuation zone and those outside it (see Table 4). The one exception was the use of public sheltersresidents from the evacuation zone were more likely to use them than residents from the shadow zone.
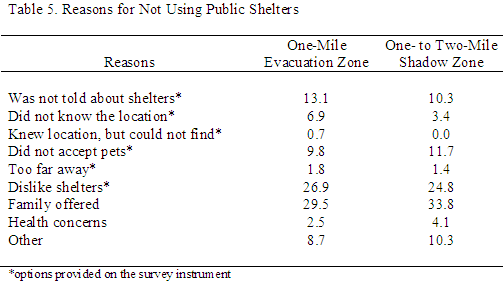
Only 6 percent of our respondents used the public shelters. This was consistent with the time line where all mass care shelters were closed on day 5 (only 107 people used the shelters), even though residents did not begin returning home until three days later. More important, Norfolk Southern was providing housing and financial assistance directly to the evacuees. To assess their reluctance to use mass care facilities, the respondents were asked their reasons why they did not go to a public shelter (see Table 5). The majority replied that other family members offered to take them in (32 percent). The other answers were dislike for shelters (25.5 percent), not told about shelters (12.0 percent), pets not allowed (10.3 percent), and did not know the location or could not find it (6.4 percent). There were some differences between those from the one-mile evacuation zone and those from the one- to two-mile shadow zone. Of particular interest for local emergency management officials is the response from residents in the evacuation zone who felt they did not know the location of the public shelterssomething that could be remedied in the future with additional public information notices. Health concerns were another interesting reason for non-use of public shelters. This could reflect the 26.5 percent of our respondents who replied that there was a household member with special needs, although this was not explained in any further detail.
Accident Impacts
One report stated that 529 people had been treated in local hospitals (JAMA 2005). Approximately 18.6 percent of our respondents sought medical attention, but there was a wide discrepancy between those within the one-mile evacuation zone and those outside of it. Of the respondents from the one-mile evacuation zone, 28.7 percent reported seeking medical attention compared to 7 percent of the respondents from the one- to two-mile shadow zone.
As residents returned home, they were advised to clean all floors and horizontal surfaces as well as kitchen utensils, pots, pans, and the outsides of canned food containers. It was suggested that all food (except canned goods) be discarded. Residents were also told to replace heating and air conditioning filters. This information was distributed through public information fact sheets. Also, the South Carolina Department of Health and Environmental Control and the Environmental Protection Agency conducted inspections of homes when requested by residents. Inspections were requested by approximately 125 residents (SCEMD 2005). Nearly three-quarters of our respondents within the one-mile evacuation zone (75.5 percent) reported having their home inspected, compared to only 15.2 percent of those respondents from the one- to two-mile shadow zone.
Detailed Results
Three primary research questions provided the focus for this project:
- Were there disparities in the timing and execution of the evacuation order based on location, the demographic characteristics of residents, or the risk?
- Was there an evacuation shadow produced beyond the mandatory one-mile evacuation zone?
- How did the media coverage of the event amplify the perception of risk and/or evacuation behavior, and how did local, regional, and national news media frame the event (normal accident vs. catastrophe)?
The background to and description of each of these questions are described in detail in the following sections.
Evacuation Disparities
There were some initial news reports of the accident and the evacuation that some groups were given priority during the evacuation (Augusta Chronicle 2005; Brundrett 2005; WIS-TV 2005), a charge that was denied by the Aiken County Sheriffs Office.(6) We were interested in potential disparities in evacuation timing and execution based on location, demographic characteristics, or the risk itself.
Location
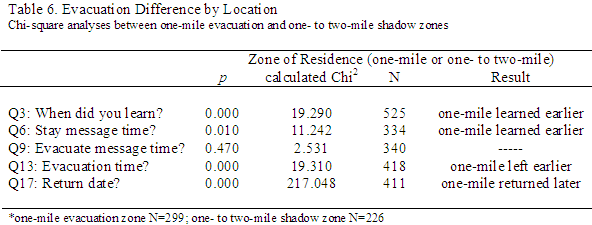
The two locationsthe one-mile evacuation zone and the one- to two-mile shadow zonewere compared for differences regarding the timing of first learning of the event, notification to stay or leave, evacuation timing, and the return date of the respondent if they evacuated. Relationships between variables for the two zones were explored with Chi-square analyses (see Table 6).(7) The timing of when the residents first learned about the accident was different between the two zones, and the differences were statistically significant. Respondents in the one-mile evacuation zone learned of the accident earlier than respondents in the one- to two-mile shadow zone. The timing of the message to shelter-in-place was also significantly different between the two groups: those in the mandated evacuation zone received the warning earlier than those in the shadow zone. However, when the evacuation message was delivered, there were no differences in the timing of the message based on location. There were, however, locational differences in when residents evacuated and when they returned home and these were also statistically significant. Respondents in the one-mile evacuation zone evacuated earlier than respondents in the one- to two-mile shadow zone and returned home later. These findings indicated generally (and not surprisingly) that those living closest to the crash site learned of the accident sooner (witnessed it or were told of it), received messages to shelter-in-place earlier, and in fact, evacuated earlier as well. These same respondents also returned to their homes later as those neighborhoods closest to the crash site were reopened last.
Demographics
A variety of demographic characteristics were available for investigation. Regarding the time of evacuation, it should be noted that the mean evacuation times did not differ significantly by family size, the presence of special needs residents, level of education, or gender. Furthermore, of these demographic factors, only the level of education appears to have influenced the return date: more educated respondents returned home earlier, on average.
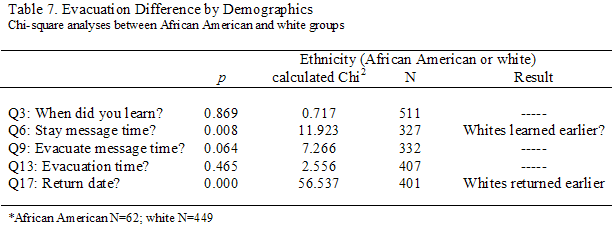
Race and ethnicity (here represented by white or African American) was also explored. Graniteville, like many communities nationwide, has a pattern of residential locations that follow racial groupings rather than factors such as family size, gender, or level of education. As such, the findings were related more to location than actual racial differences between the two social groups. Relationships between variables for the two groups were explored with Chi-square analyses (see Table 7). There was no reported difference between respondents on when they first learned about the accident. However, there were some reported differences on when the groups received the shelter-in-place message. White respondents indicated that they received a message to shelter-in-place earlier than the time indicated by African American respondents, and this difference was statistically significant. Collectively, white respondents reported receiving the message at the average time of 6:00 a.m., while African American respondents reported receiving the message to stay in place at the average time of 6:15 a.m.
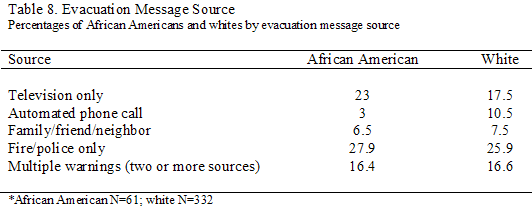
There was a weaker (p=.064), but still statistically significant, difference between white and African American residents in terms of when they reported that they were told to evacuate their homes. White residents reported on average that their evacuation message was received at 4:00 p.m.; African Americans reported this message was received, on average, at 4:30 p.m. What accounts for this difference is not fully clear, as the message sources did not vary appreciably between the two groups (see Table 8).(8) The one exception was the number of respondents in the African American group that reported receiving a reverse 911 phone message (3 percent compared to whites at 10.5 percent).
There were no statistically significant results between white and African American residents in terms of when they actually did evacuate. There were, however, significant differences between the groups on the timing of their return. White respondents indicated that they returned home earlier than African American respondents (see Figure 11). Several of the census blocks closest to the crash site had higher numbers of African American residents. As such, these neighborhoods would have reopened later, thus explaining the later return of these respondents as compared to white respondents.
Risk
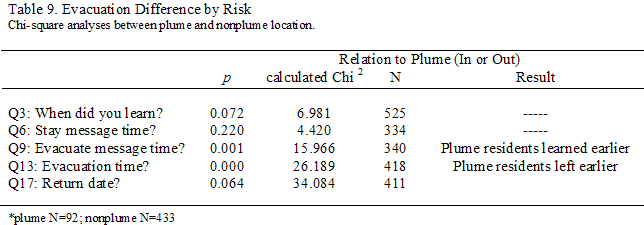
The evacuation zone for the accident was a one-mile buffer drawn around the crash site. The risk of exposure to the chlorine cloud, however, was not uniform across this space due to local topography and wind conditions at the time of the accident. A plume model was developed by the Atmospheric Technologies Group at the Savannah River National Laboratory to visualize the Graniteville area most likely exposed (see Figure 12). Presumably, the chlorine exposure risk would be higher within the area covered by the plume. This model has limited utility since deaths from the accident did occur outside the plume boundaries. However, it does provide a risk representation, albeit a coarse one, that improves on the one-mile buffer designation. As done previously, relationships between variables for the two zones were explored with Chi-square analyses (see Table 9).
There were significant differences between the two zones in terms of receiving an evacuation notice and when residents evacuated. Respondents in the plume zone learned of the evacuation time message earlier than respondents in the nonplume zone. Respondents in the plume zone also evacuated earlier than respondents in the nonplume zone.
Overall, it appears that plume respondents learned of the accident and the evacuation time message earlier than nonplume respondents. They also evacuated earlier. This is not meant to suggest that plume respondents were officially or purposely targeted earlier by authorities. Awareness of the event came from many sources other than official emergency warnings (e.g., witness, television, phone calls from family). The mean return times were also significantly different between the two zones; however, the respondent return date apparently had more to do with the neighborhood reentry time as determined by authorities than location in or out of the plume.
Evacuation Shadow
Achieving the appropriate response to an evacuation order is complex for a variety of reasons. A message must be concise, clear, and also take into consideration the characteristics of the receivers as well (e.g., different languages, etc.). A common problem is underresponse, whereby people remain in harms way. This may result from miscommunication, a lack of trust in the source, or past experience with an event, among other reasons. Also troublesome is an overreaction to an evacuation order. This generates the evacuation shadow. There is ample evidence to suggest that this occurred in Graniteville, and to a much larger extent than in some other disaster areas.
Evacuation shadows have been identified in a variety of events, including the Three Mile Island nuclear incident in Pennsylvania (1979) and Hurricane Andrew (1992) (Tierney et al. 2001). It is possible that evacuation shadows may be more likely with technological disasters such as the one in Graniteville. The uncertainty associated with exposure to chemical or radiological agents may prompt an overflight response in the public compared to a normally understood threat, such as a flood. It is also possible, and very likely the case in Graniteville, that the overresponse is due to a misunderstanding of ones location in relation to the delimited evacuation zone.
An optimistic view of the evacuation shadow would observe that with more evacuees fewer casualties would result. While possibly true, the evacuation shadow presents a number of harmful consequences. For example, higher than expected traffic volume will slow evacuation times. This excessive congestion may also prevent the truly threatened population from leaving. Additional infrastructure, such as hotels and shelters, may not be able to accommodate an unnecessary influx of evacuees.
Ninety-three percent of the respondents living within the one- to two-mile shadow zone indicated that they were in the Graniteville area at the time of the accident. A very large percentage of these59 percentindicated that they evacuated the immediate area. While a dusk to dawn curfew was in effect for the first three days, no evacuation order was in place for the one- to two-mile shadow zone. Why then did these people leave the area?
The factors that convinced these residents to evacuate the area are shown in Figure 13. The most common answers (with the number of responses) were mandatory order (20 percent), threat to family was high (20 percent), situation was getting worse (14 percent), and advice of family/friend (11 percent). Respondents were allowed to check as many factors as were applicable. Given that there was no mandatory order for their area, why is that reason cited as a frequent motivator to leave? Two possibilities include an erroneous message or a misunderstanding of local geography. First, several messages were received. Some areas were told to shelter-in-place and then evacuate later. Other areas had curfews. Without clear direction, some residents may have chosen to just leave rather than place their trust, and lives, in those who may be just as uncertain as to what was occurring. Second, it is highly probable that residents did not know where they were in relation to the accident site and its accompanying mandatory evacuation order. Without a map or extensive local knowledge, residents could not determine where the crash site was located and how far their home was from that site. A sample of responses from the one- to two-mile shadow zone indicated that this indeed was the case:
We were in the curfew area but the publication (maps on television news) of the curfew area was confusing. It seemed to cover more than the radius area. The medical help to victims seemed to go well, but we did not need anything. We just stayed out of the area.
DID NOT EVACUATE
I wanted to see more mapped details of streets w/in 2 mi. radius on TV.
DID NOT EVACUATE
We live just outside of the one mile radiuswe were not clear of the exact boundariesbut when we leftwe could not get back in. I called 911 several times and they were always very helpful to tell us when we might be able to go back home.
DID EVACUATE
The mile radius evacuation announcement should have included the names of the streets. We were inside the police barricade, but knowbody [sic] called us. We called news channel 12 and they told us that if nobody knocked on our door or reverse 911, then we did not need to evacuate. We called Norfolk Southern and they told us to leave. If they would have included street names in the announcement it would have saved us hours of indecision.
DID EVACUATE
When the evacuation automated call came we were not sure if we were in the one mile. It took way too long to find out where we were to the radius of the 1 mile. Basically we were waiting (packed) for someone to knock on the door & say go! We measured a map and figured we were just outside the edge by a few hundred feet.
DID EVACUATE
We should have evacuated a lot sooner because me being alone, had get things together & put in plastic bags. If I had known I was on the one-mile zone I could have been prepared. If anything ever happens again, there should be an accurate address given in the warnings. The TV announcers were not at all familiar with Graniteville and this being so serious someone should have told them. They did not, obviously, know one thing about the street names.
DID EVACUATE
Residents were also not aware of the direction of the plume; some in the one- to two-mile shadow zone (in hindsight) were clearly at more risk than others. The residents in the shadow zone who chose not to evacuate indicated that they stayed because they were not in the evacuation zone (31 percent), not in danger (23 percent), or followed advice from television (12 percent) (see Figure 14). There was no noticeable evacuation decay across the shadow zone. In other words, evacuees at the one-mile border were as likely to evacuate as those at the two-mile border. There were nonevacuees at the one-mile border and evacuees at the two-mile border. Conflicting messages, confusion about ones location in relation to the most dangerous areas, and uncertainty or fear related to the consequences of exposure all likely played a role in amplifying the Graniteville evacuation shadow.
Media Coverage
The final research question explored how the news media framed the Graniteville accident. Public relations practitioners, local and state officials, and other sources helped shape the news of this event. Generally, it appears that the media turned to victims, residents, and volunteers as primary news sources. Law enforcement and local and state officials came second. Statements from experts, as well as those from the railroad, receded into the background.
The investigation of Graniteville media coverage in its first days took a case study approach. Just who were the initial sources of information and what points of view did they represent? How well were the voices of experts, officials, and stakeholders (ranging from railroad representatives to victims to environmental groups) represented in the news?
To conduct our case study of the Graniteville train wreck, with particular emphasis on sources behind the messages, the researchers gathered and analyzed local newspaper coverage from the two most prominent local newspapers for the week following the incident. A source was defined as any identified person (or occasionally a publication) quoted directly or indirectly in a news story. This information was supplemented with analysis of survey data from area residents, Norfolk Southern press releases, review of national media coverage, and television data provided by a video clipping service. The newspapers, chosen for their proximity to the accident site, were the Aiken Standard (from Aiken, South Carolina) and the Augusta Chronicle (from nearby Augusta, Georgia). We were especially interested in the sources in the stories. Who was communicating about the incident?
Voices in the News
News routines follow predictable patterns, even in disasters (Hornig and Templin 1992; Hornig, Walters, and Templin 1991). The sources given voice in news accounts of the wreck are the reflection of news processes, public relations activities, and other information subsidiesall processes and practices that shape the news. These processes are often heavily influenced by the availability of sources, especially official spokespeople for government.
In disaster situations, a variety of expert voices may be called on to interpret events if they can be contacted on short notice, but victims and observers provide compelling narrative choices. Regardless of how well Norfolk Southern, local and state officials, and various others did or did not handle their public communication efforts, local news outlets responded with their own priorities and in proportion to their own resources and contacts, and some voices were much more prominent in local news accounts than others. Because local television coverage is often difficult to access after the incident occurs, for the purposes of this analysis, newspapers provided the most complete and accessible record of which voices appeared most often in the news. By analyzing sourcing patterns in the two papers published closest to Graniteville, the Aiken Standard and the Augusta Chronicle, some perspective can be gained on how news systems respond to local disasters.
The story was treated as major news with intense local coverage that nevertheless varied from paper to paper and from day to day. Given the closure of the accident site and the surrounding evacuation area, journalists did not have the kind of access they might have liked. A news command center was set up in a parking lot outside the perimeter of the prohibited area. Press briefings were held in both Aiken, South Carolina (population about 26,000, approximately 5 to 6 miles from Graniteville), and nearby Augusta, Georgia (population about 195,000, approximately 15 miles from Graniteville). Each of these communities has a separate newspaper likely to be read by Graniteville residents. According to comments by journalists covering the story, briefings at the two locations were not always coordinated and were not always announced in advance, compounding the journalists difficulties in covering a story the location of which was not accessible to them.
The Aiken Standard
The nearby Aiken Standard newspaper ran a total of 89 separate stories with identified sources in the seven days following the event that included 253 references to specific named sources. But Norfolk Southern representatives, although appearing in Aiken Standard news stories on six out the first seven days, accounted for only 11 (about 4 percent) of those 253 references (see Figure 15). Expert voices from local university scientists and national agencies such as the National Transportation Safety Board were equally scarce, also accounting for only about 4 percent, even though two university scientists were quoted on the first day (probably reflecting the proximity of the University of South Carolina branch campus at Aiken). Elected state officials, perhaps predictably, appeared on day one in slightly greater numbers and then disappeared again until later in the week (see Figure 16), accounting for about 6 percent of sources for the seven-day period.
In short, while elected state officials, representatives of the railroad company, and transportation and safety experts appeared in the news, their presence was dwarfed by that of other groups, in particular local residents and volunteers, who formed about 32 percent of the total, and law enforcement and other local and state officials, who made up 24 percent. Voices from hospitals, health care, and the school system accounted for roughly 19 percent of the total sources, while local businesspersons accounted for around 11 percent. Of the 27 business sources other than Norfolk Southern, 7 were attorneys; the others had most often been interviewed for their comments on the accidents local impact.
As Figure 16 illustrates, Norfolk Southerns presence was consistent from the first day, but never prominent. Aiken Standard journalists concentrated on local sources, especially comments from residents, but also those from local officials, including law enforcement, and from hospital, school, and business spokespersons. By the end of the week, sourcing patterns in the Standard seemed to reflect a community already anxious to get back to normal routines, wondering when they could go home, when their kids would be back in school, and when local business would return to normal. While descriptions of funeral services and speculation about lingering health effects continued, the voices of local residents and local officials had already begun to recede.
The Augusta Chronicle
Presumably reflecting a larger urban base and greater staffing, the Augusta Chroniclealthough it ran only 39 stories on the wreck during the first week of coverage, less than half the number run in the Aiken Standardused a richer variety of sources (see Figure 17). While about one-third of the Chronicles sources were residents and volunteers, almost the same proportion as in the Standard, the Chronicle included proportionately more experts (17 percent vs. 4 percent), and these included both union and environmentalist spokespersons, which were entirely missing from the Standard. Though somewhat less prominent in actual numbers (7 vs. 11 appearances), Norfolk Southern sources were a larger proportion of the Chronicles coverage (13 percent vs. 4 percent). The Chronicles coverage was less dominated by local and state officials and local law enforcement than the Standards. While neither paper seemed to engage in much explanation or blaming, the inclusion of these additional voices lent a more analytical tone without diminishing the prominence of industry spokespersons trying to get their own message across.
Geographically further from the scene of the event, the Augusta coverage was much less focused on individual stories of rescues, injuries, deaths, and funerals, lost animals, the evacuation and subsequent curfew, and the impact on students, teachers, and local businesses than the Aiken coverage. It also took longer to reach its peak intensity (see Figure 18), possibly allowing more time for research. While it might be debated which type of coverage best served the readers of each area, clearly the Aiken coverage reflected journalists deeply embedded in a local story in their own community, while the Augusta coverage was more diverse and (impressionistically) more reflective. Additional voices were heard in the Chronicle, providing perspective from the point of view of environment and health and safety spokespersons as well as from that of railroad spokespersons. Differences between the sourcing patterns in the two papers were likely also reflective of press briefing locations and simple transportation logistics. Local officials were proportionately more prominent in Aiken and South Carolina state politicians were more so in Augusta.
Television Coverage and the Bigger Media PictureAs soon as television news stations heard of the incident, they converged on the emergency command center where officials were gathered. Data from Metromonitor Clipping Service indicated that on day one of the incident, there were more than two hundred news stories from television stations across the United States. The majority of the stories, 136 news stories on January 6, aired in the area around Graniteville, including the Augusta and Savannah, Georgia, television news markets; the Columbia, South Carolina, television news market; and other television news markets in the Georgia, South Carolina, and North Carolina area.
From January 6 to February 6, some 1,459 local television news stories aired about the Graniteville incident from those markets in Georgia, South Carolina, and North Carolina closest to the incident. Data also showed that there were 72 news stories on just the first day of the incident alone from other stations across the United States: from New Orleans, Louisiana, to Portland, Oregon. Five network news stories aired during that same time period.
Preliminary analysis of the television news reports showed the enormous impact the incident immediately had upon the area. Topping the television news headlines on that first day of breaking news was the accident, the spill associated with the accident, and the number of deaths, injuries, and closings due to the incident. There also appeared to be confusion about whether residents should stay in or leave their homes.
The event received extensive print coverage in Columbia, South Carolinas, The State and other regional papers, such as the Atlanta Constitution, and was the subject of a limited number of national stories in the New York Times, the Los Angeles Times, and other national print and broadcast media. Analysis continues regarding the extent to which coverage varied among these larger outlets as distance from the event increased, losing local color but perhaps gaining perspective and the resources for further investigation and more extensive use of sourcing, a pattern already visible in the two local papers examined here.
Whether areas of the country more experienced with this particular type of disaster produced better coverage remains to be seen. Nevertheless, almost certainly, the prominence of this particular event will fade. And while it may touch off a flurry of journalistic attention to train safety more generally, it is already being redefined as a normal accident (Perrow 1984), a cost of doing business both to Norfolk Southern and to the mill workers who depend on the railroad for their living. Eventually, it is almost inevitable that critical attention will recede in a typical issue-attention cycle pattern (Downs 1972).
The sheer volume of newspaper and television news stories alone reveals the impact the Graniteville train incident had on its community, as well as areas far from the site of the train wreck. What is important to note is who the voices behind those news stories belonged to. Who did the media turn to for answers in what is being called one of the worst train accidents since the 1970s?
The results of this research question indicated that during times of crisis, particularly in this event, the media look for those most affected by the incident. Findings from this research were consistent with the recommendation from the literature that suggests journalists should concentrate on the victims, residents, and other ordinary people. Clearly, researchers found that of all the sources covered by both newspapers, local residents and volunteers were cited the most (in more than one-third of the stories).
However, it may very well be that what the public most needed during the incident were voices from expertsthose who know the details and can weigh the risks. Yet, experts (defined as representatives of universities, professional and environmental organizations, and national agencies such as the National Transportation Safety Board) accounted for less than 1 in 5 sources of the stories in the Augusta Chronicle and only about 1 in 25 in the Aiken Standard. Expert sources in the Chronicle were (proportionately) nearly three times as common as in the Standard, yet still, voices from experts only accounted for 17 percent of the sources in that newspaper. Even Norfolk Southern, the owner of the freight train involved in the incident, was only quoted in 4 percent of the Aiken Standard articles and in 13 percent of the Augusta Chronicle articles.
It is interesting to note that perhaps in the Graniteville incident, local law enforcement who manned the command center were considered the most authoritative of voices. Local law enforcement did account for 24 percent of the Aiken Standard sources, following just behind residents and volunteers; while accounting for 13 percent of the Augusta Chronicle sources. In cases of health emergencies, and the Graniteville incident would certainly fit into that category, literature would also support the observation that news executives would look to law enforcement authorities first for information.
Local media did an extraordinary job with this local story, but the end result was coverage in which information about the scientific, medical, and environmental dimensions was difficult to find. Stories of injuries and deaths and the plights of victims, information on logistical issues relevant to the situations of evacuees, and even reports about missing pets seemed far more visible. The public relations efforts of Norfolk Southern also followed good professional practice but were hard to hear above the babble of other competing voices.
Conclusion
This research project focused on the evacuation behavior and media response following the Graniteville train accident of January 6, 2005. Treating the three research questions in turn, we found the following:
- Evacuation disparities did exist based upon location. Residents within the one-mile evacuation zone evacuated earlier and returned home later. This result was expected.
- Notification disparities were also seen. Many residents within the one-mile evacuation zone reported that they did not receive the reverse 911 notification. These systems errors must be investigated. Additionally, the problem of reaching residents with telephone land lines remains, especially given the ubiquitous nature of cell phones.
- Considerable confusion existed regarding ones location in respect to the one-mile evacuation zone. Residents did not know if the evacuation message was applicable to them personally. Future evacuation notices must include not only the general evacuation area but specific landmarks or street names to indicate precise boundaries. Additionally, the arbitrary declaration of a one-mile evacuation zone bears scrutiny. The use of the North American Emergency Response Guide suggests an altogether different evacuation area under the conditions experienced.
- There were a few differences in the timing and execution of the evacuation order in terms of household demographics. Most of these disparities can be related to location. Others cannot be fully explained, especially since the social groups in question indicated that their information sources were virtually identical.
- A substantial evacuation shadow did occur. This suggests an area of opportunity to sharpen risk communication strategies.
- Local and regional media coverage of the event was extensive; national coverage was more limited both in print and on television. Local coverage emphasized personal stories over expert interviews. Event coverage, especially by papers more removed from the accident site, began to frame the event as a normal accident, just another product of our time that is to become more expected.
These findings are but a few of many other lessons that might be derived from these survey responses. In addition to these issues, another lingering question remains: how many residents actually evacuated? The 5,400 person figure, while oft-reported, does not appear to have any factual basis. Its origin is also unknown. Using the responses in this research as a guide, it is possible to estimate a more accurate figure.
A conservative estimate of total evacuees is 3,980. This estimate was derived by utilizing population statistics for those census blocks whose centers lie within the one-mile and one- to two-mile zones and assumed an evacuation rate of 98 percent and 59 percent in the one-mile evacuation zone and the one- to two-mile shadow zone, respectively. A higher estimate may be derived by considering the population statistics for those census blocks in which any portion of their area lay within the one-mile and one- to two-mile zones. This figure is 5,835 and likely exaggerated. Neither of these estimates, of course, documents evacuees from outside the two-mile crash site perimeter.
The importance of accurate evacuee estimates is clear. To underestimate the scope can translate into inadequate resource allocation, both in terms of physical needs and personnel. An overestimate can lead to wasted resources. Importantly, an overestimate also can lead to faulty assumptions when faced with future accidents. For example, too many public shelters may lead to underusage at some sites. This observation could then translate into a belief that shelters are not useful, leading to a discontinuation of their use in the future.
The evacuation from Graniteville does appear, however, to be above the norm. Exceptionally high evacuation rates, especially by those not required to do so, were observed and likely confounded the ability to calculate a more accurate evacuee figure.
An interesting final note: despite the loss of life and the resultant community upheaval from the accident, when asked if they had any additional comments to offer about the event, 67 percent of the respondents had only positive observations about the handling of the incident. Graniteville residents appear poised to look ahead. Hopefully, their experiences and observations can lead us toward proactive measures that mitigate the effects of hazardous material spills when they happen again.
Footnotes
(1) The National Transportation Safety Board estimates that 60 tons were released.
(2) Written IRB (institutional review board) approval for the survey was received from the University of South Carolina on April 8, 2005.
(3) Many of the undeliverable mailed surveys were due to users of post office boxes as opposed to street mail delivery. To reach this group of residents, 531 surveys were hand delivered to the Warrenville Post Office. These surveys were placed in each post office box. A total of 63 surveys were returned from this group, a response rate of 11.9 percent. A second mailing was made in March 2005 to increase the number of responses from African American residents. Census blocks with majority African American populations were retargeted; 211 surveys were mailed. These were not new mailings but rather a second opportunity for residents in those areas to respond. An additional 20 surveys were returned (9.5 percent response rate). The total number of potential respondents was 2,761.
(4) Several respondents checked high school and graduate degrees without any intervening education. These respondents were tallied as high school graduates only.
(5) While many residents learned of the accident from family/friends, it is not known how their sources learned of the event, be it television, radio, or other witnesses.
(6) One survey respondent made a similar charge.
(7) Five of the questions posed on the survey were concerned with eliciting responses of time and date. We were interested in determining exactly when residents learned of the accident, were instructed to shelter-in-place, were instructed to evacuate, actually did evacuate, and returned to their homes. Though the survey instrument encouraged an identification of date and time, respondents were free to answer these questions with as much accuracy as they wished. Many recorded their actions to the minute; others, naturally, left questions blank if, for example, they had not evacuated. For the purpose of statistical analysis of the first four questions, only those responses with complete date and time answers were considered. We then categorized the remaining answers into four groups:
- Prior to 6:00 a.m. on January 6, or the approximate wake-up time for most people
- Between 6:00 a.m. and noon on January 6, at which point the governor declared a state of emergency
- Between noon and 6:00 p.m. on January 6, when residents were required to evacuate the one-mile evacuation zone
- After 6:00 pm on January 6
If the responses to the fifth question regarding the return date included a time element they were aggregated simply to the day of reentry. Chi-square analysis was performed between various segments of the population to ascertain if there were any statistically significant differences in the timing of the message, their evacuation, or their return. Such analysis utilized the four artificial categories of time as a basis for making these determinations.
(8) There is evidence to suggest that these differences between white and African American responses were not factual but rather based upon faulty recall. Survey respondents were asked to recall, in some cases many weeks later, at what time a message was received. Several respondents were very precise, but these answers appear inaccurate. For example, several respondents reported receiving the phone evacuation message at 2:30 p.m., 3:30 p.m., or 4:00 p.m. This is not possible as the reverse 911 message was sent at 4:21 p.m. These response errors clearly skew the average times that the two demographic groups reported receiving this message.
References
Augusta Chronicle. 2005. Officials respond to cries of bias during evacuation. January 19, 2005. http://aiken.augusta.com/stories/011905/new_3130227.shtml.
Brundrett, R. 2005. Blacks say they were left until last. The State. January 18, 2005. http://www.thestate.com/mld/thestate/news/special_packages/10669304.htm.
Dillman, D. 1977. Mail and telephone surveys: The total design method. New York: John Wiley and Sons.
Disaster News Network. 2002. Chlorine leaks in Missouri. August 14, 2002. http://www.disasternews.net/news/news.php?articleid=1522.
Downs, A. 1972. Up and down with ecology: The issue attention cycle. The Public Interest 28:38-50.
Heath, S.E., and S.K. Voeks. 2000. A study of pet rescue in two disasters. International Journal of Mass Emergencies and Disasters 18 (3): 361-82.
Hornig, S., L. Walters, and J. Templin. 1991. Voices in the news: Newspaper coverage of Hurricane Hugo and the Loma Prieta earthquake. Newspaper Research Journal 12 (3): 32-45.
Hornig, S., and L. Walters. 1992. Faces in the news: Network television news coverage of Hurricane Hugo and the Loma Prieta earthquake. Journal of Broadcasting & Electronic Media 36 (2): 219-32.
Journal of the American Medical Association (JAMA). 2005. Public health consequences from hazardous substances acutely released during rail transitSouth Carolina, 2005; selected states, 1999-2004. Journal of the American Medical Association 293 (16): 1968-72.
NBC5. 2004. Railroad train engineer dies in freight train collision: Trains collide, spill toxic fumes. June 28, 2004. http://www.nbc5i.com/news/3468055/detail.html.
National Transportation Safety Board (NTSB). 2002. NTSB to examine Minot, North Dakota hazmat release at July public hearing. June 28, 2002. http://www.ntsb.gov/Pressrel/2002/020628.htm.
Perrow, C. 1984. Normal accidents: Living with high-risk technologies. New York: Basic Books.
Phillips, B.D. 1993. Cultural diversity in disasters: Sheltering, housing, and long term recovery. International Journal of Mass Emergencies and Disasters 11:99-110.
South Carolina Emergency Management Division (SCEMD). 2005. Graniteville train wreck situation report #13. West Columbia, South Carolina: South Carolina State Emergency Operations Center.
Tierney, K. 1988. Social aspects of the Whittier Narrows earthquake. Earthquake Spectra 4:11-23.
Tierney, K., M. Lindell, and R. Perry. 2001. Facing the unexpected: Disaster preparedness and response in the United States. Washington, DC: Joseph Henry Press.
U.S. Census. 2000. http://www.census.gov/.
WIS-TV. 2005. Some Graniteville residents say whites given priority during chlorine evacuation. January 19, 2005. http://www.wistv.com/Global/story.asp?S=2826722.
Note: All figures and photographs were created by the authors and the Hazards Research Lab unless otherwise noted.
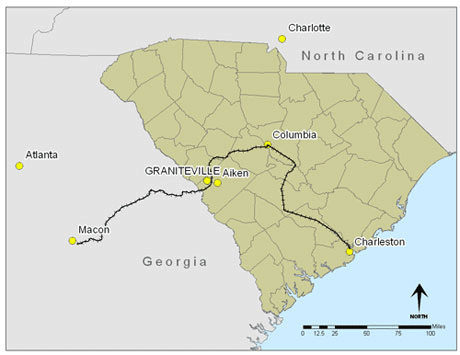
Figure 1. Graniteville location: Graniteville is a small, unincorporated town approximately 10 miles from the South Carolina and Georgia border.
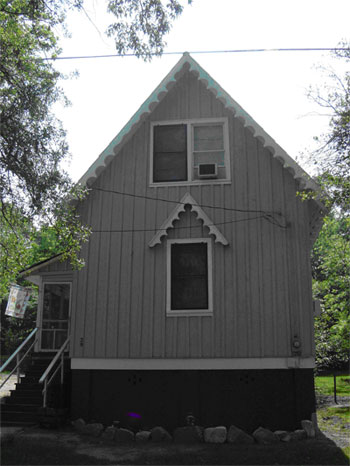
Figure 2. Graniteville mill house: Graniteville is known for its small and distinctive mill housing architecture. Note the peaked roof and ornamental eaves.
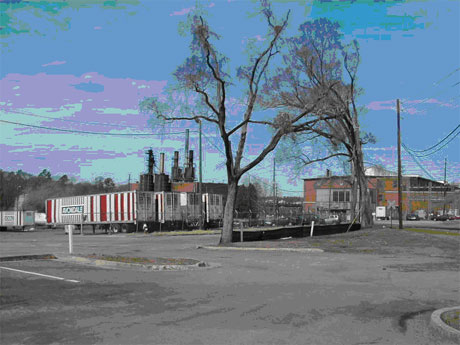
Figure 3. Graniteville textile industry: The textile industry remains the communitys economic focus as it has since the 1840s.
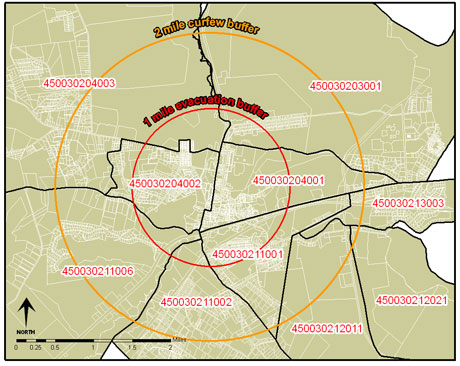
Figure 4. Graniteville area census block groups: Census tract 204 and block groups 001 and 002 were adjacent to the crash site.
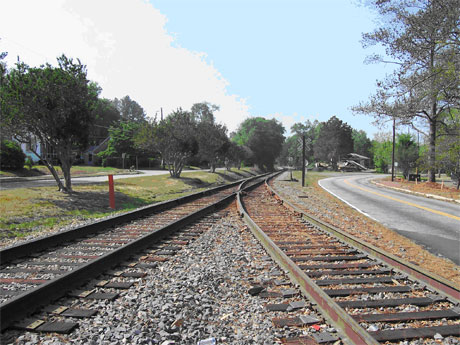
Figure 5. Graniteville derailment site: The train was to travel north through Graniteville on the main line (left track). A missed switch sent the train onto the right-hand spur and into a parked locomotive. The photo looks toward the south.

Figure 6. Rail switch: It was the responsibility of the crew who used the side track to set the switch back to the main line.
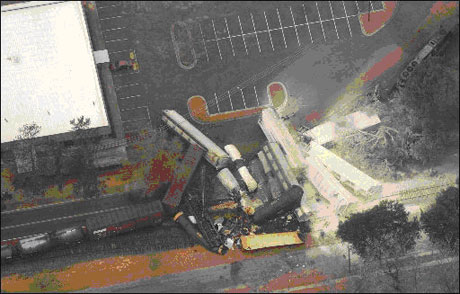
Figure 7. Train derailment: The Columbia, South Carolina, bound train failed to continue on the main track (bottom), veered left onto the side track, and collided with a parked locomotive. Source: Andrew Davis Tucker, Augusta Chronicle
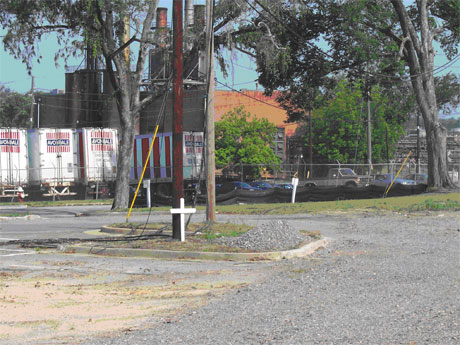
Figure 8. Crash site: One of the few event commemorations, a small cross marks the crash site between the factory and the main street.
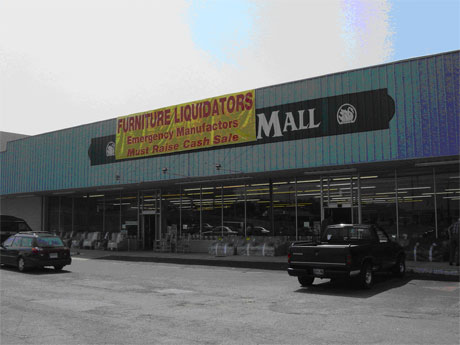
Figure 9. Emergency operations: An abandoned retail storefront served as the emergency operations center. A furniture liquidator filled the space a few weeks later.
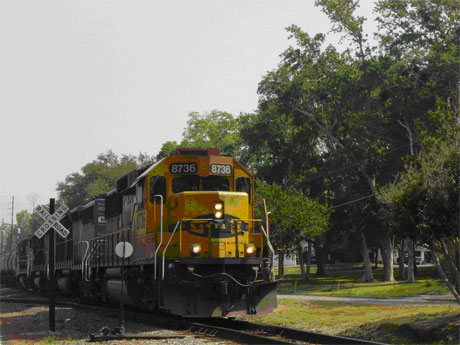
Figure 10. Graniteville rail traffic: Norfolk Southern resumed train service through Graniteville on January 29, 2005, at a reduced speed of 25 miles per hour (whereas previouslyand at the time of the crashtrains traveled at 45 miles per hour).
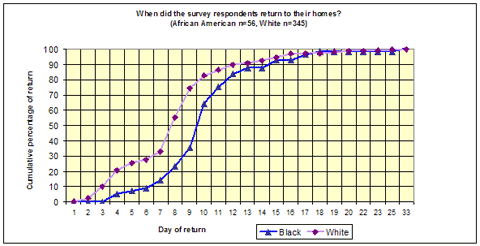
Figure 11. Respondents return home: Differences between white and African American respondents.
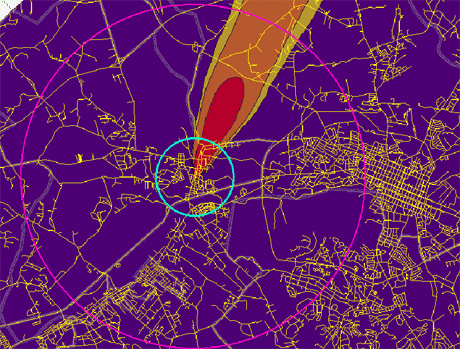
Figure 12. Graniteville chlorine plume. Source: Atmospheric Technologies Group, Savannah River National Laboratory; map generated by the Hazards Research Lab.
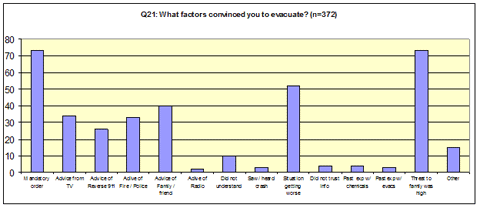
Figure 13. Evacuation decision factors.
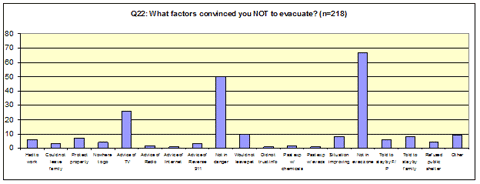
Figure 14. Nonevacuation decision factors.
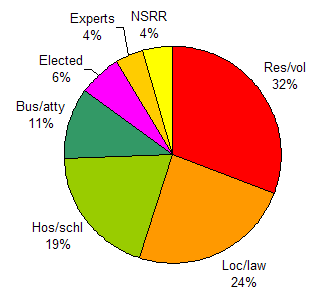
Figure 15. Aiken Standard distribution by source: Source distributions, first seven days after the wreck (January 7-13, 2005) for Aiken Standard articles. Chart reflects number of references during the week to residents or volunteers (including clergy); local and state officials and law enforcement (including firefighters); hospital or school representatives (including other health care workers and teachers); local businesses other than the railroad company (including attorneys and insurance representatives); elected state officeholders; experts from universities, professional and environmental organizations, and national agencies; and Norfolk Southern spokespersons.
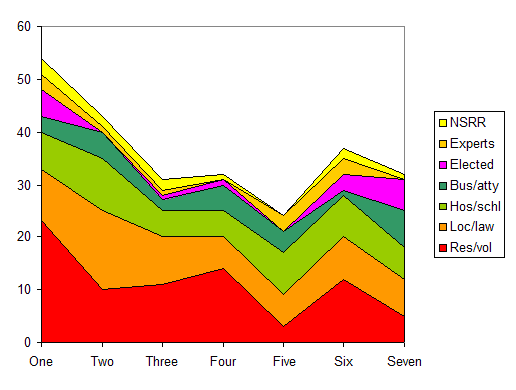
Figure 16. Aiken Standard sourcing distribution by day: Source distributions, days one (January 7) through seven (January 13) after the wreck for Aiken Standard articles.
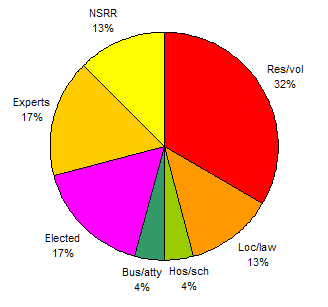
Figure 17. Augusta Chronicle distribution by source: Source distributions, first seven days after the wreck (January 7-13, 2005) for Augusta Chronicle articles.
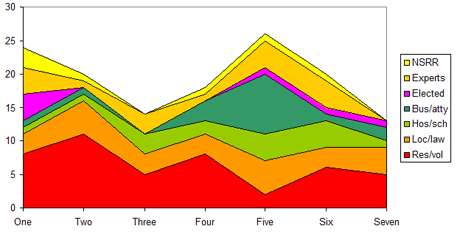
Figure 18. Augusta Chronicle sourcing distribution by day: Source distributions, days one (January 7) through seven (January 13) after the wreck for Augusta Chronicle articles.
Appendices
Appendix 1: Complete Event Timeline
The Day Before: Wednesday, January 5, 2005
6:59 p.m. The crew who last used the side-track and parked a train on the spur went off duty. It was the responsibility of this crew to set the switch back to the main line.(1) Norfolk Southern later fired these three workers for failing to perform their duties properly.(2)
No other trains passed through the area between then and the wreck early the following morning.(3)
Day 1: Thursday, January 6, 2005
2:40 a.m. Norfolk Southern Railway train #192 departing from Macon, Georgia, for Columbia, South Carolina, and traveling at 45 miles per hour, missed a switch and ran into the parked locomotive.(4,5,6) Fourteen cars derailed. The train carried three chlorine gas cars, one liquid sodium hydroxide car, and one liquid creosol car.(4,5) One tanker carrying 131 tons of chlorine was breached and immediately released 70 percent of its contents.(7)
2:50 a.m. Workers at Avondale Mills on the night shift turned off machines and gathered in a back room; some 500 workers abandoned the mill after the gas smell got too strong (time approximate). Five of these workers were among the deceased.(8)
3:00 a.m. Sheriff Michael Hunt was notified of the accident.(9)
3:30 a.m. About 45 rescue workers from two counties set up a decontamination center at the University of South Carolina (USC) Aiken.(10)
3:45 a.m. South Carolina Emergency Management Division (SCEMD) was notified.(5)
5:00 a.m. Media, hearing of the wreck on police scanners, began broadcasting news coverage.(11)
5:09 a.m. The Emergency Alert System used by the SCEMD to alert media was activated(12) and the message told residents to evacuate.
5:30 a.m. The Aiken County Emergency Operations Center (EOC) was activated.(5)
6:01 a.m. The National Weather Service weather band radio system was activated; radios emit a loud noise that could wake sleeping residents.(12)
6:27 a.m. Reverse 911 was used to notify 3,600 homes with a shelter-in-place message, which was the first use of the system for an emergency since its installation about a year earlier.(12) The shelter-in-place order was also given by local officials. Residents were told to turn off their air conditioning and heating systems.(4)
8:00 a.m. The state EOC was activated at OPCON (operating condition) 1.(5) Atmospheric Technologies Group at the Savannah River National Laboratory produced its first plume model.(13) The toxic gas primarily flowed through town in a northeasterly direction but, because of chlorines heavy weight, also descended southwesterly toward lower elevations and against the prevailing winds.(14)
10:15 a.m. The Norfolk Southern train manifest arrived on the scene (exact time approximated but not certain).(5)
11:50 a.m. A refrigerated truck was deployed from Maudlin, South Carolina, to Aiken.(5)
12:00 p.m. Governor Mark Sanford issued Executive Order 2005-01, which declared a state of emergency for Aiken County.(15)
2:30 p.m. All residents within one mile of the crash site were asked to evacuate by 6:00 p.m. Approximately 5,400 individuals evacuated, while 12 refused to leave.(16) A curfew was in effect for a radius of two-miles around the crash site from 6:00 p.m. to 7:00 a.m.(5)
3:58 p.m. Norfolk Southern submitted a train derailment report to the National Response Center.(17)
4:00-4:30 p.m. An evacuation message was delivered via reverse 911.(18)
Shelters opened at USC Aiken, First Baptist Church in Aiken, Midland Valley High School, and South Aiken High School.(5)
Norfolk Southern Railway opened its local assistance center to serve local residents who incurred a loss, inconvenience, or personal injury as a result of the accident. The center was located at the First Presbyterian Church in Aiken before being moved (on January 20) to the former Community Services Building on Ascaugua Lake Road in Graniteville.(19,20)
The Salvation Army was available to provide meals; no residents were yet sheltered at 5:00 p.m. on January 6.(5)
The Federal Aviation Administration set up a restricted flight area 3,000 feet high and 5 miles around the accident site at the request of the South Carolina Law Enforcement Division.(5)
Those who were exposed were told to report to decontamination units set up at the gym at USC Aiken or at Midland Valley High School. Two tents were set up at USC Aiken. In one tent, people exposed to the chemicals removed their clothes and were washed down. They then moved to a second tent where they were given medical attention. Some people were sent to the hospital.(4)
Four area schools were closed: Warrenville Elementary School, Leavelle-McCampbell Middle School, Byrd Elementary School, and Midland Valley High School. Aiken County Career and Technology Center, Freedman Parenting Center, and Aiken Tech also closed.(4)
There were nine casualties:(21,22)
- 2 victims in the Gregg Division Plant
- 1 truck driver found in the cab of his parked truck beside the plant
- 1 train engineer, who died at Aiken Regional Medical Center
- 1 victim at the Stephens Steam Plant
- 1 victim died in a home on Main Street
- 1 victim at the Woodhead Division Plant entrance
- 2 victims in woody, swampy area behind the plant
There is some ambiguity about the hard sequencing of evacuation events:
- The earliest reports of evacuation orders show up in documents marked 6:00 a.m.(4)
- The shelter-in-place order for the two-mile radius is in a 4:00 p.m. report.(7)
- WIS-TV reported around 5,000 people evacuated approximately 12 hours after the crash (around 3:00 to 4:00 p.m.); the rest of town was under curfew and needed proof of residence to enter the curfew area.(23)
- Residents near the crash were originally told to shelter-in-place then, later that afternoon, told to evacuate. Black residents said they were not evacuated as quickly as white residents; the Sheriffs Office denied this.(24,25,26) No one actually interviewed the white residents mentioned in The State article to see if they had been given an evacuation order or if they left on their own.
Day 2: Friday, January 7, 2005
11:00 a.m. At the request of the Aiken County Sheriffs Office, Norfolk Southern contractors ceased operations to allow for search and rescue around the crash site and in adjacent mill buildings.(27)
5:00 p.m. Updated hospital information: treated 200, admitted 53(28)
- Aiken Regional Medical Center, Aiken South, Carolina: treated 53, admitted 20
- Lexington Medical Center, West Columbia, South Carolina: treated 5, admitted 5
- University Hospital, Augusta, Georgia: treated 80, admitted 14
- Medical College of Georgia, Augusta, Georgia: treated 30, admitted 14
- Doctors Hospital, Augusta, Georgia: treated 30
- St. Josephs Hospital, Augusta, Georgia: treated 2
The South Carolina Department of Health and Environmental Control (DHEC) personnel discovered a large fish kill at Horse Creek. They estimated that 1,800 yards of the creek were affected.(29)
Day 3: Saturday, January 8, 2005
7:3011:30 a.m. Norfolk Southern contractors again ceased operations to allow for completion of the search and rescue operations.(30)
4:00 p.m. Public safety officers began to distribute food and water to family pets, which could be seen from the roadway within the one-mile evacuation zone. Aiken County government implemented a plan to enable citizens in the affected area to arrange for the care and removal of their pets. Citizens could call Aiken County Animal Control to schedule an animal control officer to retrieve their dog, cat, or other domestic animal and bring it to Midland Valley High School.(30)
6:00 p.m. The dusk-to-dawn curfew was changed from a two- to one-mile radius around the crash site.(31)
Day 4: Sunday, January 9, 2005
12:00 p.m. The operations to transload 16,000 gallons of sodium hydroxide were completed.(32)
4:00 p.m. Five Environmental Protection Agency (EPA) air monitors were set in place.(32)
5:00, 6:30, and 8:00 p.m. Crisis counseling town meetings were scheduled to be held at the Etheridge Center at USC Aiken.(32)
Day 5: Monday, January 10, 2005
5:30 p.m. Mass care shelters were closed.(33)
10:30 p.m. Operations at the site were suspended and personnel were evacuated when hand-held sensors indicated a high level of natural gas after a manhole cover was lifted near the incident sight. Further investigations indicated that areas underneath adjacent manhole covers were negative for natural gas.(34)
Day 6: Tuesday, January 11, 2005
4:30 p.m. The removal of liquid chlorine from the north tanker car was completed.(35)
6:00 p.m. DHEC and the South Carolina Department of Natural Resources announced that approximately 1,000 dead fish were noted in Langley Pond. Norfolk Southern was tasked with the cleanup.(35)
6:00 p.m. The EPA deployed a total of 25 monitoring stations around the incident site.(35)
Day 7: Wednesday, January 12, 2005
1:10 a.m. The transfer of chlorine from the second car began.(36)
9:30 a.m. A permanent patch was placed on the damaged tanker.(37)
2:10 p.m. The liquid chlorine transfer from the second tanker car was completed.(37)
The EPA and DHEC conducted air quality and surface testing at LeavelleMcCampbell Middle School and Byrd Elementary School. The Aiken County School District successfully ran a complete check of all electrical, plumbing, computer, and alarm systems. A professional service cleaned all floors and horizontal surfaces, kitchen utensils, and pots and pans. All food, except unopened canned goods, was discarded and replaced with fresh food. Heating and air conditioning filters were replaced.(18)
Day 8: Thursday, January 13, 2005
8:30 a.m. Phase I of resident returnApproximately 50 percent of Graniteville residents (about 2,000, according to the EPA summary) were allowed to return to their homes. Public service announcements (30- and 60-second spots) detailing food handling and general housekeeping tips were aired on all local television stations prior to and during residents return. Included neighborhoods were Trolley Line Road and Laurel Drive to Gregg Highway, all homes west of Ergle Street; and all homes south of Highway 421. All homeowners in all phases of the return were required to show proof of residency at traffic control points. The air in each return phase was shown to be safe.(38)
2:30 p.m. A burp of chlorine from the vapor transfer process on the tanker car occurred. A spike of 0.7 parts per million was recorded on EPA monitor #4, and work was stopped in the area. Personnel within the 300 yard exclusion zone were evacuated.(39)
Day 9: Friday, January 14, 2005
7:00 a.m. All HAZMAT personnel were demobilized.(39)
8:30 a.m. Phase II of resident returnAn estimated 1,500 Graniteville residents living in the following areas began returning to their homes: Quimby Town: Granite Drive to Fourth Street, including Marshall Street to Canal Street; Taylor Street and Kalmia Apartment Drive to Gregg Highway.(18)
Animal control officers reunited 287 pets with their owners. Aiken County Animal Control reported six pets died after being returned to their owners.(18)
Day 10: Saturday, January 15, 2005
8:30 a.m. Phase III of resident returnMore Graniteville residents living in the following areas began returning to their homes: south and west of Mount Arthur Drive, Bethlehem Circle, Elbert Street, Hewitt Street, Mack Lane east of Aiken Road, Cherry Lane, Davis Road, Laurel Avenue, Pine Street, south of Mack Lane between Church Street and Aiken Road, Shazach Lane, Blowing Wind Terrace, south and east of Brooks Street, south of Seastrunk Street to Gregg Street, A.P. Nivens Street, south of Arbute Street, Gregg Street south of A. P. Nivens Street, Hope Lane, Polatty Street, Canal Street south of Arbute Street, Baker Street, south of AikenAugusta Highway.(18)
Day 11: Sunday, January 16, 2005
8:30 Phase IV of resident returnGraniteville residents living in the following areas began returning to their homes: south of Seastrunk Street, north and south side of Hester Lane. Since Thursday, an estimated 4,200 people returned home.(18)
Day 12: Monday, January 17, 2005
8:30 a.m. Phase V of resident returnGraniteville residents living in the following areas began returning to their homes: east of Gregg Street, north of Seastrunk Street, south of Taylor Street. Since Thursday, an estimated 4,500 people returned home.(18)
4:00-6:00 p.m. LeavelleMcCampbell Middle School and Byrd Elementary School held open houses to give interested parents the opportunity to inspect the facilities.(18)Day 13: Tuesday, January 18, 2005
8:30 a.m. Phase VI of resident returnGraniteville residents living in the following areas began returning to their homes: Canal Street to Gregg Street, Taylor Street to Cottage Street. Businesses along Main Street, south of Gentry Street, were allowed to reopen.(18)
Day 14: Wednesday, January 19, 2005
12:00 p.m. Residents remained displaced from an estimated 75 homes in the immediate area of the derailment, the area bordered by Canal Street, Gregg Street, Seastrunk Street, and Cottage Street. Residents living within this area were invited to call Aiken County Planning and Development to schedule a free inspection of their homes plumbing, electrical, and mechanical systems.(18) Home inspections were scheduled as follows:
- Wednesday, January 19: Canal to Gregg Streets; Seastrunk to Gentry Streets
- Thursday, January 20: Canal to Gregg Streets; Gentry Street to Aiken Road
- Friday, January 21: Canal to Gregg Streets; Aiken Road to Cottage Street
The EPA would not permit residents of an estimated 50 homes to return to their residences until the chlorine transfer was completed and the derailment site was deemed safe. This affected residents living in an area bordered by Canal Street, Gregg Street, Gentry Street, and Cottage Street.(18)
3:00 p.m. The chlorine purging process was completed. Air monitoring readings of 0.0 parts per million were detected at the intake and outtake of the railcar. A hole was cut in the tank to allow Norfolk Southern contractors to pressure wash the railcar. The railcar was to be loaded onto a flatcar and transported to Augusta, Georgia, prior to departure to Altoona, Pennsylvania, where it was to be impounded, subject to further investigation by National Transportation Safety Board (NTSB). Prior to the completion of the chlorine transfer, the EPA provided oversight to Norfolk Southern contractors during all off-loading operations.(18)
Day 19: Saturday, January 24, 2005
Governor Mark Sanford issued Executive Order 2005-03, which rescinded the state of emergency for Aiken County.(18)
Day 24: Saturday, January 29, 2005
4:00 p.m. Norfolk Southern resumed train service through Graniteville. Six trains per day were allowed to travel through town at a reduced speed of 25 miles per hour (whereas previouslyand at the time of the crashtrains traveled at 45 miles per hour).(41)
Time Line Sources
(1) The State, January 7, 2005, A1, There was some error made
(2) The State, February 5, 2005, A1, Crew of parked train fired in wake of crash
(3) The State, January 9, 2005, A9
(4) Environmental Protection Agency Region 4, January 6, 2005, Situation report #1
(5) South Carolina Emergency Management Division, January 6, 2005, Situation report #1
(6) The State, January 16, 2005, A1
(7) Environmental Protection Agency Region 4, January 6, 2005, Situation report #2
(8) The State, January 7, 2005, Yall got to get off this floor!
(9) WRDW-TV
(10) The State, January 7, 2005. What in the hell is going on?
(11) Schurz Communications, Inc., May 13, 2005, Hazardous chemical spill puts WAGT News team to the test
(12) The State, January 16, 2005, A1, It is unknown whether earlier alert could have saved lives
(13) Savannah River National Laboratory, January 2005, SRNL Atmospheric Technologies Group plays important role in Graniteville emergency eesponse
(14) American Meteorological Society, March 2005, Chapter news
(15) South Carolina Governors Office, January 6, 2005, Executive Order 2005-01
(16) Aiken County Sheriffs Office, Fact sheet: Graniteville train derailment 01/06/05 9:00pm
(17) National Response Center, 2005 National Response Team incident summaries
(18) David Ruth, Aiken County Emergency Preparedness Coordinator, January 31, 2005, personal correspondence
(19) Norfolk Southern Railway, January 6, 2005, Norfolk Southern opens Aiken accident assistance center
(20) Environmental Protection Agency Region 4, January 21, 2005, Final information update as of January 21, 2005
(21) The State, January 8, 2005, A5, Graniteville train wreck -- the victims
(22) WIS-TV, January 10, 2005, All Avondale Mills employees accounted for, funerals continue after leak
(23) WIS-TV, January 7, 2005, Authorities say Graniteville evacuation order extended to at least Wednesday
(24) WIS-TV, January 19, 2005, Some Graniteville residents say whites given priority during chlorine evacuation
(25) The State, January 18, 2005, Blacks say they were left until last
(26) Augusta Chronicle, January 19, 2005, Officials respond to cries of bias during evacuation
(27) Environmental Protection Agency Region 4, January 8, 2005, Situation report #4
(28) Federal Emergency Management Agency, January 7, 2005, Graniteville South Carolina train collision and derailment
(29) Aiken County Sheriffs Office, Fact sheet: Graniteville train derailment 01/07/05 5:00pm
(30) Aiken County Sheriffs Office, Fact sheet: Graniteville train derailment 01/08/05 4:00pm
(31) Aiken County Sheriffs Office, Fact sheet: Graniteville train derailment 01/08/05 9:00pm
(32) South Carolina Emergency Management Division, Situation report #6
(33) South Carolina Emergency Management Division, Situation report #7
(34) Environmental Protection Agency Region 4, January 11, 2005, Situation report #7
(35) South Carolina Emergency Management Division, January 11, 2005, Situation report #9
(36) South Carolina Emergency Management Division, January 12, 2005, Situation report #10
(37) South Carolina Emergency Management Division, January 12, 2005, Situation report #11
(38) South Carolina Emergency Management Division, January 13, 2005, Situation report #12
(39) South Carolina Emergency Management Division, January 13, 2005, Situation report #13
(40) South Carolina Governors Office, January 24, 2005, Executive Order 2005-03
(41) Augusta Chronicle, February 3, 2005, Trains get back on Granitevilles tracks
Appendix 2: Evacuation Zone Survey
Available in pdf format only.
Appendix 3: Shadow Zone Survey
Available in pdf format only.