The 2013 Colorado Floods
An Overview of the Flood Event: How Much Rain Fell on the Front Range, and How Historic Was It?
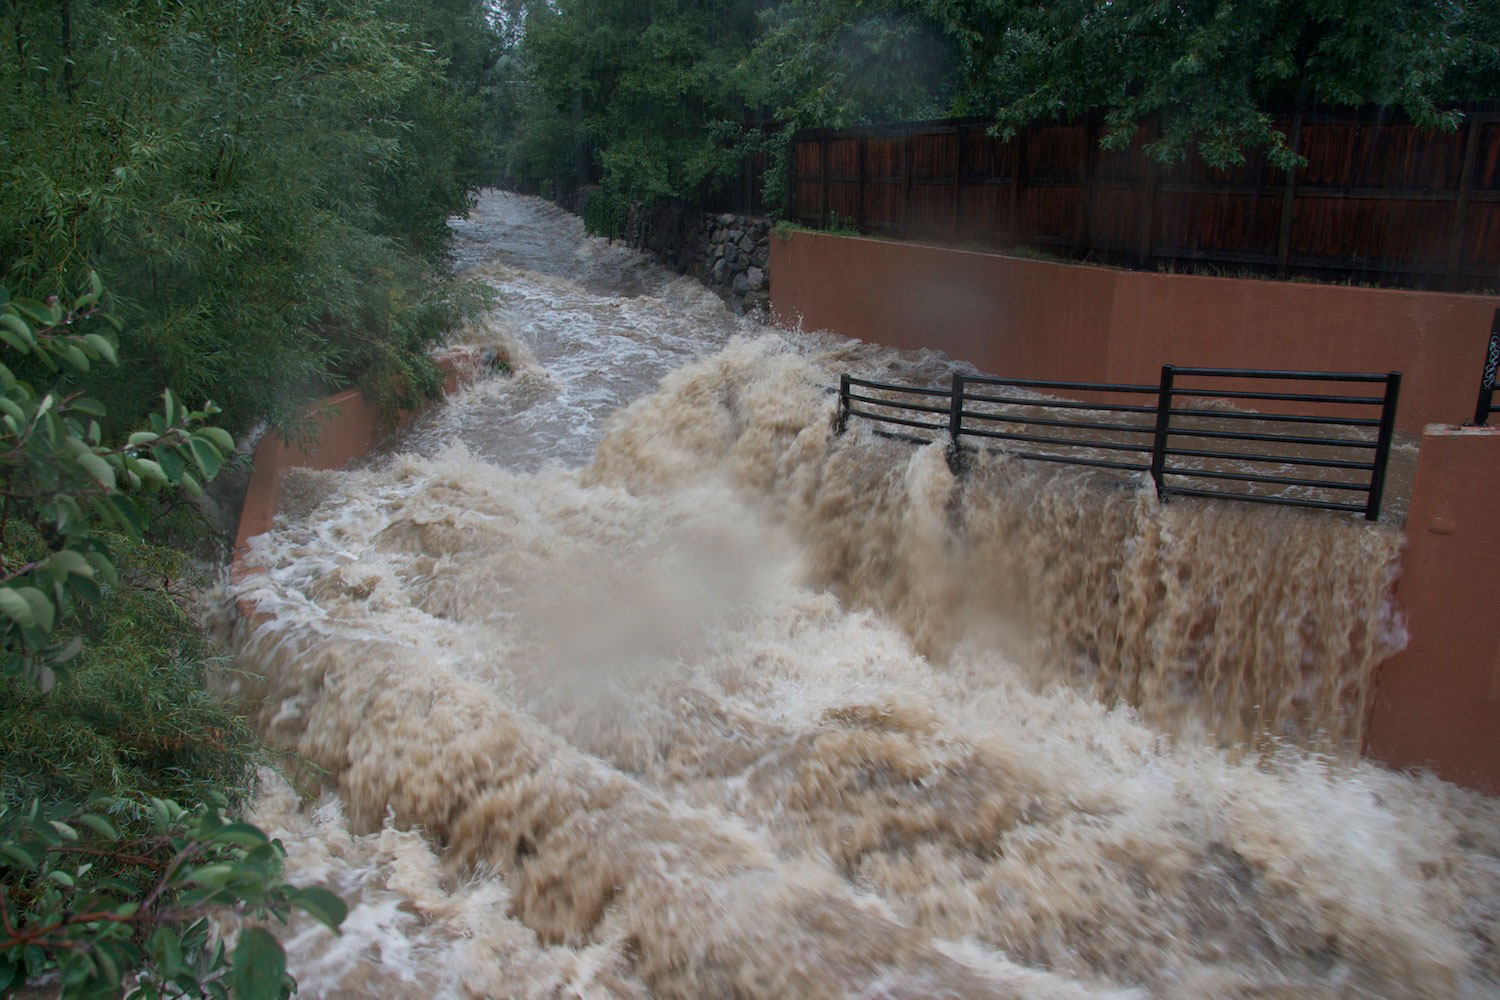
Even after the rains finally abated on Friday, I found myself struck by how the waterlogged air in Boulder felt oddly, almost eerily tropical. This only put an exclamation point on the weirdness of the week and its events. Four days of rainfall across Colorados Front Range produced massive flooding thats marooned thousands of people, inundated many key roads, and damaged countless homes and businesses.
Just how rare was this event? Was it a 100-year flood, or something bigger (or smaller)? As always, the answer depends on exactly what youre looking at, and exactly where.
Theres no doubt that the rains in and near my hometown were truly historic, as evidenced by data from Boulders official weather station.
Part of the NOAA cooperative observing program, this station has been located at the NIST/NOAA campus in south Boulder since 1990. Boulders weather history actually extends much further back, to 1893, including the catastrophic 1894 flood that devastated central Boulder (more on that one below).
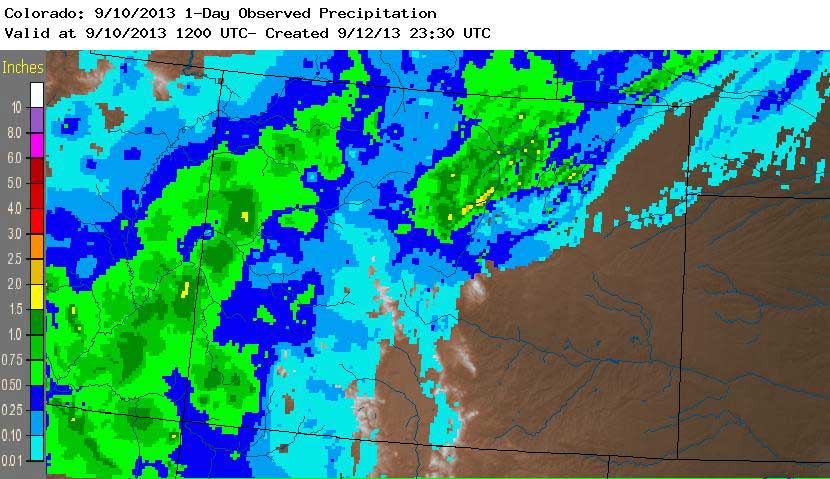
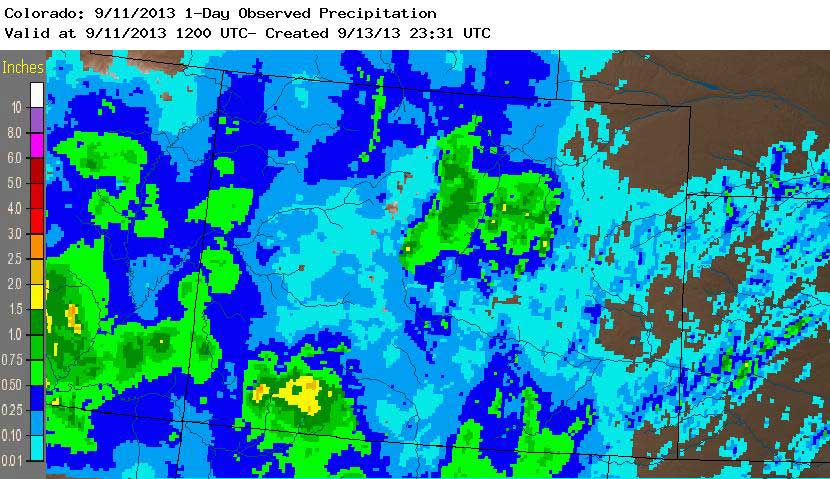
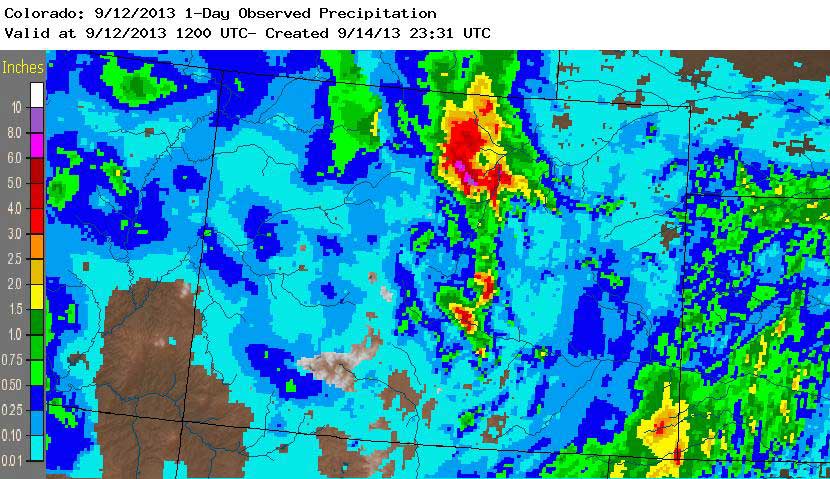
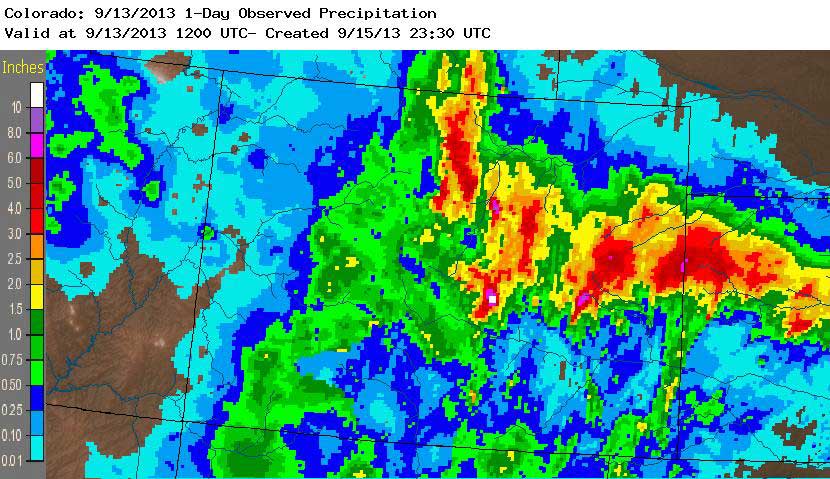
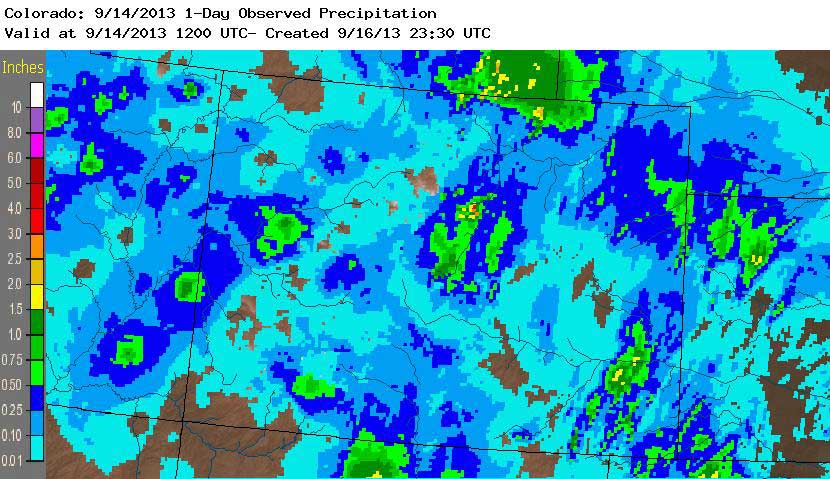
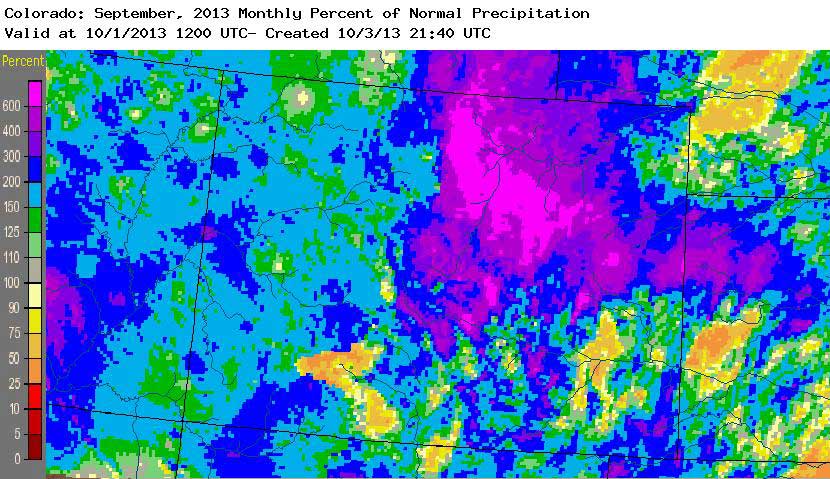
Between 00Z Thursday 9/12 (6 PM Mountain Daylight Time on Wednesday) and 00Z Friday 9/13, a total of 9.08 was measured at the official Boulder site. From 6 PM Monday 9/9 through 6 PM Friday 9/13, the grand total was a whopping 14.71.
For perspective:
- Boulders previous record for wettest calendar day4.80 (July 31, 1919)was shattered.
- The single day of rain on Thursday was also nearly twice as much as any other entire September has produced (5.50, in 1940).
- The full weeks rainfall easily topped the 9.59 observed in May 1995, Boulders wettest month up to now.
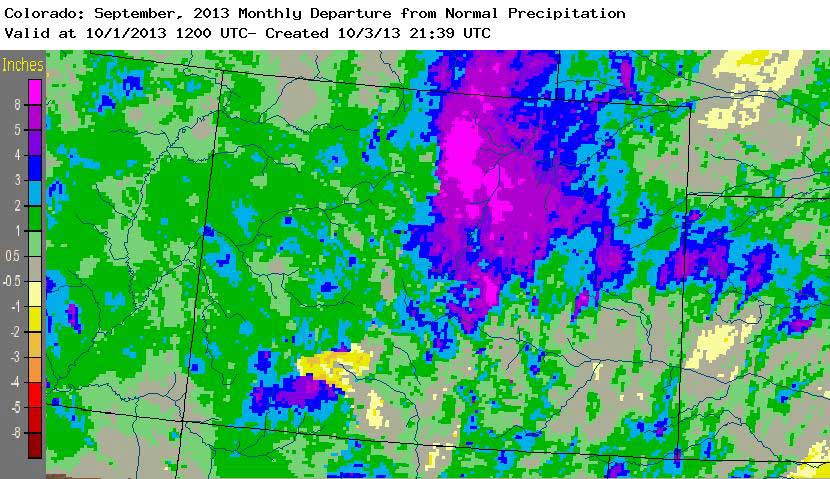
- The weeks precipitation also exceeded the 12.96 that fell in Boulder during this entire year up to September 8. Boulder has officially measured 17.15" for the past week and 30.12" for the year, making 2013 the city's wettest year on record.
Two things that helped make this rainfall historic are breadth and duration. Colorado can get much higher rainfall rates for brief periods and over small areas. One pocket of Fort Collins, Colorado, received more than 10 inches in less than six hours on July 28, 1997, leading to deadly flash floods there. However, its much harder to get the atmosphere to produce near-constant rain in large amounts for three-plus days across most of the semiarid High Plains and adjoining foothills of the Front Range.
Another unusual aspect is timing. Before now, the 10 heaviest single-day rains in Boulder history had all occurred between early April and early August. Interestingly, this weeks deluge followed a week-plus of record heat across much of the West that felt more like midsummer than September. Then the hot dome of upper-level high pressure shifted north and east, while a large but weak upper low set up shop across the western United States. With the main jet stream located well north into Canada, this pattern stayed in place for most of the week.
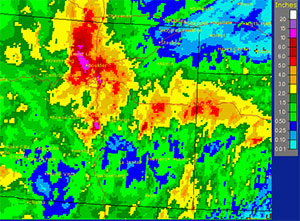
The immense amount of water that fell arrived at upper levels via a plume of deep moisture that surged northward from the tropics. At lower levels, the pattern drove moist air from the Great Plains toward the foothills, where it was forced upslope (see map). Together, these features blanketed the Front Range with the soggiest air mass ever recorded at Denver in September, as measured by radiosondes (weather balloons launched twice daily that sense the amount of water vapor through the depth of the atmosphere).
The transition from intense heat to heavy rain, and the weather features shown in the map, are similar to conditions more typical in July and August as part of the North American Monsoon pattern. Theyre not so typical for September.
Engineers often refer to NOAAs Atlas 14 to find frequency estimates: how often to expect precipitation of a given intensity and duration. Russ Schumacher (Colorado State University) used the atlas to calculate frequency estimates for the rains observed in the critical 48-hour window from 6 a.m. MDT Wednesday to 6 a.m. Friday. In doing so, Schumacher found that a large chunk of Boulder County and parts of several other state counties passed the 1000-year recurrence threshold.
Maps showing where rainfall from Wed-Fri exceeded various thresholds along Front Range: https://t.co/qUZ3kPqAGI #cowx #coflood
— Russ Schumacher (@russ_schumacher) September 14, 2013This doesnt mean that such a rainfall would literally be expected once every thousand years, like clockwork. Rather, its a statement of probability: a 1000-year rainfall has a 0.1% chance of occurring in any given year. Such values shouldnt be taken as gospelthere are important caveats, including the hard-to-model behavior of the most extreme eventsbut they do suggest how truly noteworthy this weeks rains were.
I think everyone who lives along the Front Range has known of the potential for a rain event that would produce the next big flash flood, says Schumacher. But I don't think anybody imagined that when it came it would cover such a large area and last so long.
As for the floods themselves, its a bit more complicated to discern their precise rarity. For example, changes in the built environmenthow streams are channeled, where parking lots replace fields, and so forthaffect how a flood moves through a watershed. So an identical weather event a century ago might produce a much different flood than the same event today.
One of the main tools for measuring flooding is river gauges that monitor streamflow height. Scientists use the long-term records from these sites, along with models of the topography, meteorology, and hydrology of the surrounding watershed, to extrapolate the potential height of worst-case floods. As with the rainfall example above, the results are probabilistic: a 100-year flood has a 1% chance of occurring in any given year, a 25-year flood has a 4% chance, and so on.
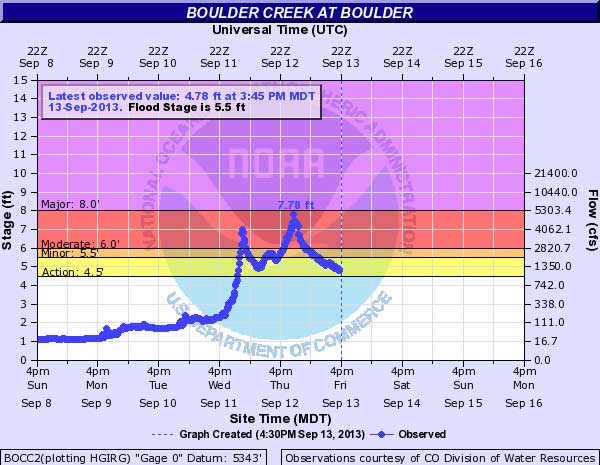
Near downtown, Boulder Creekas measured just west of Broadway by a U.S. Geological Survey gaugecrested at an impressive 7.78 feet on Thursday evening, with an estimated flow of about 5,000 cubic feet per second (cfs). Thats the highest water observed downtown since the record flood of May/June 1894, when flows were estimated at more than 11,000 cfs and large swaths of downtown were inundated. That 1894 event saw lower precipitation amounts than were observed in much of Boulder County this past week, but the rains were accompanied by major runoff from snowmelt. In contrast, this weeks rains fell on a parched, snow-free landscapeat least one saving grace.
Why were some of the floodwaters in and near town apparently more extreme than those observed in downtown Boulder? Rainfall isnt uniform across a region, so a given flood might be more extensive at one point along a river or creek, or in one part of town, than elsewhere. This weeks torrents included pulses of intense downpour embedded in steadier rain, so many smaller tributariesengorged by these pulsesflowed into roads, homes, and yards where residents had never encountered such water before.
--Bob Henson, Writer/Editor/Media Relations Association with UCAR. Reproduced with kind permission from UCAR and AtmosNews.