Mapping Puerto Rican Student Vulnerability and Risk To Improve School Emergency Planning
Publication Date: 2023
Abstract
This pilot study was conducted to test the viability of geolocating student addresses and merging them with risk and vulnerability map layers to develop a public health tool that visualizes student risk of exposure to natural hazards in their neighborhood or rural community. Four schools participated in the study. Each school principal was interviewed to gather information on emergency preparedness and planning. Risk layer maps were generated from different secondary sources. A Getis-Ord hotspot analysis of Puerto Rico Community Survey block group-level data was used to identify clusters of high vulnerabilities. Disorganized and incomplete address data forced us to geolocate each address manually using google maps. Although we were able to approximate most addresses and create a visualization tool, a widespread implementation of the tool will require an improved address data collection process. Increasing the ability of schools to respond to emergencies can reduce disruptions in school services, including classes, school lunches, socio-emotional services, and therapies for students with disabilities to help students cope with emergencies. However, effective planning requires an understanding of the school community’s risks, strengths, and limitations. Our pilot study demonstrated that improving administrative data is an important first step that is needed to be able to effectively use student information and geolocation technology for emergency planning.
Introduction
As hazard events have become more frequent, developing new tools to assess risks and vulnerabilities is essential for mitigation, preparation, and recovery efforts. Our previous Public Health Research Report—The Effect of School Services Disruptions on Educational Outcomes After Consecutive Disasters in Puerto Rico—found that most schools in Puerto Rico lack adequate emergency plans that explain the actions school administrators, teachers, and staff should take for disaster preparation, mitigation, and recovery (Segarra-Alméstica et al., 20211). Consequently, disruptions of school services have been exceedingly long.
In this study, we aimed to explore the potential capabilities of merging three types of secondary data: (1) student addresses from the Puerto Rico Department of Education Student Information System, (2) environmental risk geodata on natural hazards, and (3) demographic data from the Puerto Rico Community Survey. We merged these data sets to develop a visualization tool that maps student risk of exposure to hazards and vulnerability in their neighborhoods or rural communities. We argue that this visualization tool could help Puerto Rican public schools identify the specific risks and vulnerabilities that their students face and assist schools in implementing effective school emergency plans.
Literature Review
Our previous research aimed to understand how school services disruptions after consecutive disasters in Puerto Rico—Hurricanes Irma and Maria in 2017, the Southwest Earthquake Sequence in 2020, and the COVID-19 pandemic in 2020-21—affected students’ educational outcomes. Our findings indicated that schools' limited preparedness led to improvisation and the interruption of essential school services after each disaster.
Information and communication play a critical role in risk management. Lindell & Perry (20122) have proposed that people’s responses to environmental hazards (or protective action decision-making) result from three sequential processes: information search, protective response (problem-focused coping), and emotion-focused coping. However, the authors argue that information is the key variable that defines the decision-making process and that available information and the capacity to understand it plays a significant role in how people perceive threats and the protective actions they take. Lingjuan et al. (20233) also found a significant relationship between information acquisition ability and adaptive behavior.
The literature on risk management distinguishes the traditional protect and react approach from the more recent proactive and adaptive approach. However, this newer approach, according to van Buuren et al. (20184), referring specifically to flood risks, places a vital role on community actors since they must be able to anticipate and respond to changing environmental conditions. Therefore, to promote effective communication and reduce risks, community actors need timely, reliable, accessible, relevant, credible, understandable, and actionable information (World Health Organization, n.d.5).
The sources of risk information that people most frequently rely on include their previous experience, radio announcements, television or printed news, and personal interactions. However, technology offers new possibilities to bring customized information to community decision makers. For instance, social media has been a disaster response tool for some time. Han (20196) mentions that the Federal Emergency Management Agency (FEMA7) used Twitter during Hurricane Sandy's aftermath to coordinate their response. Cordero, Segarra, Rivera and Martinez (20208) documented the extensive use of WhatsApp among teachers and parents during the COVID-19 lockdown.
Hazard mapping technology has also improved substantially. Ren et al. (20219) state that "spatial data sources of various disaster elements are becoming increasingly extensive, and their content and forms are becoming increasingly abundant" (p. 282). However, most maps and weather reports are prepared for a more specialized audience rather than for community leaders. Furthermore, very few focus on rural areas (Johari et al., 202210). As geolocated social, environmental, and economic variables become more widely available, it is possible to develop accessible hazard mapping tools that help local leaders to manage risks and make decisions (Percival et al., 202011). Accordingly, the Sendai Framework for Disaster Reduction 2015-2030, adopted by the United Nations General Assembly in 2015, highlights the need for regional disaster risk assessments and maps that enhance "access to and support for innovation and technology, as well as in long-term, multi-hazard and solution-driven research and development in the field of disaster risk management" (p. 1612).
Until recently, FEMA did not consider schools a response organization. However, school shootings and other unpredictable emergencies (earthquakes, tornadoes, etc.) make schools especially vulnerable, primarily because they serve children. When those children belong to impoverished rural communities or have physical or mental disabilities, the potentially disruptive consequences of those events increase. For instance, after Hurricane Maria hit Puerto Rico, food, and medicines "had to be distributed by helicopter drop for several weeks because of landslides or destroyed bridges" (U.S. Government Accountability Office, 2018, p. 3013). For that reason, school officers and community leaders need to have information that allows them to make quality decisions and act accordingly.
Geohazard exposure mapping is a baseline tool that, combined with organizational capability assessment, information networks, and expert collaborations, can contribute to managing and prioritizing risks and responding to emergencies (Fang et al., 202314; Wood et al., 202215). With this in mind, this pilot project aims to evaluate the feasibility of providing schools with a hazard, risk, and vulnerability mapping tool that schools can use as a foundation for improving their emergency plans.
Research Questions
This pilot study evaluates the feasibility and potential benefit of merging information on schools, student socioeconomic status, and neighborhood characteristics with geographical hazard data into an effective risk planning and management tool for public schools in Puerto Rico. The specific questions to be addressed are the following:
- How accurately are students’ residential addresses registered in the Department of Education’s Student Information System? Do they allow for an accurate geographical location of their neighborhood of residence at the census block group or census tract level? Are there specific challenges in rural areas?
- How feasible is it to determine the probability of flooding, landslide, and socioeconomic vulnerability for students in a particular school using the neighborhood of residence, geographical hazard data available in Puerto Rico and data from the Puerto Rico Community Survey?
- How can student socioeconomic data, neighborhood data, school resilience, and hazard risk data be presented to school leaders and the Department of Education in a way that could be useful to improve school emergency plans?
Research Design
Our research design included two major activities: First, we recruited a group of school principals to participate in interviews and an online questionnaire. Involving the school principals was essential to our project because it allowed us to better understand schools’ challenges and needs before, during, and after emergency situations. It also gave us the opportunity to create a link with the schools to share our results. The second major activity was to compile secondary data sources and conduct spatial analysis and mapping. Each of these steps is described in more detail below.
Study Site and Access
Puerto Rico has been increasingly susceptible to hazardous events. As we found in our previous study, hazard events affect students' academic achievements, particularly among impoverished and disabled students (Segarra-Alméstica, Cordero-Nieves, 2021; Segarra-Alméstica, Caraballo-Cueto et al., 202216). In this scenario, it is fundamental for each school to develop or strengthen its hazard and emergency plans. Adequate planning increases the school's capacity to attend to the needs of its student population, considering their vulnerabilities, risk exposure, and resilience capacity.
We gained access to the data and contact information we needed to conduct this study through our work at the Observatory of Public Education in Puerto Rico, a research center based at the University of Puerto Rico that investigates educational affairs. The lead author is the director of the Observatory and the co-authors are actively involved in our research projects. The Observatory has a data exchange agreement with the Puerto Rico Department of Education that allows us to access data from their Student Information System, including de-identified student addresses (i.e., without names). The Department of Education also provided us with the list of active schools and the email addresses, phone numbers, and names of the principals for the schools in the sample.
School Sample
Initially, we proposed to have a sample of 10 schools in our pilot study, divided between six urban and four rural schools. In our 2021 study, 211 school principals completed a survey. To select the 10 schools, we conducted two random samples (a main and a replacement sample) of these 211 schools. Next, the Department of Education provided us with the student addresses from their Student Information System for the schools included in the sample.
School Principal Interviews and Questionnaires
To recruit principals for the interviews and questionnaires, we send an email to the 10 schools followed by a telephone call. In the email we explained the purpose of the project and requested that the principal participate in an interview and fill out an online questionnaire about their school's infrastructure conditions and available resources. Contacting schools in Puerto Rico is challenging. Email addresses provided to researchers by Puerto Rico Department of Education correspond to the school but are not assigned to a particular employee, therefore some emails sent were not read. We were also unable to contact some schools by phone after several attempts.
Four school principals agreed to participate in interviews. Three principals were from rural schools and one from an urban school. Interviews were conducted via the ZOOM platform and lasted between 20 and 30 minutes. The interview included questions regarding efforts made by the school to gather resources to address emergencies, whether the school had developed an emergency plan or started that process, and the information that could be helpful for such an endeavor. Most principals did not agree to be recorded. Therefore, the analysis was based on notes taken by the interviewer. They were asked six open-ended questions. We asked about their experience, if any, requesting human and physical resources to their central office. Also, we inquired about their emergency management plans, if they had one, and how they prepared and updated it.
Three principals completed the online questionnaire. Two before the interview and one afterward. It consisted of five closed-ended questions related to the quality of the school’s infrastructure and the availability of emergency resources.
Secondary Data for Hazard and Vulnerability Mapping
Hazard Risk Layers
We used secondary data to map various natural hazards in the neighborhoods or rural communities where students live. For this pilot study we focused on two types of hazards—flooding and landslides. We acquired the flooding hazard data from FEMA's Flood Map Service Center. FEMA’s (2009) Flood Hazard layer shows that Puerto Rico is susceptible to flooding across the island during high tides and tsunamis. Puerto Rico is also susceptible to flooding near rivers and on almost all coasts. We mapped the landslide hazards using data from the U.S. Geological Survey (Hughes & Schulz, 202017). The landslide susceptibility layer shows delicate areas where rain or the movement of plates can have a high impact, especially in the Central Mountain Range. The dashboard created for the schools also includes maps layers related to seismic activity and rainfall probability. A list of all the secondary data that we have gathered for the full project is available in the Appendix.
Social Vulnerability Data
For our analysis of social vulnerability, we used secondary data from the Puerto Rico Community Survey 2021 five-year sample at the block group level obtained through the IPUMS National Historical Geographic Information System page (Manson et al., 202218). Table 1 lists the social vulnerability measures that we used to construct our spatial analysis.
Table 1. Social Vulnerability Measures From the Puerto Rico Community Survey, 2021
| Variable | Definition |
| Poverty | Percentage of the population living in families with income below the poverty line. |
| Extreme Poverty | Percentage of the population living in families with income below half the poverty line. |
| Female-Headed Households with Children | Percentage of households headed by a female (with no spouse present) with children under 18 years of age. |
| Children in Grandparents' Households | Percentage of children under 18 living in grandparent-headed households. |
| Low Education | Percentage of the population age 25 or over that does not have a high school diploma. |
| Low Employment | Percentage of the population age 16 or over who are not employed. |
| Without vehicle | Percentage of households that do not have a motor vehicle. |
| No computer or internet | Percentage of households that do not have internet and computer. |
Spatial Analysis of Vulnerability Data
A hot spot analysis was performed for each social vulnerability measure to identify clusters of census block groups with high vulnerability levels. For the analysis, we used the Getis-Ord local spatial correlation index. This index tests for a spatial concentration of a variable between units within a pre-determined distance (Getis & Ord, 199219). High positive values of Gi* (pronounced G-i-star) represent hotspots, or clusters of high values of the variable of interest. In contrast, highly negative values of Gi* are associated with cluster of low values or coldspots. For our purposes, we focused on identifying the vulnerability hotspots. A Gi* greater than 1.65 is associated with a 90% or higher probability of being part of a hotspot. A Gi* greater than 1.96 represented a probability of 95% or higher and a Gi* greater than 2.58 represented a probability of 99% or higher. We used this analysis to create a hotspot map for each vulnerability variable.
Ethical Considerations and Researcher Positionality
Our research protocols were approved by the University of Puerto Rico at Rio Piedras Institutional Review Board Committee and by the Puerto Rico Department of Education's Centro de Investigaciones e Innovaciones Educativas.
Findings
School Resources for Emergencies
As part of this study, we wanted to understand how schools prepared for emergencies. The four school principals that we interviewed indicated that their schools are not used by their communities as emergency shelters. Of the four schools, only two had properly functioning cisterns for storing water. Of the two without adequate cisterns, one had a cistern that was not connected to the school water system, so the water ceased to be drinkable quickly. The other school had a well that works with an electric pump, therefore, they do not have water if there is no electricity.
Regarding a backup energy supply to use during extended power outages, which are frequent in Puerto Rico, two principals reported that their schools had neither a generator nor solar panel system. The other two principals reported that their schools had electric generators; however, they expressed frustration that those have not worked properly. For instance, one of the generators powers the kitchen but cannot power classrooms or offices in one school. In the other case, they began their installation two years ago and have not yet completed it. That school also has a solar panel system, but in the most recent blackout, it did not work. One principal lamented that not having electricity limits the services that the school could provide to their surrounding community during an emergency. According to the principal, such post-disaster services could improve response and recovery efforts because it is a rural community with a strong link to the school. Another principal expressed the need for a satellite phone because it is a remote community, and the telephone service is often interrupted during blackouts. Principals emphasized the importance of having a budget to meet the most pressing needs, such as the maintenance or repair of generators or the cistern.
One aspect of emergency planning that seems to have improved over time is that all four schools have social workers and psychologists as part of their regular staff. In addition, secondary schools have a counselor and elementary schools have a nurse. The latter stressed the importance of having a nurse because young children suffer falls and cuts, and she offered timely first aid. However, the funds for the nurse's salary were supplied from federal government aid during the pandemic, so her contract is not likely to be extended.
School Emergency Plans
All four schools have an emergency management plan. They received a model from the central office and adapted it to their needs. They update it every summer. Two schools have managed to incorporate into the plan alliances with other external agencies of the community, such as the Red Cross and the Municipal Government. However, principals at three of the schools reported that these plans had not been helpful during Hurricane Fiona in 2022, the 2020 earthquakes, or the pandemic. The lack of information in the plan about their schools’ specific situation seemed to be one of the reasons for this.
School Infrastructure and Safety in Emergencies
After the 2020 earthquakes, the Department of Education discovered that many public-school buildings had structural defects in their load-bearing columns known as "columnas cortas" in Spanish for “short columns.” This defect could cause the collapse of the wall during an earthquake event. According to the Secretary of Education, Eliezer Ramos, approximately 81% of the 857 schools in use had this problem (as stated in Radio Isla, 202120). Two of the four schools in our study had faulty columns and only one had been repaired at the time of the interview (May 2023).
Using Student Addresses to Identify Student Neighborhood Location
Research question 1 concerned the feasibility of using student addresses to identify the geographical location of student neighborhoods at the census block group or census tract level. To answer this question, we tested the viability of using a bulk address geolocating process by submitting a sample of 167 addresses of students enrolled in schools that agreed to participate in the pilot to a geographic software. The results showed that only 34 could be geolocated, producing a corresponding longitude and latitude to map it. Rural area addresses are less likely to be geolocated as many include the road but not the specific marker. The fact that only 20% of the addresses produced a result meant that an automatic geolocating process was not feasible. Therefore, we decided to stop recruiting additional schools for the pilot, given the timeframe and the need to geolocate the addresses manually. However, this also represents a significant limitation regarding possible widespread implementation across schools island wide. Due to missing information, many addresses were approximated using a central point in the road, sector, or barrio mentioned. We could locate or approximate the location for 98% of the addresses through Google Maps. We believe that our approximations give the school a good sense of where the students live to help conduct a risk assessment. Using ArcGIS, the longitude and latitude associated with each student address can then be related to the corresponding census areas, in our case, the census block groups.
In addition, all principals interviewed also reported that they do not update student addresses in the Department of Education's Student Information System database. In one school, the principal stated that they keep an alternate register by classroom. In essence, we find that even though school address could be approximated adequately, it requires a highly time-consuming effort. This process could be improved with better address data collection and management. A well-thought-out data entry system could allow for an automatic process of student address mapping that could be extended across all public schools and updated annually.
Student Risk and Vulnerability Profiles
Landslide and Flooding Risk
Research question 2 concerned the feasibility of assessing student risk for landslides, flooding, and social vulnerability, using their neighborhood of residence and geographical hazard data. To answer that question, we added the map of geolocated addresses to the risk layer maps, and estimated the percentage of students in each school for which their identified longitude and latitude falls within landslide or flood zoned Table 2 presents the distribution of students for each school according to the landslide risk at their neighborhood of residence. We grouped students in each school based on whether their geolocated addresses fall within three types of landslide risk zone identified as low, moderate, or high landslide risk areas.
Table 2. Percentage of Students in Landslide Risk Areas
| Low Landslide Risk Area | Moderate Landslide Risk Area | High Landslide Risk Area | |
| School 1 (Rural) | 63.3 | 32.8 | 3.9 |
| School 2 (Rural) | 52.7 | 44.1 | 3.2 |
| School 3 (Rural) | 85.2 | 14.1 | 0.7 |
| School 4 (Urban) | 99.1 | 0.9 | 0.0 |
Table 3 presents the number of students living in flood-prone areas. For each school, we counted the number of students with geolocated addresses that fall in one of three types of areas considered to have a 1% annual chance of flooding. FEMA (n.d.) defines Zone A as areas “with a 1% annual chance of flooding and a 26% chance of flooding over the life of a 30‐year mortgage” (Zone A section); Zone AE has similar risk as Zone A but includes information on base flood elevation; and Zone AO corresponds to “river or stream flood hazard areas with a 1% or greater chance of shallow flooding each year, usually in the form of sheet flow, with an average depth ranging from 1 to 3 feet [and]… a 26% chance of flooding over the life of a 30‐year mortgage” (Zone AO section).
Table 3. Number of Students By Flood Zone
| Schools | Flood Zone A | Flood Zone AE | Flood Zone AO |
| School 1 (Rural) | 0 | 0 | 0 | School 2 (Rural) | 0 | 0 | 0 | School 3 (Rural) | 1 | 2 | 0 | School 4 (Urban) | 0 | 25 | 0 |
Students enrolled in the urban school located in San Juan have a low-risk exposure to landslide, with 99% of them living in the lowest-risk areas. In contrast, 25 students, approximately a quarter of students enrolled in the school, live in Flood Zone AE areas. The inverse is true for students in School 1 and School 2. While these schools have no students living in flood-prone areas, 32.8 and 44.1 percent of their students, respectively, live in medium landslide-risk areas, and between 3 to 4% live in high landslide-risk areas.
Student Socioeconomic Vulnerability Analysis
We used the hot spot analysis based on the Puerto Rico Community Survey data, as previously described, to assess student socioeconomic vulnerability. Table 4 presents the student vulnerability profiles at each school. These include the average value of each vulnerability measure across the block groups where students live and the percentage of students estimated to live in a vulnerability hotspot. To estimate the average values, each student was assigned the vulnerabilities percentage corresponding to their block group of residence; values were then averaged across students. Therefore, they are implicitly weighed by the number of students in each block group. These average values present a profile of how vulnerable the student population is and what type of vulnerabilities are more prevalent in their neighborhoods. The percentage of students living in hotspots offers information with respect to the spatial clustering of vulnerabilities. A hotspot represents an area of two or more adjacent block groups with a high value for a specific vulnerability. Therefore, the percentage of students living in a hotspot represents students living in a cluster of high-vulnerability areas. For an area to be a hotspot the values within the cluster must be significantly higher than in other adjacent areas. For example, the average value of extreme poverty is similar in School 1 and School 4, nevertheless, in School 1 none of the students are identified as living in a hotspot while in School 4, 46% of students live within a hotspot. School 1 is located in a high poverty municipality, while School 4 is in the Municipality of San Juan with a lower general poverty level but higher inequality. As a result, in School 4, adjacent areas to students’ neighborhoods have significantly lower levels of extreme poverty compared to the areas where students lived.
Table 4. Student Neighborhood Vulnerability
| School 1 (Rural) N=102 | School 2 (Rural) N=242 | School 3 (Rural) N=155 | School 4 (Urban) N=95 | |||||
| Vulnerability Factor | Average value among students | % Student Living in Hotspot Zones | Average Value Among Students | % Student Living in Hotspot Zones | Average Value Among Students | % Student Living in Hotspot Zones | Average value among students | % Student Living in Hotspot Zones |
| Extreme Poverty | 27 | 0 | 19 | 0 | 21 | 0.7 | 30 | 46 |
| Female-Headed Households with Children | 27 | 2 | 18 | 1 | 24 | 4.5 | 25 | 77 |
| Children in Grandparents' Households | 4 | 0 | 19 | 3 | 23 | 0.7 | 13 | 0 |
| Low Education | 26 | 96 | 28 | 18 | 21 | 8.4 | 21 | 0 |
| Low Employment | 68 | 61 | 62 | 2 | 58 | 7.1 | 58 | 1 |
| Without Vehicle | 9 | 1 | 13 | 1 | 9 | 1.3 | 27 | 0 |
| No computer or Internet | 34 | 12 | 30 | 1 | 20 | 1.9 | 38 | 80 |
From these tables, the differences among schools are evident. In School 1, 96% of students live in block groups identified as part of a low education hot spot. Students in School 2 live in block groups that, on average, have 19% of children living in households headed by grandparents. The School 3 profile shows slightly lower block group averages for most vulnerabilities compared to the other two rural schools, except for the percentage of children living in grandparents-headed households (23%). School 4, which is the only urban school participating in the pilot, shows a much higher percentage of students living in hotspot locations for extreme poverty (46%), female-headed households with children (77%), and lack of vehicle access (80%).
Geolocated addresses allowed us to identify differences in the prevalence of risks and vulnerabilities across schools, and also to prepare a vulnerability profile for each school. This information can help schools target actions to lessen the effect of future emergencies.
Developing a Public Health Tool for School Leaders: Dashboard Design
Research question 3 was concerned with how to present the student neighborhood risk and vulnerability maps to school leaders and the Department of Education so that the maps could be useful to improve school emergency plans.
We created a dashboard with the student neighborhood hazard and vulnerability maps for each school using ArcGIS. The tool allows visualizing the student's approximated residential location, the flooding and landslide hazards, and the hotspot map for each vulnerability variable. Using the layer menu, the user can add or remove information about risks and vulnerability levels for Puerto Rico to the visualization. A fifth dashboard was created for the Department of Education and the general public, including the active school locations. Figures 1 to 3 present examples of the type of maps available in the dashboards.
Figure 1 shows an example of the kind of maps that can be visualized using a dashboard that will be presented to the Puerto Rico Department of Education managers. It identifies the location of all K-12 public schools in Puerto Rico. The school locations (black icons) are presented jointly with the landslide, flooding, and seismic activity risk layer. In the dashboard the different layers can be turned off and on by the user.
Figure 1. Public Schools Distribution and Hazard Risks Layers
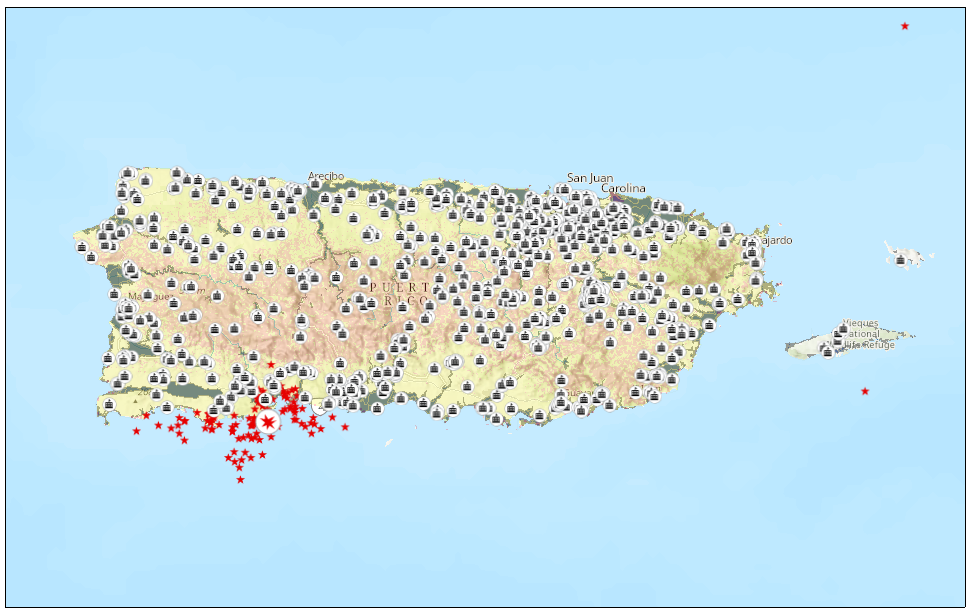
Figure 2 shows an example of how the dashboard can visualize student flood and tsunami risk at one school. It shows the geolocated addresses of students enrolled in School 4, the urban school, jointly with the Tsunami and Flood Hazard layer.
Figure 2. School 4 Student Residences and Tsunami and Flood Hazard Layers
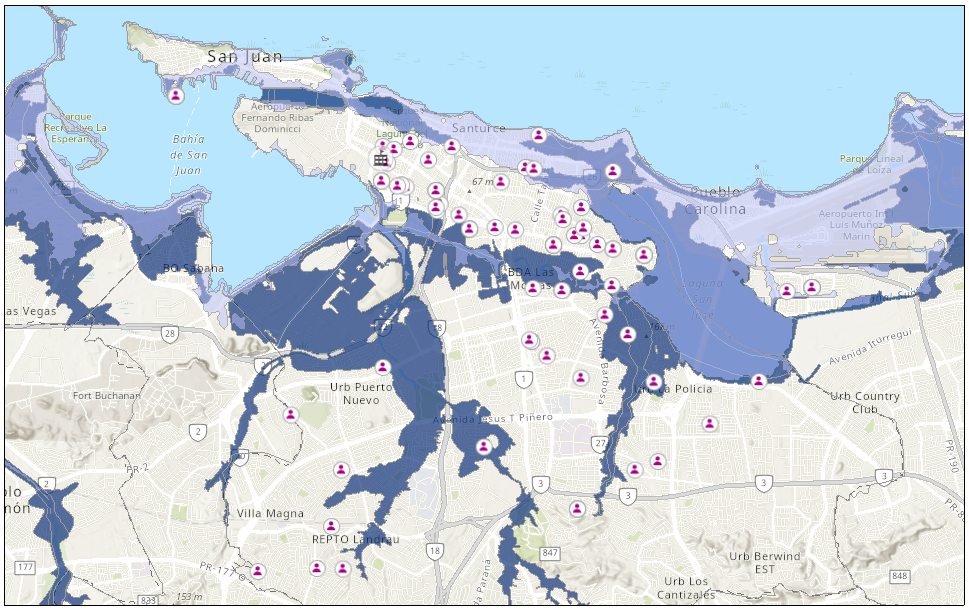
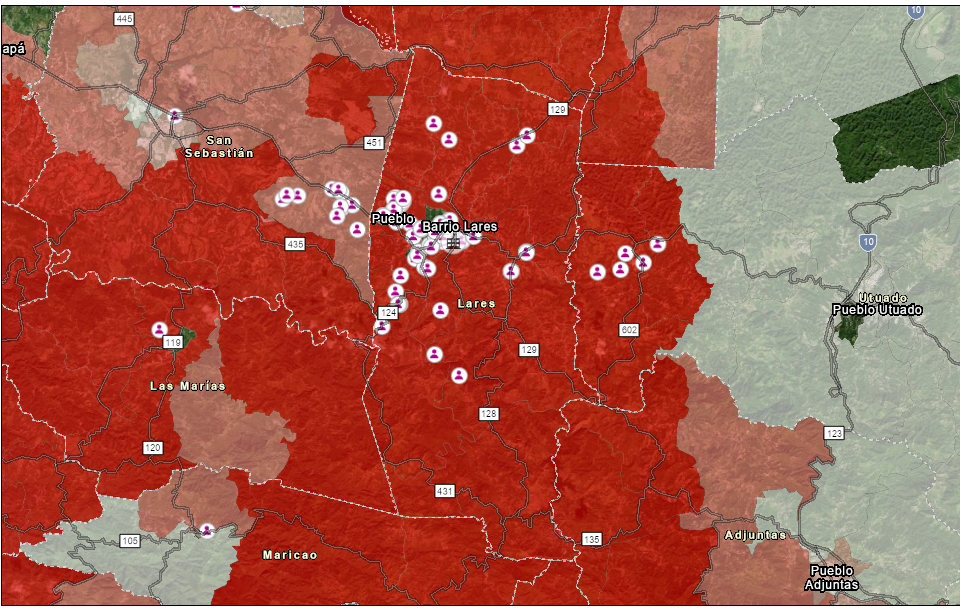
Figure 3 depicts a close-up view of the low education hotspots layer from School 1’s dashboard along with the geolocated addresses of students.
Figure 3. School 1 Student Residences and Low Education Hotspots Layer
Conclusions
Public Health Implications
As established in our previous research, school service disruptions affect the most vulnerable students, those impoverished or with disabilities, disproportionally. Thus, increasing the ability of the school to respond to emergencies can reduce disruptions in school services, including classes, school lunches, socio-emotional services, and therapies for students with disabilities. These are extremely important to help students cope with emergencies. The interviews confirmed that school emergency plans that are highly school-specific must be improved to help manage different emergencies.
Schools can develop actions and disseminate knowledge that attends to specific school community needs. For example, during a flood hazard event a quick response plan to move and relocate people, especially those with a lack of access to vehicles or other mobility issues can save lives. Similarly, landslide events tend to curtail access to food, water, and medical attention for extended periods. A well-informed and organized school community can be engaged in preparation and mitigation efforts to attend to the community’s needs when confronting an emergency threat. However, effective planning requires an understanding of the risk, the strengths, and the limitations facing the community. A school emergency plan tailored to the school’s community can focus on attending to the more pressing needs. Example of these can be helping assure assess to food or water, coordinating with other agencies or groups access to medical services, preparation and mitigation training for students and families, among others.
We believe the dashboard we created is a useful prototype of a public health tool that can be developed to assist in emergency planning and decision-making. However, our pilot study demonstrated that improving administrative data is an important step in order to be able to take advantage of innovations in data analysis and visualization tools for emergency planning.
Future Research Directions
We plan to present the results of our study and the dashboard to the four participating schools. During our presentation, we will discuss the usefulness of the tool developed, ways to improve it, and their interest in implementing a participatory process with the school community to improve their emergency planning. After meeting with the principals, we expect to meet with managers from the Puerto Rico Department of Education to present our findings and discuss the possibility of taking steps towards a widespread implementation, focusing on the need to improve the student addresses data collection process.
Acknowledgments. We thank the Puerto Rico Department of Education for providing data from the student information system.
References
-
Segarra-Alméstica, E., Cordero-Nieves, Y., Cordero-Guzmán, H., Caballero-Cueto, J., Luciano-Montalvo, I., Martínez-Mejias, S., & Rivera-Rivera, H. (2021). The Effect of School Services Disruptions on Educational Outcomes After Consecutive Disasters in Puerto Rico. Natural Hazards Center Public Health Report Series, 2. University of Colorado Boulder. https://hazards.colorado.edu/public-health-disaster-research/the-effect-of-school-services-disruptions-on-educational-outcomes-after-consecutive-disasters-in-puerto-rico ↩
-
Lindell, M.K., Perry, R.W. (2012). The Protective Action Decision Model: Theoretical modifications and additional evidence. Risk Analysis, 32(4), 616-632. ↩
-
Lingjuan, Z., Yingshu, C., Yulong, H., Jichao, H., Huijie, L. (2023). The impact of risk perception and information acquisition on meteorological adaptive behavior of large grain farmers. Emirates Journal of Food and Agriculture, 35(3), 251-261. ↩
-
van Buuren, A., Lawrence, J., Potter, K., & Warner, J. F. (2018). Introducing adaptive flood risk management in England, New Zealand, and the Netherlands: The impact of administrative traditions. Review of Policy Research, 35(6), 907-929. ↩
-
World Health Organization. (n.d.). WHO principles for effective communications. Retrieved June 14, 2023, from https://www.who.int/about/communications/principles ↩
-
Han, S. (2019). Weathering the Twitter storm: Early uses of social media as a disaster response tool for public libraries during Hurricane Sandy. Information Technology and Libraries, 37-48. ↩
-
Federal Emergency Management Agency. (n.d.). Glossary. Retrieved July 27, 2023, from https://www.fema.gov/about/glossary ↩
-
Cordero-Nieves, Y., Segarra-Alméstica, E.V., Rivera-Ramos, H., Martínez Mejías, S. (2020). Educación a distancia y COVID-19 en Puerto Rico desde la perspectiva del personal docente. Revista de Administración Pública, 51, 113-157. ↩
-
Ren, F., Li, Y., Zheng, Z., Yan, H., Du, Q. (2021). Online emergency mapping based on disaster scenarios and data integration. International Journal of Image and Data Fusion, 12(4), 282–300. ↩
-
Johari, N.S., Abdullah, N.M., & Mohd Bukari, S. (2022). GIS communicate emergency preparedness mapping: the usability for rural area. IOP Conference Series: Earth and Environmental Science No. 012031. https://iopscience.iop.org/article/10.1088/1755-1315/1022/1/012031 ↩
-
Percival, S.E., Gaterell, M., Hutchinson, D. (2020). Effective flood risk visualization. Natural Hazards, 104, 375-396 ↩
-
United Nations General Assembly. (2015, June 23). Resolution adopted by the General Assembly on June 3, 2015: 69/283. Sendai Framework for Disaster Risk Reduction 2015–2030. https://www.un.org/en/development/desa/population/migration/generalassembly/docs/globalcompact/A_RES_69_283.pdf ↩
-
U.S. Government Accountability Office. (2018, September). 2017 Hurricanes and Wildfires: Initial Observations on the Federal Response and Key Recovery Challenges. Report to Congressional Addressees. GAO-18-472. ↩
-
Fang, Z., Yue, P., Zhang, M., Xie, J., Wu, D., & Jiang, L. (2023). A service-oriented collaborative approach to disaster decision support by integrating geospatial resources and task chain. International Journal of Applied Earth Observation and Geoinformation, 117, 103217. ↩
-
Wood, N., Pennaz, A., Marineau, J., Jones, J., Jones, J., Ng, P., & Henry, K. (2022). Multi-hazard risk analysis for the U.S. Department of the Interior: An integration of expert elicitation, planning priorities and geospatial analysis. International Journal of Disaster Risk Reduction, 82, 103385. https://doi.org/10.1016/j.ijdrr.2022.103385 ↩
-
Segarra-Alméstica, E., Caraballo-Cueto, J., Cordero, Y., & Cordero, H. (2022). The effect of consecutive disasters on educational outcomes. International Journal of Disaster Risk Reduction, 83, 103398. https://doi.org/10.1016/j.ijdrr.2022.103398 ↩
-
Hughes, K.S., & Schulz, W.H. (2020). Map depicting susceptibility to landslides triggered by intense rainfall, Puerto Rico: Open-File Report 2020–1022 U.S. Geological Survey. https://doi.org/10.3133/ofr20201022 ↩
-
Manson, S., Schroeder, J., Van Riper, D., Kugler, T. and Ruggles, S. (2022). IPUMS National Historical Geographic Information System: Version 17.0 [Dataset]. IPUMS. http://doi.org/10.18128/D050.V17.0 ↩
-
Getis, A., & Ord, J. (1992). The Analysis of Spatial Association by Use of Distance Statistics. Geographical Analysis, 24(3), 189-206 ↩
-
Radio Isla (2021, June 22). Unas 684 escuelas en Puerto Rico tienen problemas de columnas cortas. Radio Isla. https://radioisla.tv/unas-684-escuelas-en-puerto-rico-tienen-problemas-de-columnas-cortas1/ ↩
Segarra-Alméstica, E., Cordero-Nieves, Y., & Vélez-Flores, A. (2023). Mapping Puerto Rican Student Vulnerability and Risk To Improve School Emergency Planning (Natural Hazards Center Public Health Disaster Research Report Series, Report 36). Natural Hazards Center, University of Colorado Boulder. https://hazards.colorado.edu/public-health-disaster-research/mapping-puerto-rican-student-vulnerability-and-risk-to-improve-school-emergency-planning