Evaluation of Winter Storm Warnings:
A Case Study of the Colorado Front Range December 20-21, 2006, Winter Storm
Sheldon Drobot
Colorado Center for Astrodynamics Research
University of Colorado
Boulder, Colorado
2007
A printable version of this QR report is available in PDF format.
Any opinions, findings, and conclusions or recommendations expressed in this material are those of the author(s) and do not necessarily reflect the Natural Hazards Center.Citation: Drobot, Sheldon. 2007. Evaluation of Winter Storm Warnings: A Case Study of the Colorado Front Range December 20-21, 2006, Winter Storm. Quick Response Research Report 192. Boulder, CO: University of Colorado Natural Hazards Center. http://www.colorado.edu/hazards/research/qr/qr192/qr192.html.
Introduction and Research Objectives
When faced with winter weather conditions, people generally state that they will reduce their speed and drive with greater caution (Andrey and Knapper 2003). Nonetheless, research also shows that the risk of vehicular accidents rises sharply in winter weather conditions (Andrey et al. 2003), suggesting people’s responses are not sufficiently accounting for the weather conditions. In fact, in an average year, winter weather is directly or indirectly involved in 400,000 vehicular accidents in the United States, leading to 1,300 fatalities and 118,000 injuries (FHWA 2007); these numbers far exceed average fatalities for other natural hazards (NOAA 2007).
Despite the high incidence of morbidity and mortality, relatively little is known about how the combination of weather forecasts, observed weather, and non-meteorological factors influence driving decisions in winter weather conditions. Yet this integration of physical and social science information is critical to develop new weather forecast information dissemination strategies and to design new accident countermeasures (Andrey and Knapper 2003, NRC 2003).
To improve our understanding of decision making related to driving in hazardous winter weather conditions, this study investigated driving decisions related to a winter storm that occurred along the Colorado Front Range on December 20–21, 2006. This winter storm provides an intriguing case study from both physical and societal standpoints. Physically, the storm ranked as one of the largest ever seen along the Colorado Front Range. Societally, because snow did not begin falling heavily until mid-morning, people’s decisions to stay home would have been based largely on weather forecasts. The latter is key because it is not well understood what percentage of people cancel trips based on weather forecasts versus current conditions (Andrey et al. 2001, Andrey and Knapper 2003, Kilpeläinen and Summala 2007).
Specifically, this report investigates the following research questions:
- What were respondents’ main sources for obtaining weather information for the December 20–21, 2006, winter storm?
- Did respondents decide to stay home on December 20, and if so, what information and characteristics influenced that decision?
- What were the respondents’ perceptions of the accuracy of the weather forecast?
Answers to these questions can provide critical insight into the public’s sources, uses, and perceptions of weather information, and also how they make decisions related to driving during hazardous events.
Data Collection and Analysis Methods
Survey Design and Implementation
Information on respondents’ sources, uses, and perception of weather forecasts, their driving decisions related to the December 20–21, 2006, winter storm, and their basic demographic characteristics were obtained via an Internet survey. Working through Survey Sampling International (www.surveysampling.com), I obtained 254 responses over a three-day timeframe from respondents living along the Colorado Front Range (Figure 1).
Internet sampling is an attractive alternative to traditional mail surveys because it provides data rapidly and allows for better control over respondents’ access to the questions (i.e., they cannot jump ahead or go back and change their answers based on information in a subsequent question). However, as noted by Couper (2000), there remains a significant portion of the U.S. population that does not have access to the Internet. Estimates of Internet access vary widely, but based on the most recent U.S. Census data (2003), about 55 percent of U.S. households (n ~ 62 million) have Internet access at home. To ensure that a large portion of these households is eligible for surveying, Survey Sampling International recruits possible survey panelists through thousands of Web sites as well as data aggregators. Combined, Survey Sampling International estimates that it has access to about 70 percent of the online population. Regardless, it is important to keep in mind that the Internet survey data are for exploratory purposes and are not representative of the entire population of the Colorado Front Range or the rest of the United States.
Table 1 presents selected socio-economic and demographic characteristics of the respondents. In comparison with U.S. Census information for the state of Colorado, the response pool for this survey contained a higher portion of females, was slightly better educated, and was wealthier.
Major Findings
Research Question #1: What were respondents’ main sources for obtaining weather information for the December 20–21, 2006, winter storm?
Looking first at respondents’ everyday sources for obtaining weather information, responses highlight the importance of local television stations and also suggest some newer technologies are not yet used by the majority of the respondents. For instance, 90 percent of the respondents obtain weather forecasts from local television stations at least once a week (Figure 2), but cell phones are used for obtaining weather forecast information at least once a week by less than 5 percent of the respondents.
Focusing specifically on respondents’ sources of weather information related to the December 20–21, 2006, winter storm, there is a clear preference for local television. Nearly two-thirds of respondents used local television as their main weather forecast information source leading up to the storm, and during the storm, 76 percent of respondents tuned into the local television stations as their main information source (Figure 3).
Combined, these results emphasize that local television remains the dominant source for obtaining everyday weather forecast information, and it appears to take on added significance for long-lead hazardous weather events. Although the options for obtaining weather forecast information have increased due to new technologies, such as the Internet and cell phones, these newer sources are not yet used as the main source for obtaining weather forecast information by many of the respondents. Moreover, these results support previous studies that highlight the important role local broadcast meteorologists play in conveying information to the general public during major meteorological events (e.g., NOAA 1999), and the results further emphasize the importance of public-private sector relationships (NRC 2006).
Research Question #2: Did respondents decide to stay home on December 20, and if so, what information and characteristics influenced that decision?
As noted in the introduction, an interesting facet of this winter storm was that snow had only begun to lightly fall, or had yet to begin falling, during the December 20 morning commute. However, within a few hours, peak snowfall rates had reached 2-3 inches per hour, and by evening snow accumulation was greater than 1-2 feet in many locations. The high snowfall rates resulted partly from strong jet-stream winds and very cold upper atmosphere temperatures, which led to considerable upward motion. Additionally, atmospheric motion in the lower atmosphere favored moisture advection from the Gulf of Mexico and upslope flow on the eastern Rocky Mountains, further contributing to the heavy snowfall rates.
Overall, 48 percent (n = 119) of the respondents left home for work or school on the morning of December 20, 2006, and 52 percent (n = 128) stayed home. Of those who stayed home, 65 percent attributed their decision to stay home as being based on the weather forecast. Thus, roughly one in three respondents stayed home based on the weather forecast. These results provide empirical evidence that people will cancel trips during severe weather based on weather forecasts, which deviates from the general consensus that driving decisions are based mainly on previous experience and observable weather, with weather forecasts playing very little role in driving decisions (Andrey et al. 2001, Kilpeläinen and Summala 2007). Although additional studies are needed to better determine why these results differ somewhat from accepted wisdom, the most likely explanation relates to the severity of the forecast December 20–21, 2006, winter storm. For instance, most existing studies deal with general winter driving conditions, but they do not focus specifically on situations of severe winter weather conditions, as were forecast for this storm. Beginning with the first winter storm watch, and extending through the winter storm warning and blizzard warning, the National Weather Service (NWS) repeatedly warned that travel would be treacherous and impossible in some areas (Table 2). For example, the December 19 (Tuesday) forecast at 5:17 a.m. noted that “[t]ravel may become difficult if not impossible due to heavy falling and blowing snow,” and the 11:29 a.m. update suggested that “[p]ersons planning travel on Wednesday or Thursday should consider alternate plans.” The survey design did not allow for elaboration on what parts of the weather forecast prompted respondents to stay home, so it is not possible to state with certainty what role these transportation warnings played. However, these messages, which were subsequently conveyed through television, radio, and other sources, may have been an important factor in respondents’ decision to stay home on December 20.
Focusing on the people who left home, a series of questions asked these respondents whether or not they took special precautions on the morning of December 20, 2006 (as suggested by the NWS); the respondents could indicate they did nothing or they did some combination of packing extra food, clothes, or winter gear. Overall, 70 percent of those who left did not take any extra precautions before leaving. Only 8 percent packed extra food in their vehicle before leaving, 17 percent packed extra clothes in their vehicle before leaving, and 20 percent packed winter gear in their vehicle (e.g., shovels, candles, etc.). The low rate of self-preparations presents an opportunity to make a concerted educational effort at better explaining the need to prepare before leaving home. As most respondents are relying on local television sources for weather forecasts, especially during severe weather (Figures 2 and 3), broadcast meteorologists are well positioned to strongly and repeatedly advise the public that should they need to leave, they had best take extra food, clothing, etc., as a precaution.
For those that left home, other questions asked about whether or not they left work early, and how long their commute home took. Only 24 percent left work/school at about the same time as they always do; 37 percent left work/school early based on their own decisions; and 39 percent of the respondents left early because their place of work/school closed. The modal category for a typical commute home of survey respondents was between 15 and 30 minutes (Figure 4), but the modal commute time during the storm was between 60 and 90 minutes, and 22 percent of the respondents took more than two hours to get home. Moreover, with the heavy snowfall rates, roads quickly became difficult to traverse, and 7 percent of the respondents became stuck in the snow on the trip home. For those that were stuck, an open-ended question asked them to describe what they did next. Several respondents were able to extricate themselves on their own or with the help of good samaritans, but a few people abandoned their vehicles and either were given rides home by police or fire, or simply walked home if they were close. Interestingly, the time of day respondents left work had little relationship with the length of their commute or whether or not they became stuck on the trip home. This most likely is related to the very high snow accumulation rates, which would have created transit problems early in the day.
In addition to focusing on respondents’ actions on the morning of December 20, other questions were asked to assess how non-meteorological and meteorological factors combined to influence decision making. For example, existing research indicates that weather conditions are the main source of anxiety for drivers (Hill and Boyle 2007), and recent research suggests some links between post-traumatic stress disorder (PTSD) and driving behavior in flash flood situations (Drobot et al. 2007). Although the current study did not ask questions related to the clinical definition of PTSD, there is evidence from this survey to state that as self-reported anxiety levels related to driving in hazardous weather increased, the percentage of respondents staying home also increased (Figure 5). With increased anxiety, respondents would likely feel less capable of keeping themselves safe while driving in the winter storm (i.e., lower safety efficacy), and thus they would be more likely to choose to stay home (Bandura 1988).
Depending on how the respondents are classified into a weather forecast information seeking (WeFIS) index, there is evidence to both support and reject the hypothesis that people who stayed home during the winter storm were more likely to be seekers of weather forecast information. For instance, one method for developing a WeFIS is to re-code the responses for how often respondents seek forecast information from the various sources, with “rare or never” recoded as 0 and “at least once a day” recoded as 4. The result is a WeFIS index ranging from 0 to 36. Based on this WeFIS index, respondents with higher scores would be those that seek weather forecast information more often. In this survey, the mean WeFIS was 12.8 (median = 12.0), with a standard deviation of 5.0, and it is normally distributed. The mean score for those who left home was 13.2, and the mean score for those who stayed home was 12.5. However, with a p-value of 0.31, the mean difference is not significant, suggesting that whether or not respondents stayed home had no relation to how often they checked various sources for weather forecasts. Nonetheless, people often check multiple sources for weather warnings, and there is some evidence to conclude a relationship between those who stayed home and those respondents who check multiple sources daily to obtain weather forecasts (Figure 6); 48 percent of the respondents who check multiple sources stayed home on the morning of December 20, and only 35 percent of respondents who check at most one source stayed home on the morning of December 20. The x2 for this cross-tabulation is 3.34, and with the associated p-value of 0.07, this is a marginal relationship that needs further exploration to better understand how people’s information-seeking behaviors affect their decision making.
Research Question #3: What were the respondents’ perceptions of the accuracy of the weather forecast?
The majority of respondents (56 percent) felt that the snow began to fall approximately when it was forecast to begin (Figure 7). In comparison, 30 percent believed that snowfall began sooner than expected, 7 percent felt that snow began to fall later than forecast, and 7 percent did not know when the snow was supposed to begin falling. Although it is difficult to verify the onset of snowfall, especially given that snow began falling at different times over the study region, the NWS forecast discussions as early as December 17, and continuing into December 19, noted that snowfall should begin on December 20.
Although most respondents felt that the timing of the snowfall was accurate, a majority of respondents believed that more snow fell than was actually forecast (Figure 8). Given the spatial variability in snowfall accumulation, and because of uncertainty in knowing where individual respondents obtained their weather information, this is again difficult to verify. However, the NWS forecast discussions leading up to December 20 provide evidence that significant snowfall accumulation was expected, especially in the December 19 afternoon discussion.
Comparing the two measures, there is a strong association between respondents’ perceptions of timing and amount of snowfall. Approximately 78 percent of the respondents that felt snowfall began about when it was forecast also felt that the forecast snowfall was accurate. In comparison, of those that felt more snow fell than was forecast, 44 percent felt it also began earlier (45 percent felt it began on time). All respondents that did not know whether the actual and forecast snowfall amounts were about the same also did not know when snow was forecast to begin falling.
Certain characteristics are associated with those that felt more snow fell than forecast. For example, 60 percent of respondents who left home on the morning of December 20 thought that more snow fell than was forecast, compared with 52 percent of those who stayed home (x2 = 6.41; p-value = 0.09). Those who stayed home were also more likely to state that less snow fell than was forecast (7 percent versus 3 percent), although the numbers are small for these two categories. Of the 17 people who became stuck on their way home, an even larger percentage (70 percent) felt more snow fell than was forecast. The latter result suggests that people’s perceptions of forecast accuracy may be related to how much they’re impacted by the weather; this is an area for additional research in follow-up studies.
Summary and Conclusions
This report focused on identifying respondents’ everyday sources for obtaining weather information; identifying their main sources for obtaining weather information for the December 20–21, 2006, winter storm; determining what percentage of respondents stayed home on the morning of December 20, 2006, and whether their decision to stay home was based on the weather forecast and/or certain defining characteristics; and assessing respondents’ perceptions of the accuracy of the weather forecast. The following results emerged:
- The vast majority of respondents relied on local television to get weather information leading up to and during the storm, highlighting the important role local broadcast meteorologists play in conveying information to the general public during major meteorological events, and further emphasizing the importance of public-private sector relationships.
- A higher percentage of the respondents stayed home based on the weather forecast in comparison with previous research. Additional research is needed to fully explain this, but the combination of the forecast severity and specific language related to hazardous driving conditions may have contributed to the higher-than-expected percentage of people who stayed home.
- Respondents who stayed home were more likely to have higher levels of self-reported anxiety related to driving in weather conditions. This reinforces the notion that decision making related to hazardous weather events is not solely related to meteorological forecasts or conditions. It also highlights the importance of incorporating physical and social sciences in any attempt to understand the public reaction to hazardous weather events.
- Only 30 percent of respondents who left home took special precautions, such as packing extra food or clothes. This highlights an area were additional public education is needed.
- A majority of respondents felt that the snow began to fall approximately when it was forecast to begin, but a majority of respondents believed that more snow fell than was actually forecast. Verification of these measures is difficult, but analysis of the NWS forecasts suggests that both the timing and snowfall accumulation were reasonable, especially the last few updates prior to December 20.
In conclusion, adverse winter weather is associated with thousands of vehicle crashes, injuries, and fatalities each year in the United States. Nonetheless, little is known about how meteorological forecasts, meteorological conditions, and non-meteorological conditions combine to influence driving decisions. The December 20–21, 2006, winter storm along the Colorado Front Range provided an opportunity to advance our knowledge on decision making with respect to driving in severe winter storm conditions. Results from this study also provide a roadmap for additional studies, which ultimately should improve our understanding of the public’s sources, uses, and perception of weather forecast information, as well as how forecasts, observed weather, and non-meteorological conditions combine to influence people’s actions during hazardous weather events.
Acknowledgements
This research was funded by a Quick Response Research grant from the Natural Hazards Center at the University of Colorado. Special thanks to Julie Demuth for comments on the manuscript. Thanks to Larry Mooney (NWS) for providing archived NWS forecasts and other data related to the December 20-21, 2006, winter storm. Thanks also Matt Kelsch for providing an overview of the meteorological conditions during the winter storm. Finally, thanks to Julie Demuth, Eve Gruntfest, Jeff Lazo, Rebecca Morss, and the WAS*IS program; this would not have been possible without WAS*IS.
References
Andrey, J., and C. Knapper. 2003. Motorists’ perceptions of and responses to weather hazards. In J. Andrey and C. Knapper (eds.) Weather and Transportation in Canada. Department of Geography Publications Series Number 55. Waterloo: University of Waterloo.
Andrey, J., B. Mills, and J. Vandermolen. 2001. Weather Information and Road Safety. Institute for Catastrophic Loss Paper 15.
Andrey, J., B. Mills, M. Leahy, and J. Suggett. 2003. Weather as a chronic hazard for road transportation in Canadian cities. Natural Hazards 28:319–343.
Bandura, A. 1988. Self-efficacy conception of anxiety. Anxiety Research 1:77–98.
Couper, M.C. 2000. Web surveys: A review of issues and approaches. Public Opinion Quarterly 64:464–494.
Drobot, S.D., C. Benight, and E.C. Gruntfest. 2007. Risk factors associated with driving through flooded roads. Environmental Hazards, in press.
Federal Highway Administration (FHWA). 2007. Road weather snow and ice statistics. [www.ops.fhwa.dot.gov/weather/weather_events/snow_ice.htm]. Accessed June 2, 2007.
Hill, J.D., and L. Ng Boyle. 2007. Driver stress as influenced by driving maneuvers and roadway conditions. Transportation Research Part F 10:177–186. doi: 10.1016/j.trf.2006.09.002.
Kilpeläinen, M., and H. Summala. 2007. Effects of weather and weather forecasts on driver behaviour. Transportation Research Part F 10:288–299. doi: 10.1016/j.trf.2006.11.002.
National Oceanic and Atmospheric Administration (NOAA). Weather fatality statistics. [www.weather.gov/os/hazstats.shtml#]. Accessed June 2, 2007.
NOAA. 1999. Service Assessment: Oklahoma/Southern Kansas Tornado Outbreak of May 3, 1999.
National Research Council (NRC). 2003. Where the Weather Meets the Road: A Research Agenda for Improving Road Weather Services. Washington, DC: National Academies Press.
NRC. 2006. Fair Weather: Effective Partnerships in Weather and Climate Services. Washington, DC: National Academies Press.
Tables and Figures
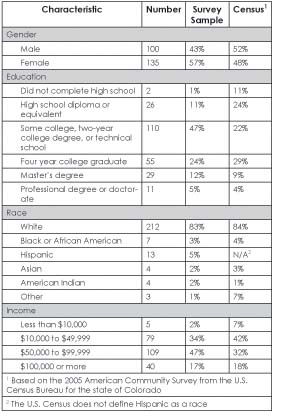
Table 1. Selected characteristics of the respondents.
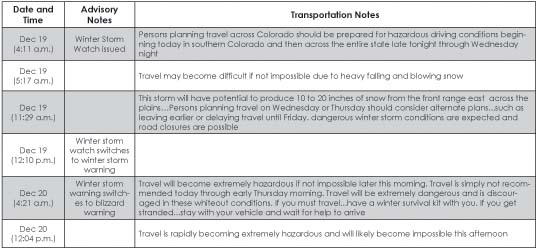
Table 2. Selected notes from NWS forecasts and updates.
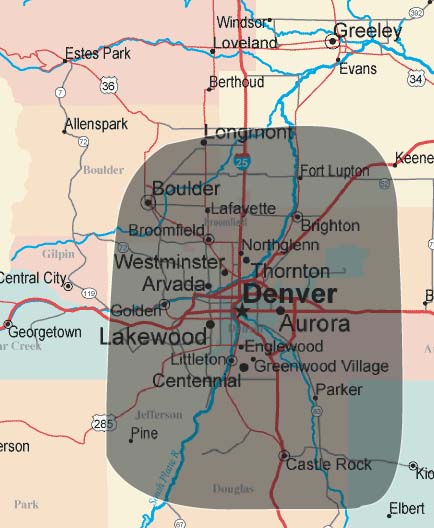
Figure 1.The study region, shaded gray, included much of the Denver metro area.
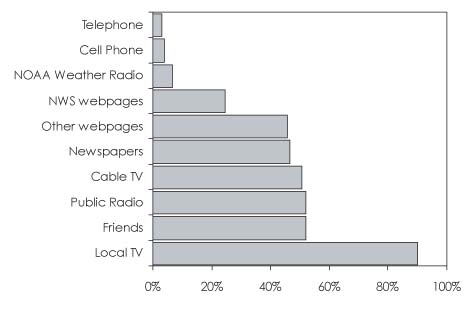
Figure 2. Percentage of respondents who obtain weather forecast information from various sources at least once per week. Respondents could select all that apply.
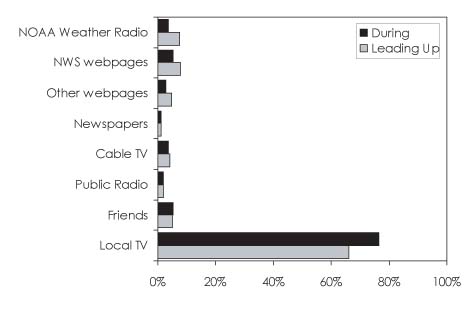
Figure 3. The main information sources for obtaining weather forecast information leading up to and during the December 20–21, 2006, winter storm. Respondents could only select one information source.
|
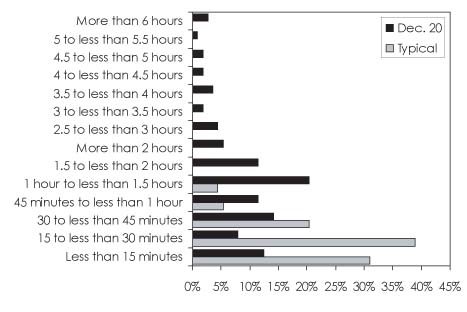
Figure 4. Frequencies of respondents’ typical and December 20, 2006, commute times.
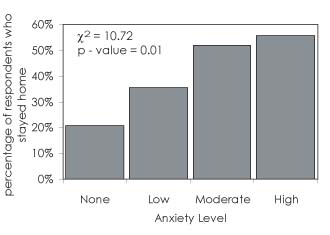
Figure 5. Percentage of people who left home on December 20, 2006, based on their self-reported level of anxiety related to driving in hazardous weather conditions.
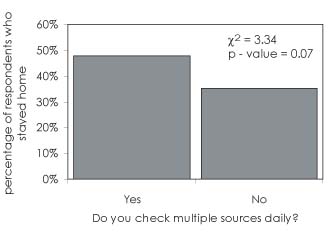
Figure 6. Percentage of people who stayed home on December 20, 2006, based on whether or not they obtain weather forecasts from multiple sources daily.
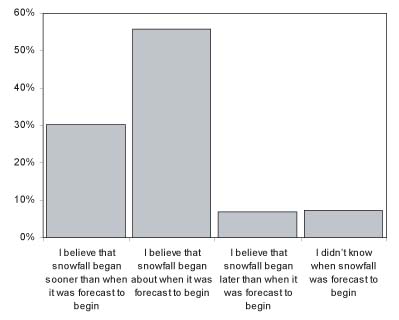
Figure 7. Respondents’ perceptions of the timing of the beginning of snowfall on December 20, 2006.
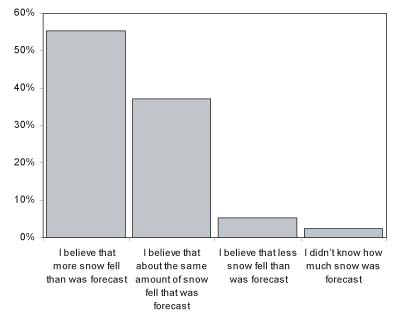
Figure 8. Respondents’ perceptions of the amount of snowfall during the December 20 – 21, 2006 winter storm.