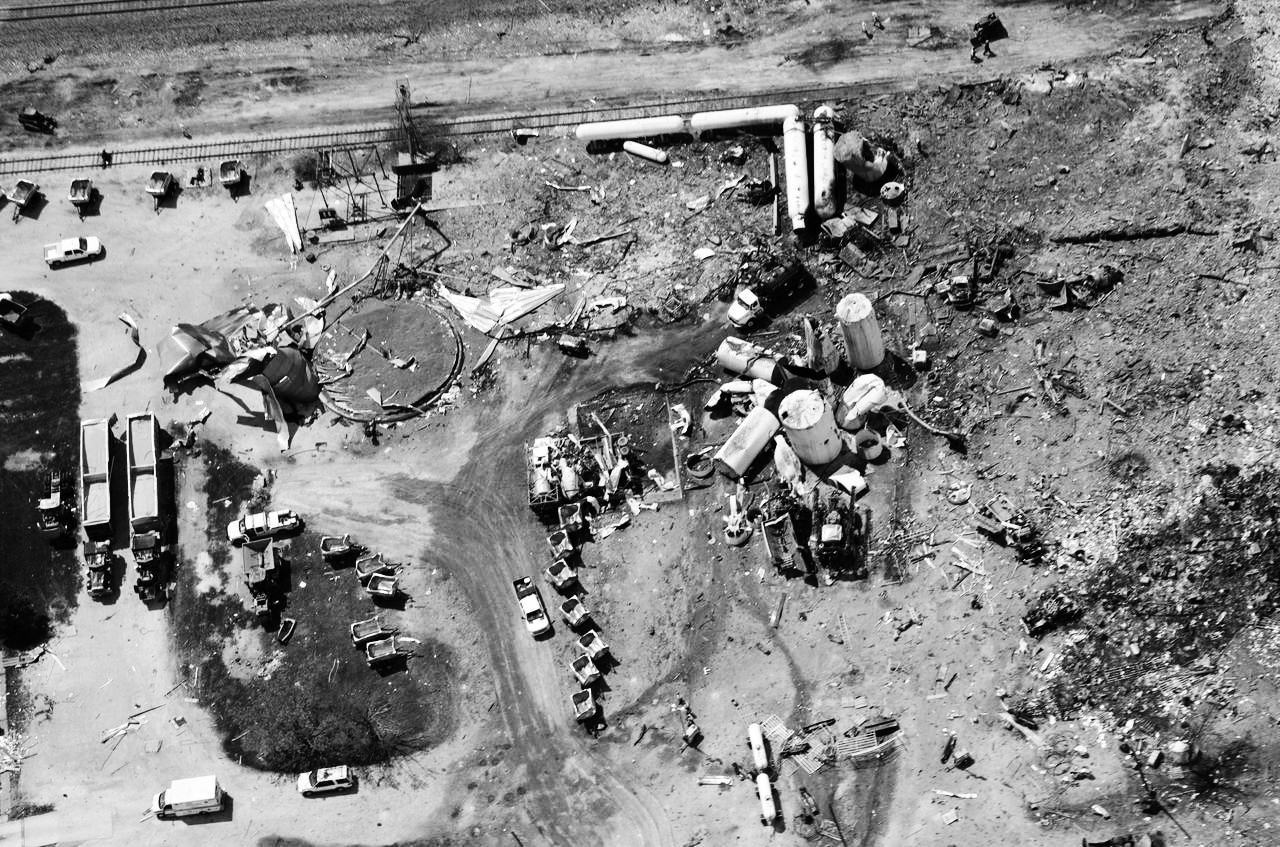
"Aerial photo taken from my plane" West Ferilizer Company Explosion © Shane Torgerson 2013
ON APRIL 17, 2013, only a few days after the Boston Marathon Bombing, an explosion roared through the West Fertilizer Company in the small town of West, Texas. The cause was unknown for several years, and speculation ranged from terrorism to accident to arson, until federal officials finally concluded, three years after the event, that is was in fact arson. Fifteen people lost their lives in the explosion, all but one of whom were first responders working to stop the fire that led to the explosion. The explosion was felt miles away and nearby structures were decimated, while damage to buildings extended over half the town. West Rest Haven, a nursing home situated about 200 yards from the fertilizer plant, started evacuating when the fire that led to the explosion began, but the blast knocked the ceilings, windows, and walls of the building before residents and staff had finished evacuating. The high school and the only apartment building on that side of town took such heavy tolls that they were unsalvageable. Fortunately, the explosion happened in the evening when the school was empty. After the explosion, all the town’s residents were evacuated, some for days and others for weeks. As many residents described in our research interviews, it was a miracle more people didn’t lose their lives that day.
The explosion in West happened 66 years and one day after the deadliest industrial accident in U.S. history. In 1947, two ships carrying fertilizer similar to those stored in West exploded in the Texas City harbor and killed 581 people. According to Hugh Stephens (1997), officials at the time noted that Texas City was ripe for an explosion. Some wondered why the city had allowed development of many industrial facilities around the harbor in such as way as to concentrate the danger. Similar questions hung in the air in the numerous meetings and official reports following the explosion in West.
Despite these disasters, fertilizer is still big business. Today, more than 1,300 facilities nationwide store the same type of chemical that exploded in West (Fernandez 2016). In just the 22 years between 1984 and 2006, 224 accidents occurred at ammonia-based fertilizer facilities alone, killing 50 people across the U.S. (LeCompte 2013). For all these facilities and especially for the many other fertilizer facilities located near schools, nursing homes, or hospitals, understanding the potential damage and recovery outcomes of such events is crucial to developing response and recovery plans as well as informed future land-use decisions.
To address this need, we, together with colleagues from the Hazard Reduction and Recovery Center at Texas A&M University, developed an ongoing visual and geographic assessment of damage and rebuilding of West. This dataset offers a visual and spatial understanding of how the explosion affected homes in West, and how the explosion, along with other indicators, such as housing value and structure age, predict rebuilding at year 1. This research provides detailed information about the potential consequences of fertilizer facilities. The data can be used to support community planning and provide information to local residents about what risks exist in their backyards.
Visual imagery in disaster research
As with most other disasters today, a quick internet search for the West explosion yields hundreds of visuals. Both journalists and charities use images of suffering and damage to convey need as well as to increase pledges of donations following a disaster. Yet such images have been underutilized by researchers studying disaster impacts and recovery.
Observation through the use of systematic photographs or video has grown in popularity across sociology, criminology, and public health, among other disciplines, as a method to assess neighborhood-level effects on various individual and group outcomes. For example, video recordings have been used to assess disorder and crime in urban environments (Sampson and Raudenbush 1999) and Google Street View™ has been used to assess neighborhood features that affect children’s health outcomes (Odgers et al. 2012) and gentrification (Hwang and Sampson 2014).
Only a few disaster scholars have employed visual imagery to conduct damage or recovery assessments, and they have focused on natural disasters, not technological events (Curtis & Mills 2012; Curtis & Fagan 2013; Mills et al. 2010). Curtis and Fagan (2013), for example, conducted an analysis of the 2011 Joplin, Missouri, tornado to compare mortality risk to structure damage. Curtis, Duval-Diop, and Novak (2010) used multiple video cameras equipped with GPS systems to collect visual images of the Holy Cross neighborhood of New Orleans following Hurricane Katrina. They found clear neighborhood-level patterns of recovery and abandonment, but spatial heterogeneity was apparent at the parcel-level within every neighborhood. In other words, abandonment and rebuilding existed in neighboring homes that had experienced similar physical affects from the disaster.
Using the same dataset, Curtis and Mills (2011) linked recovery to crime, finding that streets with more recovery activity had lower crime in 2007 and 2009 than other streets. Burton et al. (2011) used repeat photography rather than video to document recovery from Hurricane Katrina. They took four photos every six months over a three-year period at 131 sites. They scored each site on rebuilding using a four-point scale, and then aggregated the scores to the community level. They found patterns of recovery across communities over the three years, but also variation within each community. Higher levels of damage were correlated with lower levels of recovery, especially in the earliest time periods following the storm. This correlation became weaker three years after the hurricane, implying that other factors, such as pre-event household resources and vulnerabilities, affected long-term recovery above and beyond the disaster damage.
For technological events, disaster scholars have not used images. Instead, they have focused on changes in community cohesion, mental health, and social capital that occur while litigation and blame pull the community apart (Ritchie et al. 2013; Ritchie & Gill 2007). There has been no use of visual imagery for technological disasters, such as explosions, and few studies include analysis of rebuilding rates at all, let alone at the house level.
For small, rural communities, aggregate analyses, like those following Hurricane Katrina, are often not useful because data on economic and social characteristics are not available at a small enough scale to capture variation within small communities. West, for example, has only two Census block groups, which is the smallest publically available unit of analysis for basic demographic data, such as race and income. The explosion occurred in only one of those block groups, so aggregate analyses would be futile. Parcel-level analyses are the only way to understand variation in damage and recovery in this small town.
West, Texas
West, Texas is located just north of Waco along Interstate 35. Though relatively close to a metro area, West has the feel of a small town. In fact, many people we spoke with rarely made the 15-minute drive into Waco. West has a population of roughly 2,900, is nearly 90 percent white, and boasts a Czech heritage. Expressions of such pride include the “Czech Stop” gas station on the interstate, which sells fresh and frozen kolaches, a Texas-Czech breakfast bakery treat. West’s median household income was $36,000 in 2010, much lower than the Texas median household income of $51,900. The West Fertilizer Company facility was located at the northeastern corner of the town and separated from the nearest houses by a railroad track. Because it had been there for several decades, before the subdivisions and high school were built next to it, residents said they never worried about the potential danger.
Following the explosion, local emergency management officials divided the city into three zones based on extent of damage to delineate who could safely reenter their properties. Zone 1 was the farthest from the plant and had little damage. Zone 2 suffered more damage and residents were evacuated for more than a week. Zone 3 suffered the most extensive damage; residents were prevented from reentering for several weeks. Map 1 shows the town, the location of the fertilizer facility, and the zones.
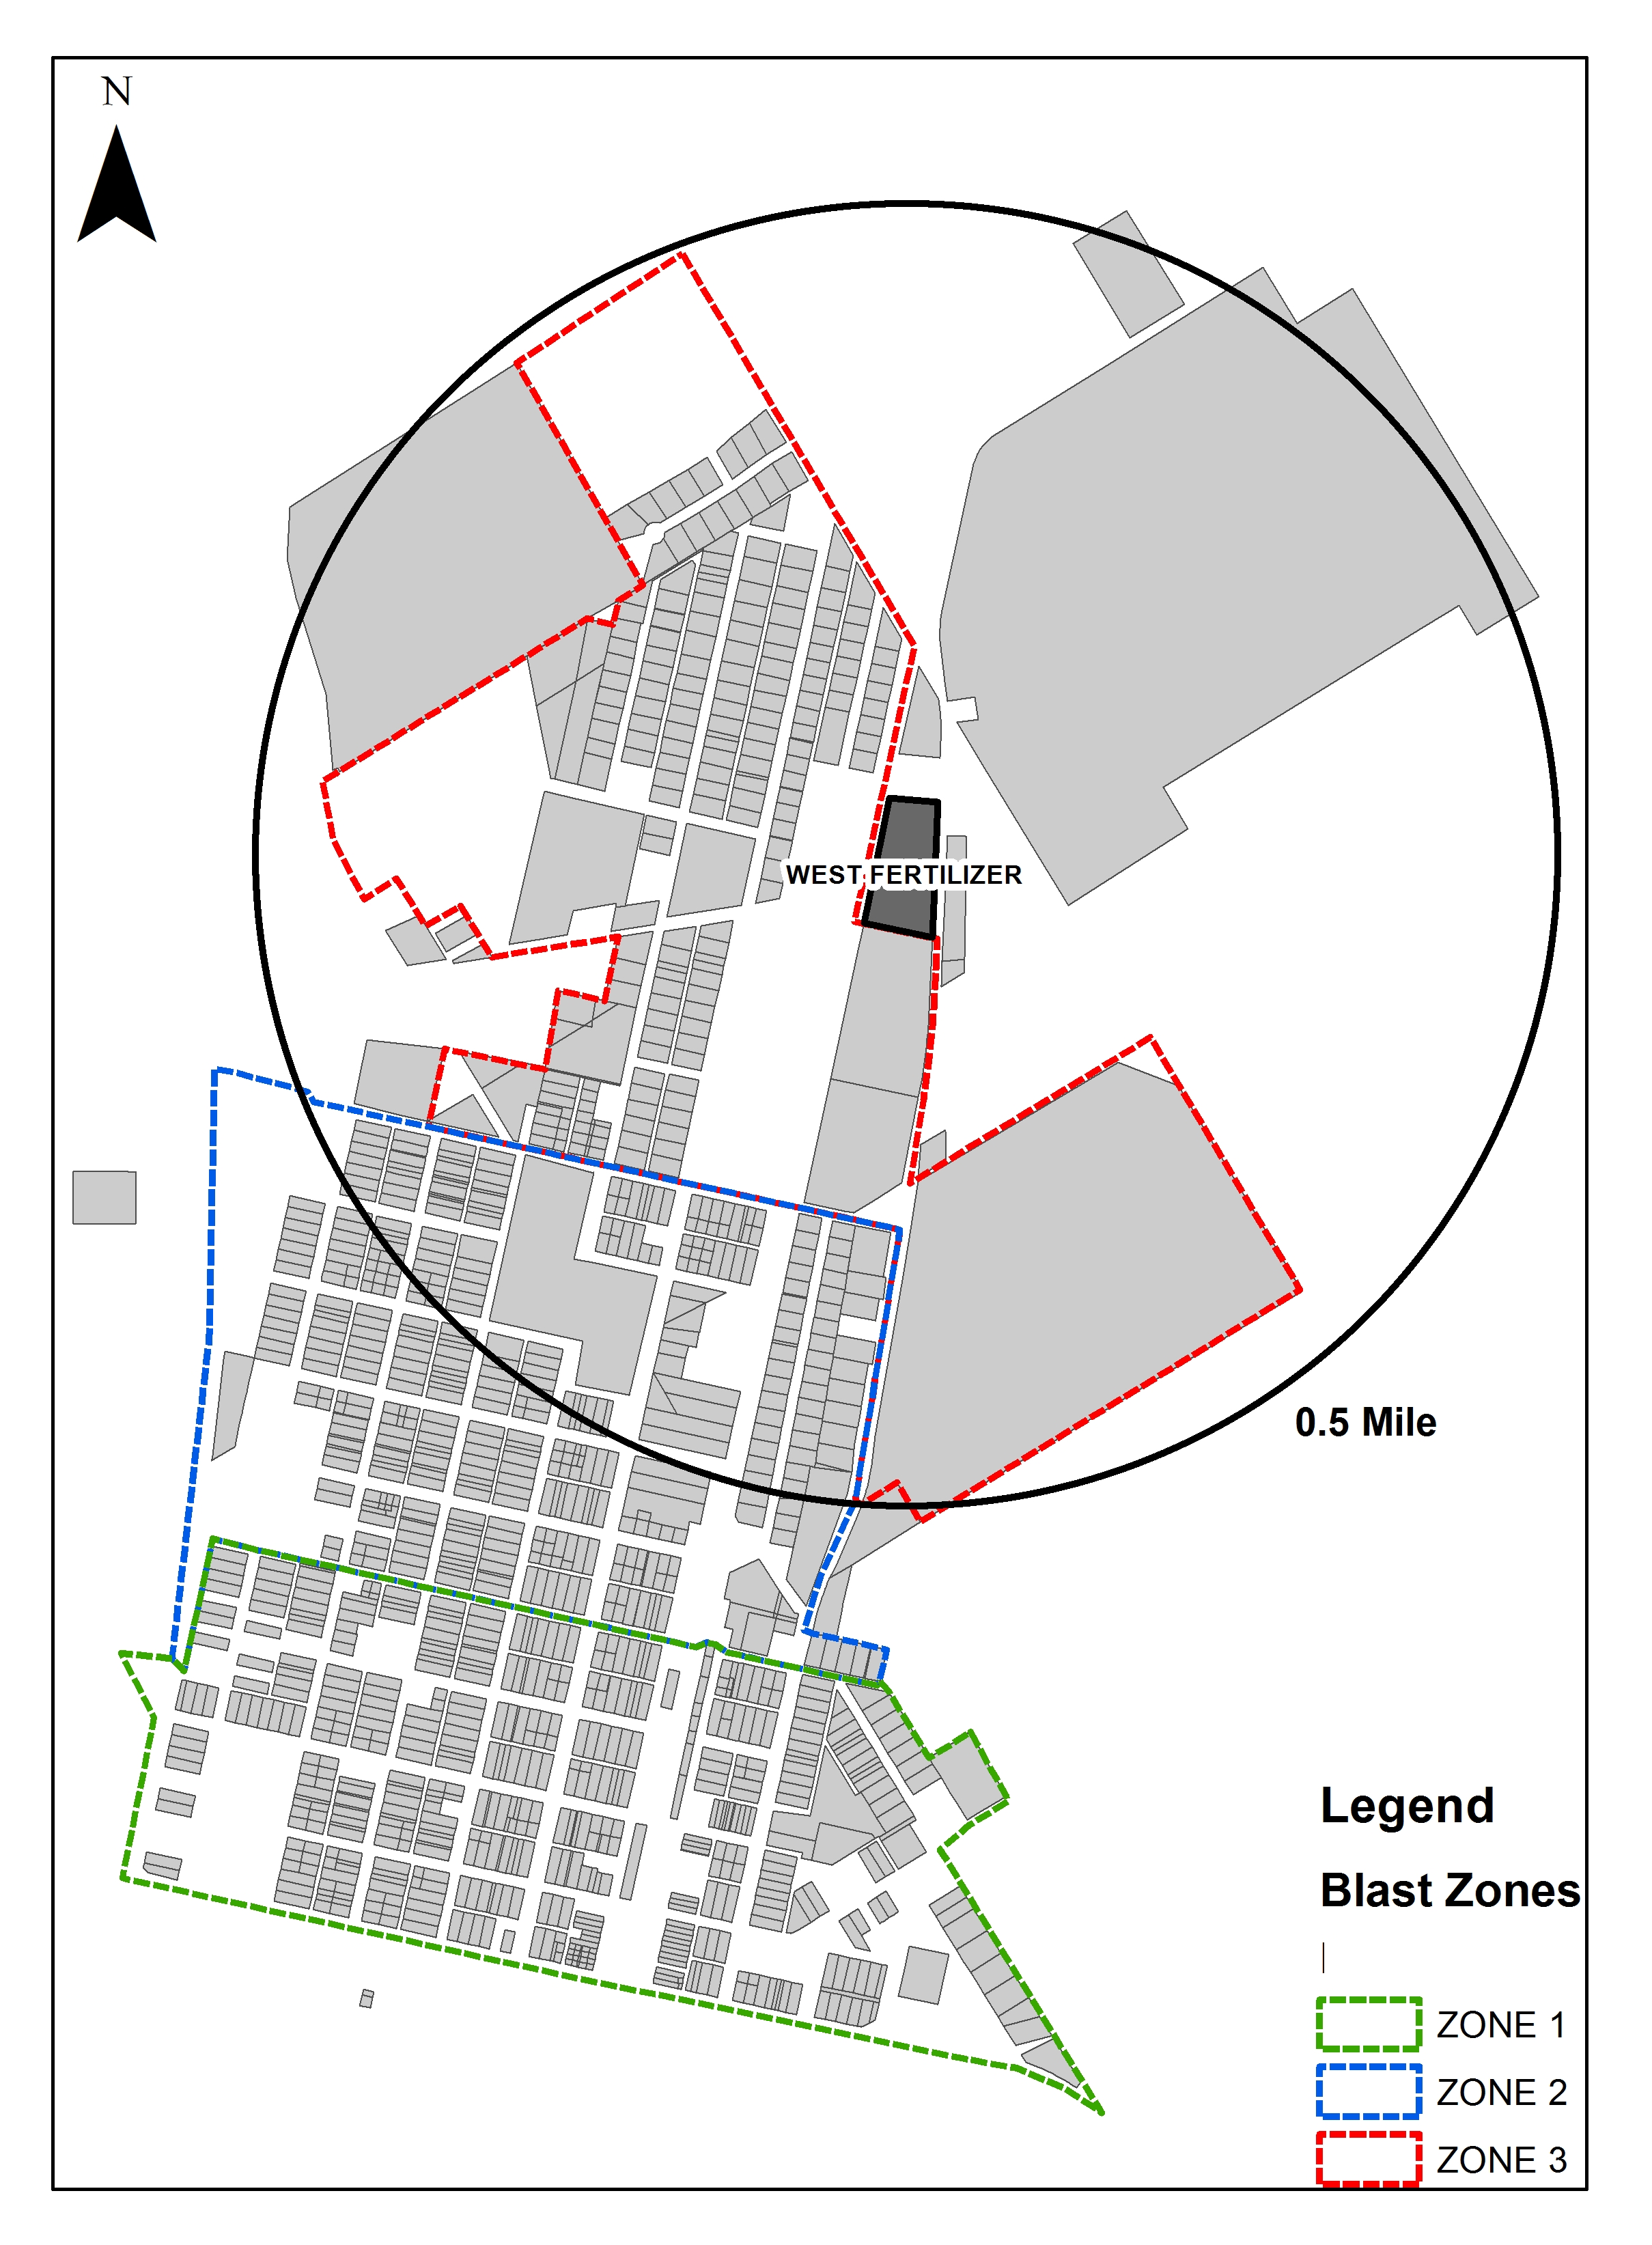
Map 1. West, Texas Blast Zones and Parcels
These zones became important determinants of not only reentry but also tax revenue. County appraisers used the blast zones as markers for setting reassessment values for the remainder of 2013. Any property within Zone 3 was reassessed for $0 for the reminder of the 2013 tax year. Buildings in Zone 2 were reassessed at 90 percent of their previous improved value. Zone 1 properties retained their previous 2013 values. This allowed for very quick reassessment, but is unusual, as most communities have full, visual reassessments of each property following disasters. This reassessment process eliminated our ability to use just tax value as indicators of damage or rebuilding, because the tax value was not indicative of actual damage sustained.
A resident of West reported to us that in the first few days following the explosion, and on the heels of the terrorist attack in Boston, the federal government requested Google to conduct a new Street View™ for the city to collect any potential evidence in case this, too, was an act of terrorism (Personal Interview 2014). Google uses a camera on top of a car to collect Street View images. The company has amassed images of buildings as viewed from the street on all seven continents. Google did the new imagery of West within two to three days of the explosion. We used this opportunity to download three images of 389 structures located in zones 2 and 3, the most heavily damaged zones. These images included a left view, center view, and right view of the structure. We removed public buildings from our sample to focus on housing and also removed the one apartment building, which was totally destroyed and has not been rebuilt. We also encountered some issues related to data collection via Google Street View. First, there were several time hops, in which the image on Google “hops” from one time period to another with a slight movement of the mouse (Curtis et al. 2013). Some houses were only viewable for June 2013, and had already been demolished by then; others were only viewable for 2008 before the explosion. Other homes were blocked by trees or trucks. We ended up with useable images from 351 houses in West. In June 2014, we used a Digital SLR camera and took the same photos again to document how much rebuilding had reoccurred. We have images from 2015 and 2016 as well, and we are undertaking a longitudinal analysis.
To assess the damage to the parcels, we adapted methods used by Curtis and Fagan (2013) for assessing tornado damage. The Tornado Injury Scale (TIS) is used to understand the risk of injury or death for a person in structures of various damage levels, ranging from 0 (no damage) to 9 (complete structural collapse). We scored the images separately and then conducted inter-rater reliability tests that showed very high correlation between our ratings. Image 1 shows selected levels of damage.
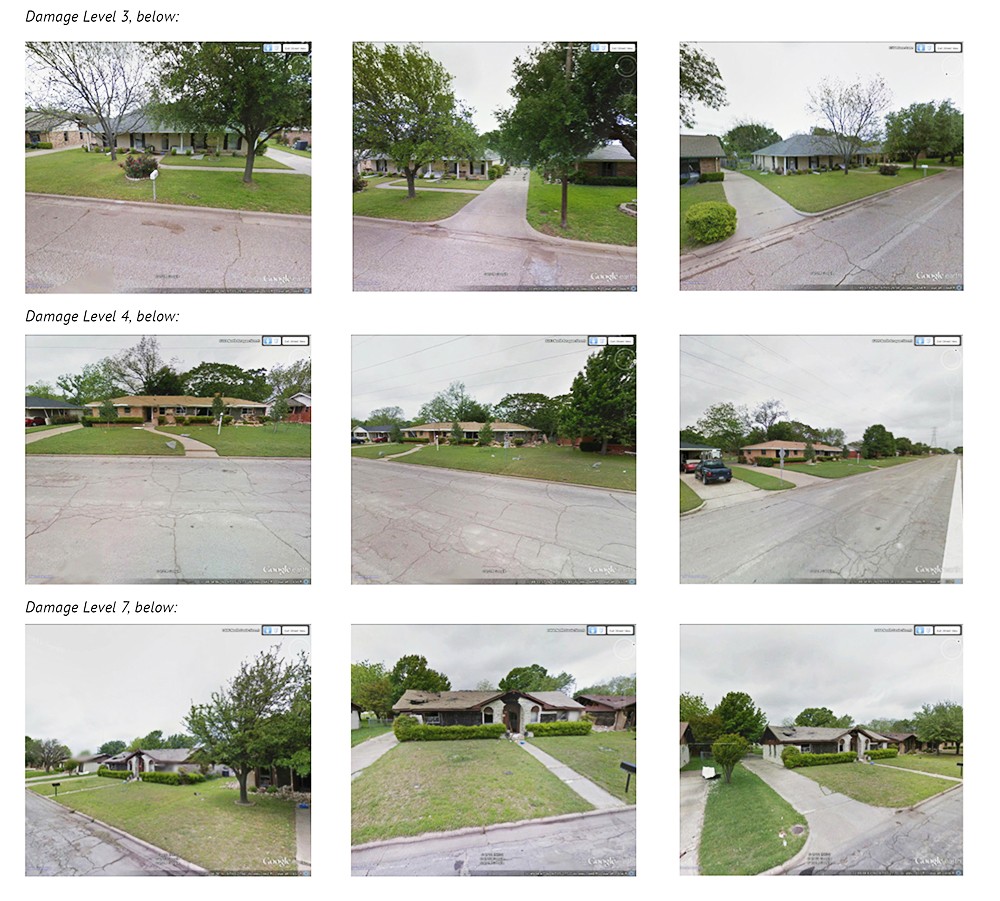
Image 1. Selected Levels of Damage
For the photos from 2014, we used the recovery scale from Curtis, Duval-Diop, and Novak (2010), which is similar to that used by Burton and colleagues (2011) to assess rebuilding rates at Year 1: 1) Damaged structure remains, 2) Cleared lot, 3) Emerging structure/ construction underway, 4) Completed structure.
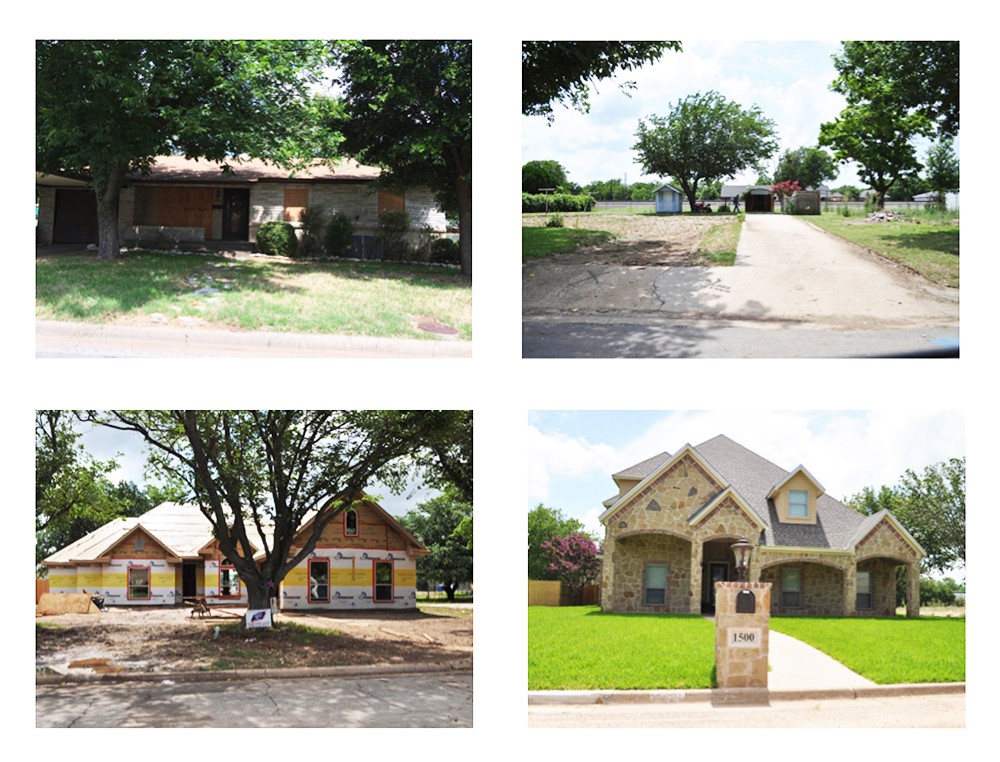
Image 2. Recovery Score Examples, 1 top left, 2 top right, 3 bottom left, 4, bottom right.
Distance Matters for Damage
The majority of structures within our sample received damage scores of less than 4, as shown in Figure 1. In fact, 21 percent of the structures showed no visible damage in the Street View images. Reviewing Map 2 of the location of structures by damage score shows the expected pattern of greater damage closer to the fertilizer facility. The most extensive damage seems to have occurred within 0.2 miles of the facility.
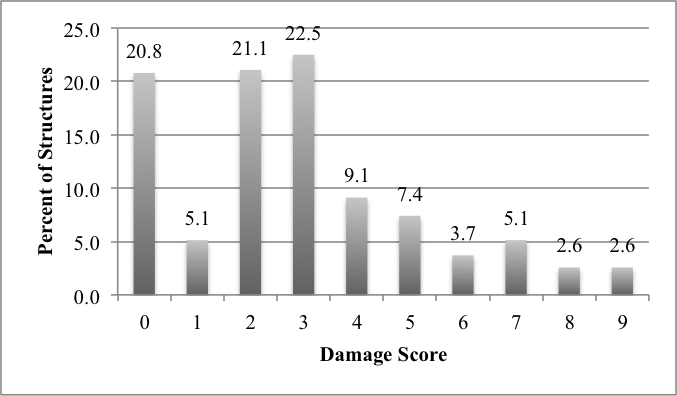
Figure 1. Percent of structures damaged (n = 351)
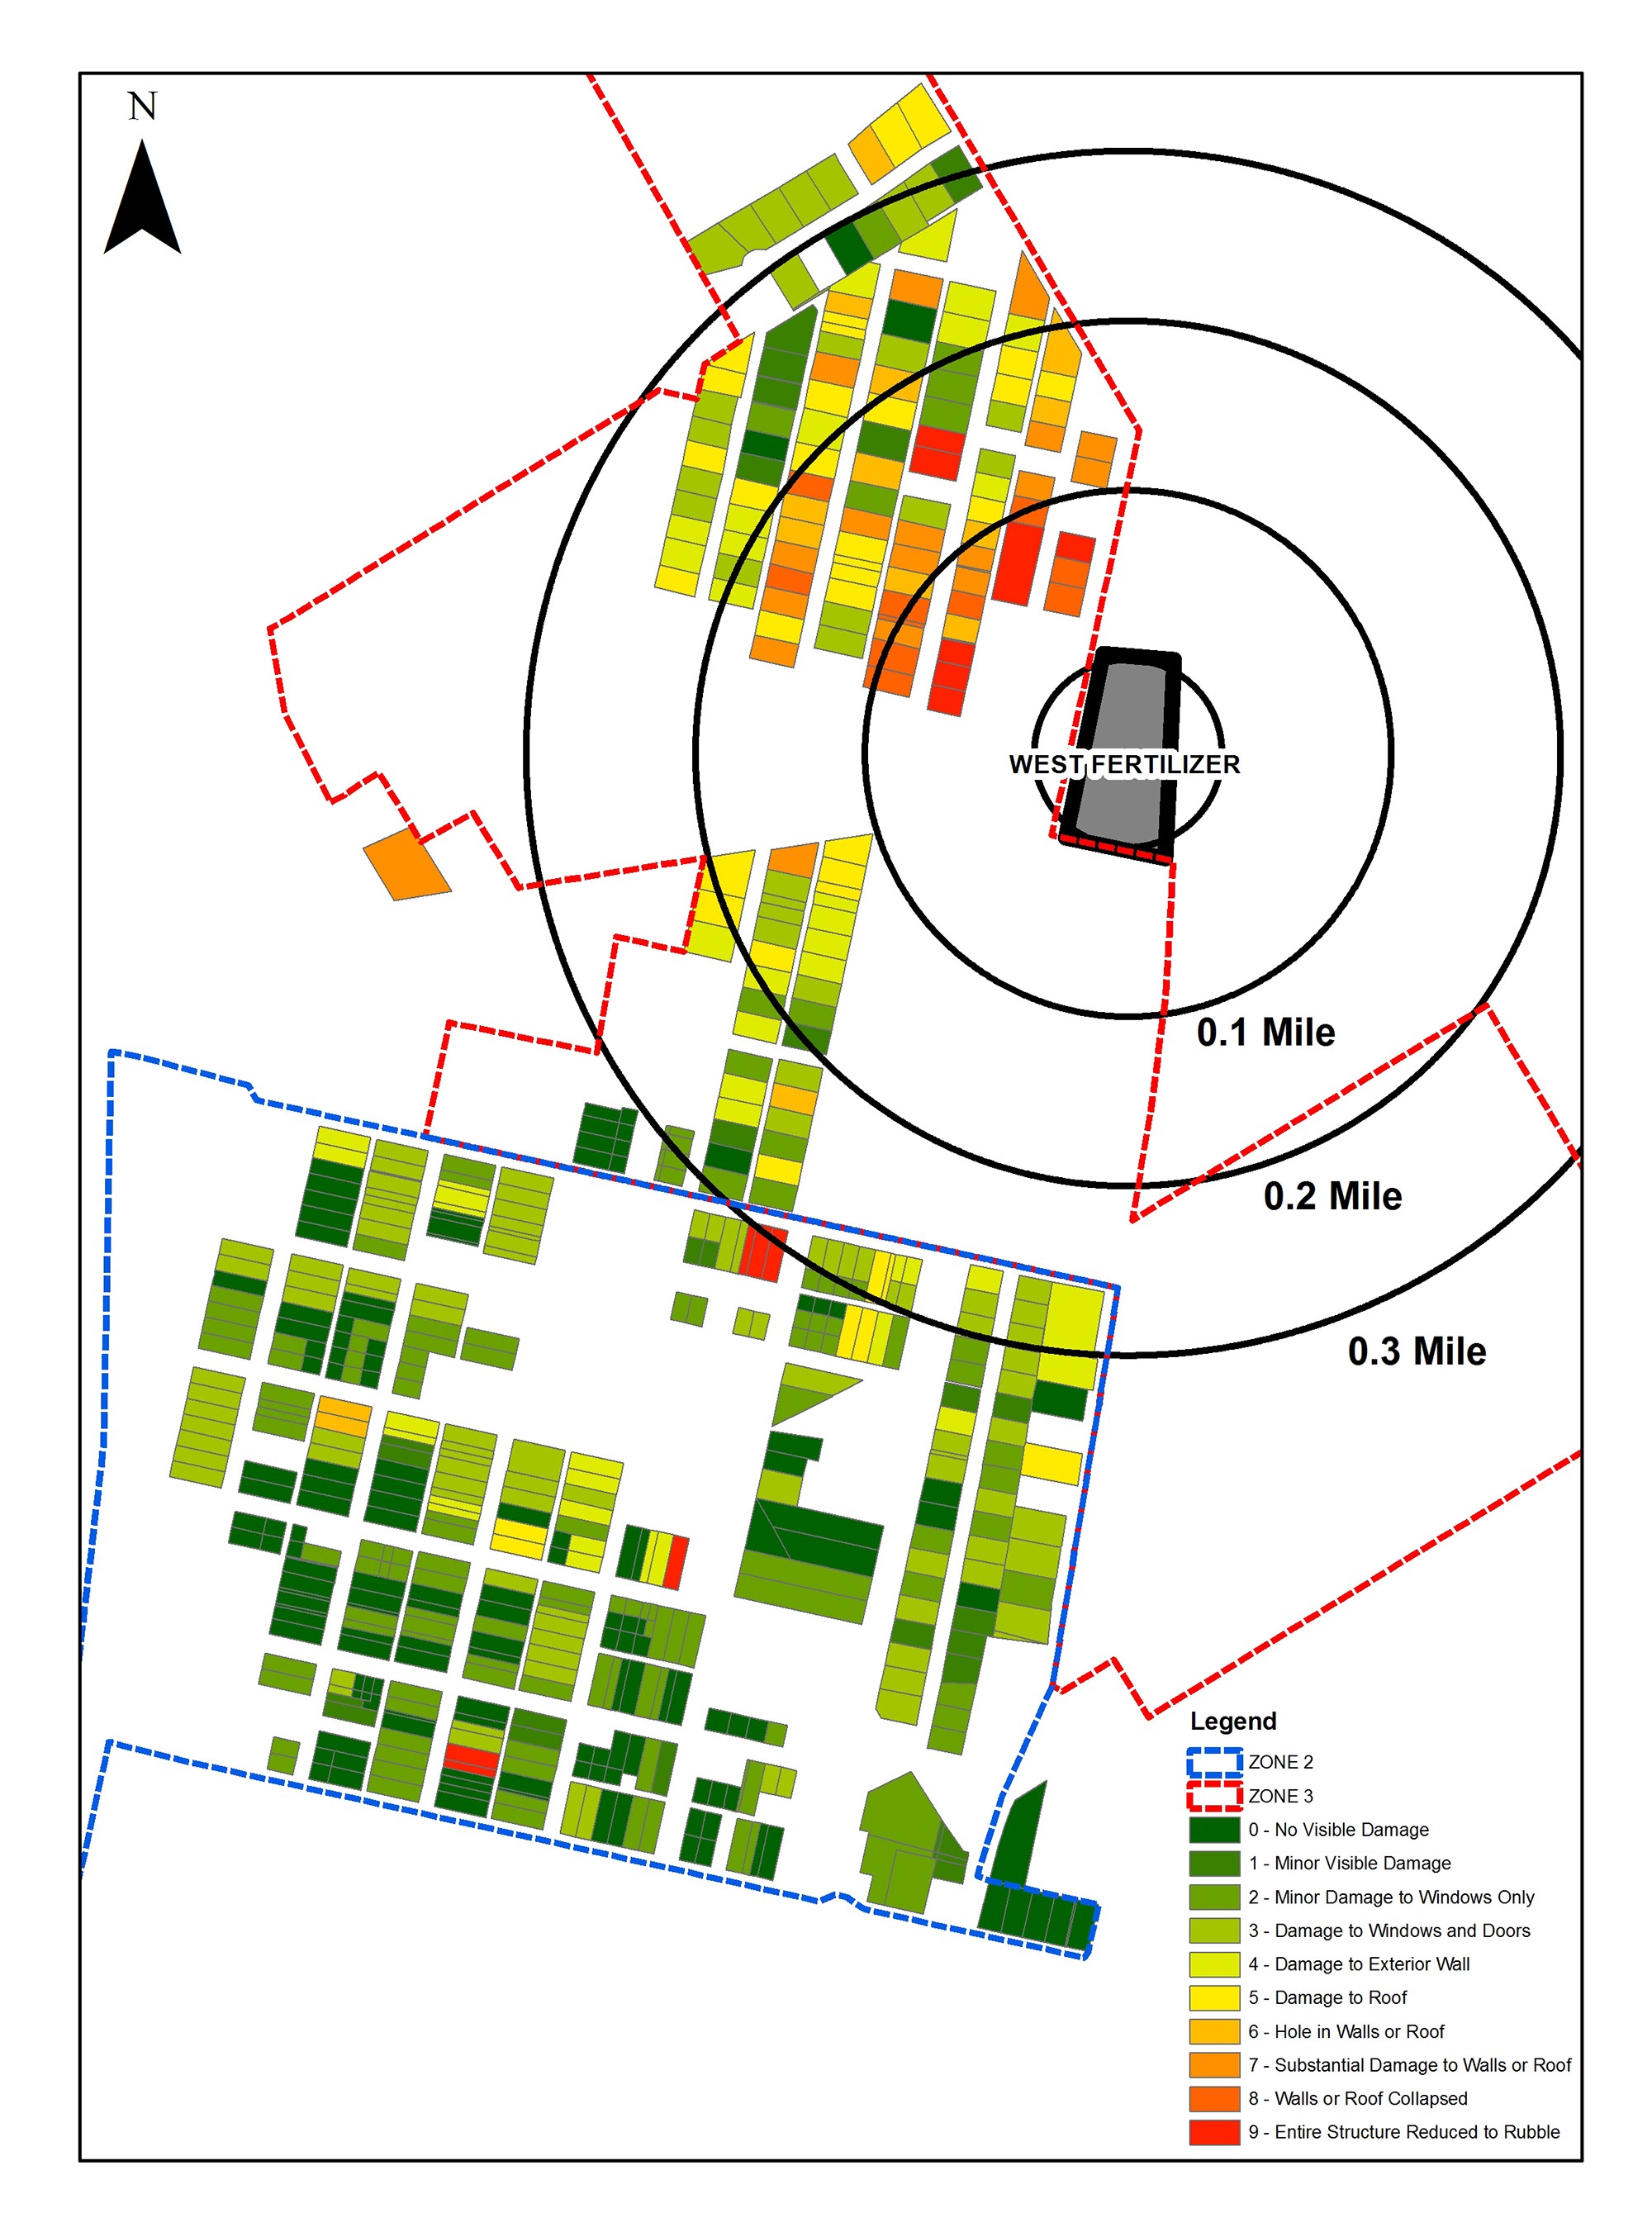
Map 2. Map of Parcels with Damage Scores and Distance from Explosion
To assess this visual result, we used ordinal regression to predict damage score based on distance from the facility (in 0.1 mile increments) along with structure age and value. Ordinal regression is a statistical technique designed specifically for variables that are ordered scales, such as the damage scale that ranges from 0 to 9. It allowed us to determine what independent variables explain variation in damage score. Because socioeconomic data is not available for individual households, we use housing value as a proxy for economic assets. Although this is an imperfect indicator of resources that households may have, houses are primary components of wealth in the U.S. and housing value does correlate with income. Distance from the facility had a statistically significant effect on damage score, while neither structure age nor value did. Specifically, for each 0.1 mile farther from the facility, the odds of increasing one point on the damage scale were reduced by more than 60 percent.
Price matters for recovery
We completed the same analyses for the photos taken at Year 1. In our sample 66 percent of the houses were fully rebuilt within one year of the explosion. Only 4 percent still had visible damage in 2014. Nearly one-fifth of all houses assessed had been demolished but no rebuilding had begun. Looking at Map 3 of recovery scores, no clear pattern has emerged showing where rebuilding is happening and where it is not.
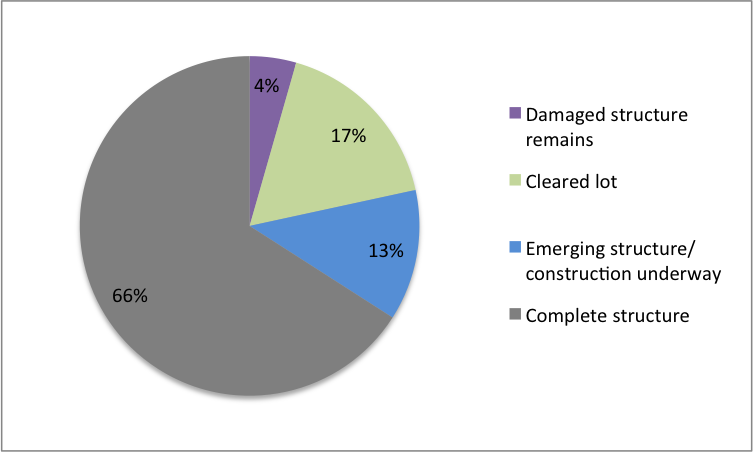
Figure 2. Rebuilding Year 1.
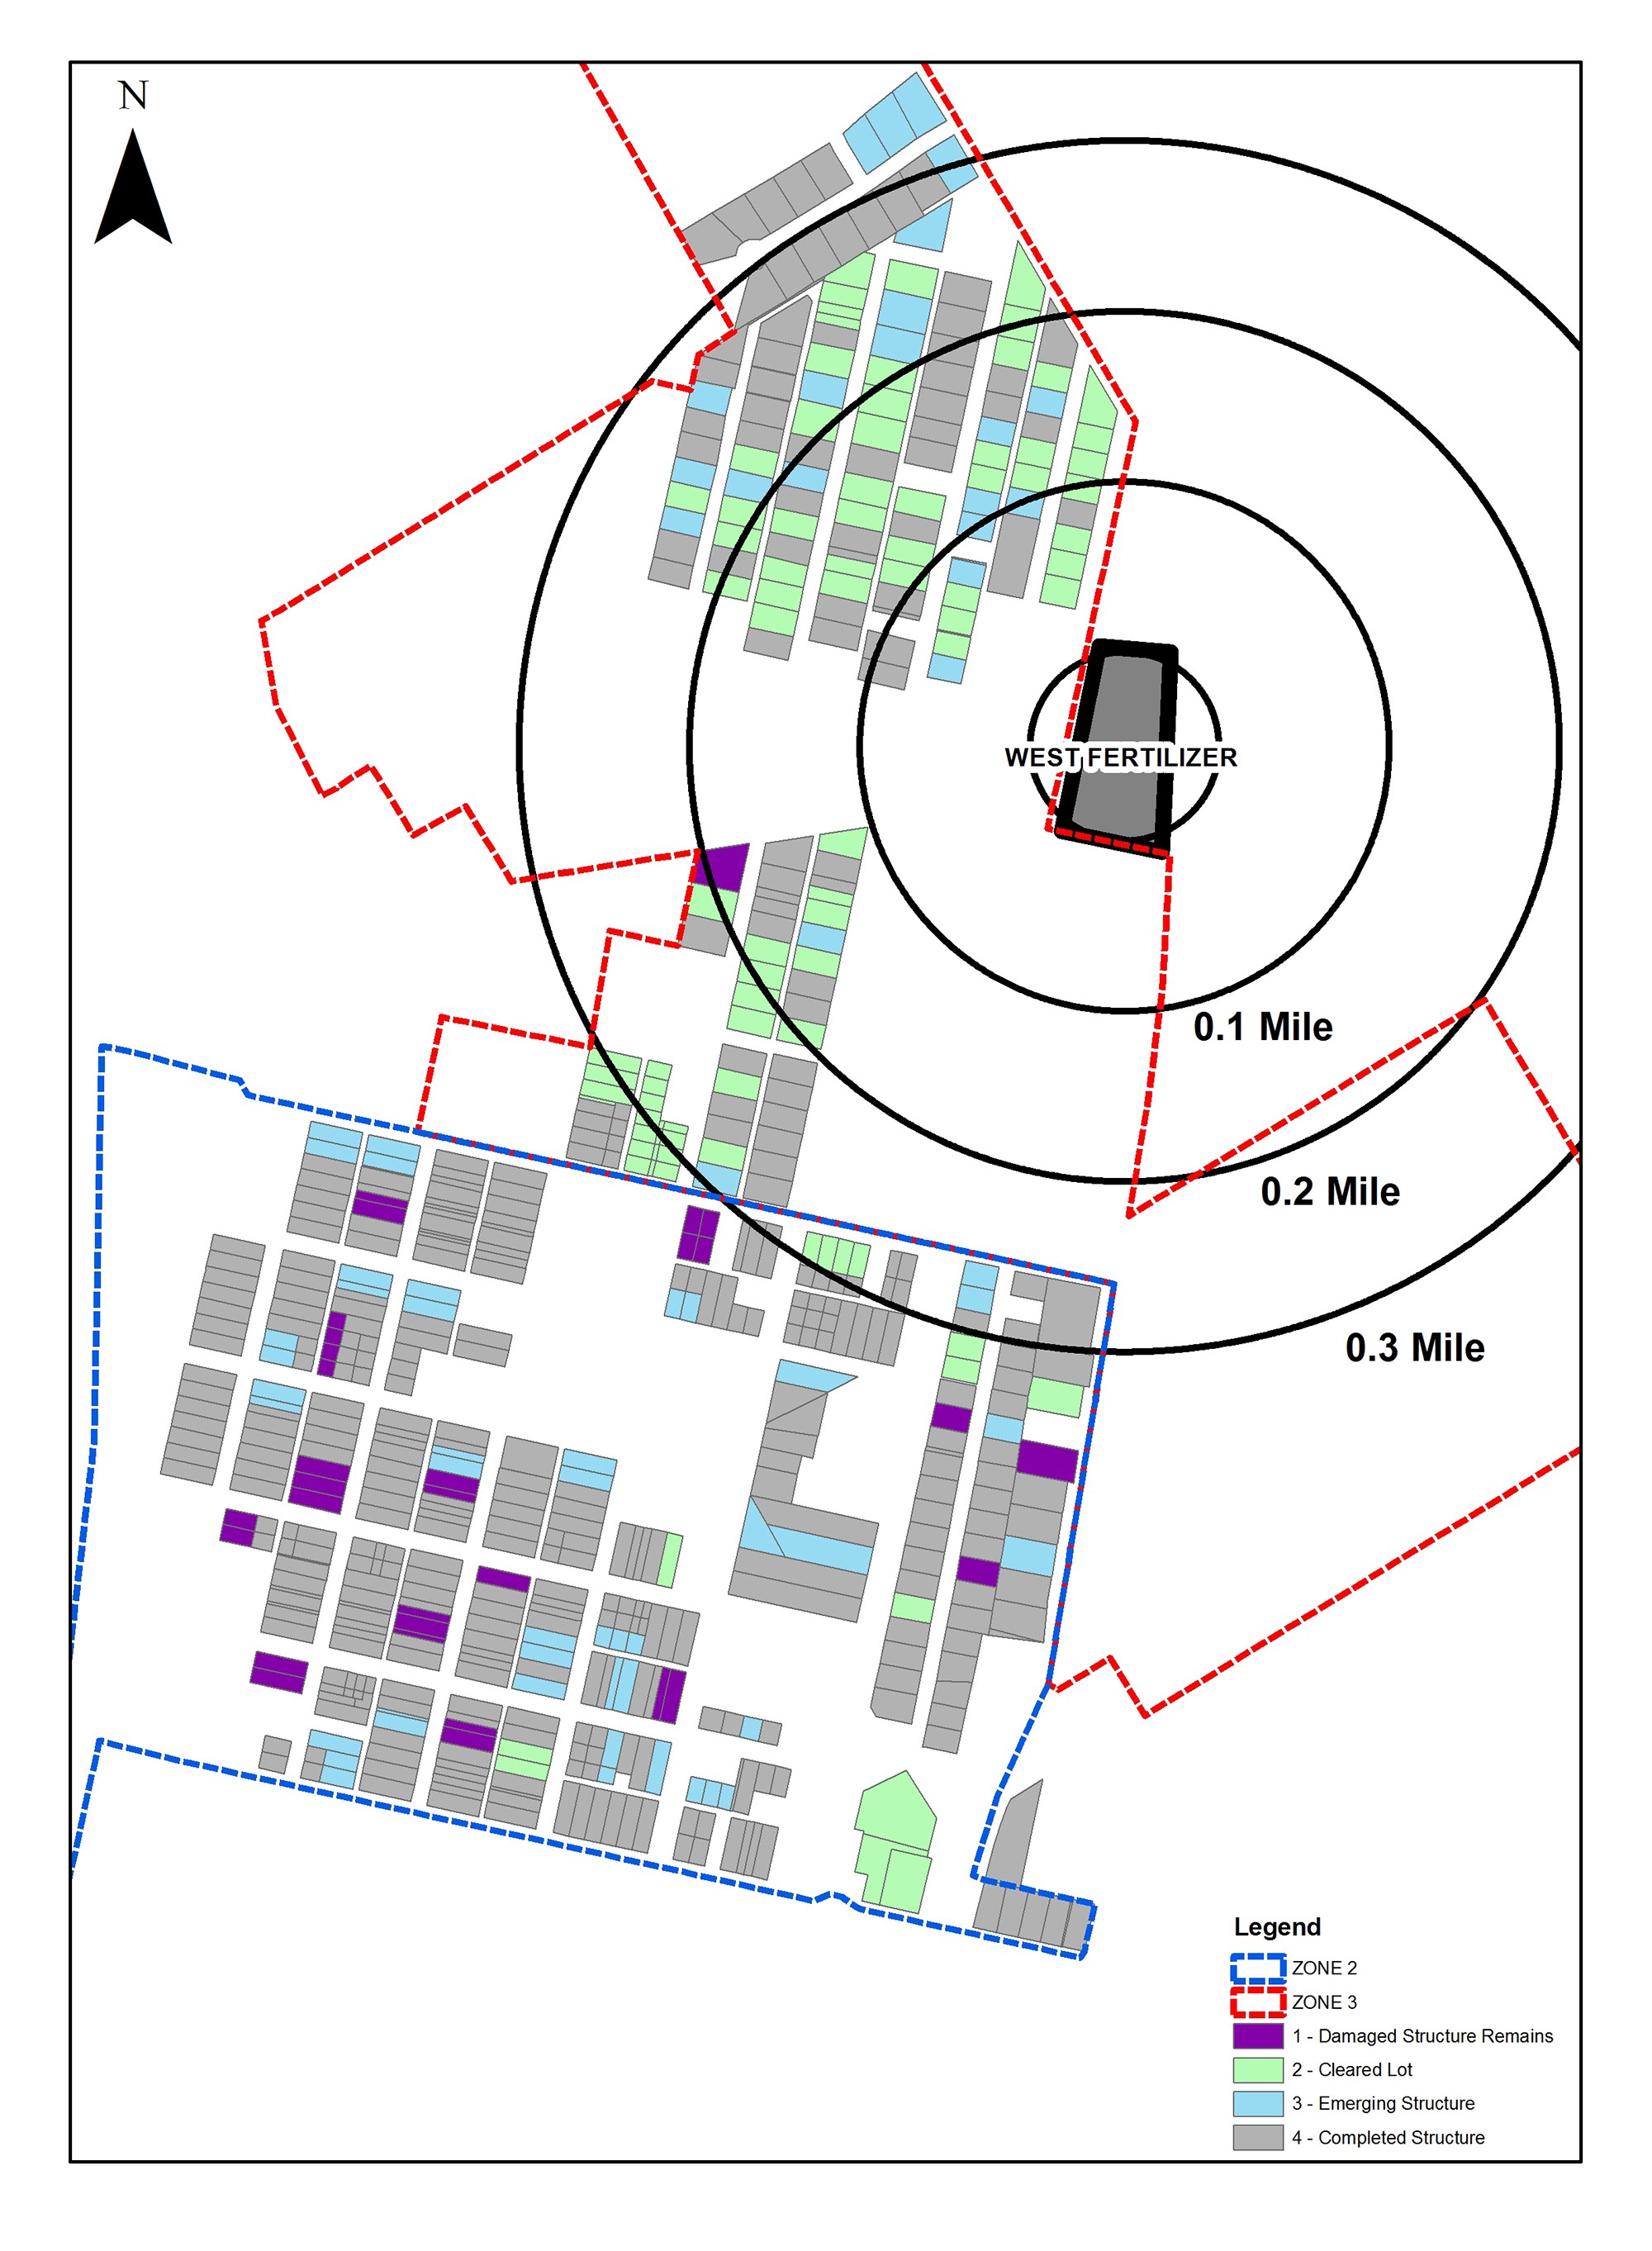
Map 3. Map of Parcels with Recovery Scores and Distance from Explosion
Again, we used ordinal regression to predict recovery scores based on damage level, structure value, and structure age. Comparing damage score to recovery score alone, we did find that structures with more damage were less likely to have higher recovery scores, as we predicted. But, this model of damage alone did not explain much variance in recovery scores, meaning that damage was a poor predictor of recovery scores. Instead, structure value before the explosion was the best predictor of recovery score. Each $10,000 increase in assessed value increased the odds of a 1-point higher recovery score by nearly 50 percent. Age of the structure, on the other hand, had little effect on recovery score. These results confirm our hypotheses that characteristics of the house (and potentially household) are better predictors of recovery than damage alone.
Will we learn from West?
Our results suggest that land-use controls limiting development near hazardous facilities are crucial to reduce damage, and that even small buffer zones can reduce damage from an explosion. In this case, each one-tenth of a mile from the explosion dramatically reduced the damage to houses. Thus, tighter limitations on development that provide a buffer of at least a half mile around the facility could have eliminated a large proportion of the damage in this disaster. For other communities, determining the contents and potential explosion area will aid in setting buffer zones around hazardous facilities to reduce impacts from future technological disasters, as well as to develop evacuation plans and better insurance coverage for houses near these facilities.
We expected this conclusion. Land-use controls and zoning are notably absent in many Texas communities, and numerous urban planning experts have placed blame on the zoning inadequacies for this explosion, just as they did with the Texas City explosion 66 years earlier.
Understanding the layers of regulations (city versus county versus state) is important for better future coordination of buffer zones and development decisions. The West Fertilizer Company facility was built prior to development in the area and was outside of city limits. That meant it reported to and was under land-use regulation from the county rather than the city. Because of this issue, the City of West could not regulate the facility itself and lacked control over emergency management protocols that involved the facility. This lack of coordination was problematic in that people living and working near a facility could not fully grasp the risk and then demand accountability.
Although distance from the plant was the most significant predictor of damage, housing value in 2013 was the strongest predictor of rebuilding at year 1. More expensive houses were more likely to have higher recovery scores, and some houses farther away from the explosion with limited damage remained damaged one year later. A buffer would reduce major damage, but distance is less important in predicting rebuilding following an event. One conclusion we have reached is that buffers may be even more important in low-income areas where homeowners will have a tougher time rebuilding on their own following an incident. Our results show how economic status affects homeowner disaster recovery and confirms results from research in large disasters, such as Hurricanes Andrew, Katrina, and Ike that show disparities in recovery based on pre-existing social and economic characteristics. But our analyses add the layer of socioeconomic status to rebuilding from technological disasters and in rural communities, both of which are understudied. Without the ability to use Census data to determine variation of recovery by neighborhood, the use of parcel characteristics and visual damage and recovery assessment provide a way for future research and for community planners to understand social vulnerability consequences for disaster recovery in small or rural areas and more accurately describe the individual impacts and losses from disasters.
References
Burton, Christopher, Jerry T. Mitchell, and Susan L. Cutter. 2011. "Evaluating Post-Katrina Recovery in Mississippi using Repeat Photography." Disasters 35: 3: 488-509.
Curtis, Andrew, Dominique Duval-Diop, and Jenny Novak. 2010. "Identifying Spatial Patterns of Recovery and Abandonment in the Post-Katrina Holy Cross Neighborhood of New Orleans." Cartography and Geographic Information Science 37: 1: 45-56.
Curtis, Andrew, and Jacqueline W. Mills. 2011. "Crime in Urban Post-Disaster Environments: A Methodological Framework from New Orleans." Urban Geography 32: 4: 488-510.
Curtis, Andrew, and Jacqueline W. Mills. 2012. "Spatial Video Data Collection in a Post-Disaster Landscape: The Tuscaloosa Tornado of April 27th 2011." Applied Geography 32: 2: 393-400.
Curtis, Andrew, and William F. Fagan. 2013. "Capturing Damage Assessment with a Spatial Video: An Example of a Building and Street-Scale Analysis of Tornado-Related Mortality In Joplin, Missouri, 2011." Annals of the Association of American Geographers 103: 6: 1522-38.
Curtis, Jacqueline W., Andrew Curtis, Jennifer Mapes, Andrea B. Szell, and Adam Cinderich. 2013. "Using Google Street View for Systematic Observation of the Built Environment: Analysis of Spatio-Temporal Instability of Imagery Dates." International Journal of Health Geographics 12: 1: 1.
Ferdandez, Manny, "Many Fertilizer Plants are Poorly Located and Regulated, Says Report on 2013 Blast" The New York Times, January 28, 2016.
Hwang, Jackelyn, and Robert J. Sampson. 2014. "Divergent Pathways of Gentrification: Racial Inequality and the Social Order of Renewal in Chicago Neighborhoods." American Sociological Review 79: 4: 726-51.
Mills, Jacqueline W., Andrew Curtis, Barrett Kennedy, S. Wright Kennedy, and Jay D. Edwards. 2010. "Geospatial Video for Field Data Collection." Applied Geography 30: 4: 533-47.
Odgers, Candice L., Avshalom Caspi, Christopher J. Bates, Robert J. Sampson, and Terrie E. Moffitt. 2012. "Systematic Social Observation of Children's Neighborhoods using Google Street View: A Reliable and Cost-effective Method." Journal of Child Psychology and Psychiatry 53: 10: 1009-17.
Ritchie, L. A., D. A. Gill, and C. N. Farnham. 2013. "Recreancy Revisited: Beliefs about Institutional Failure Following the Exxon Valdez Oil Spill." Society & Natural Resources 26: 6: 655-71.
Ritchie, Liesel Ashley, and Duane A. Gill. 2007. "Social Capital Theory as an Integrating Theoretical Framework in Technological Disaster Research." Sociological Spectrum 27: 1: 103-29.
Sampson, Robert J., and Stephen W. Raudenbush. 1999. "Systematic Social Observation of Public Spaces: A New Look at Disorder in Urban Neighborhoods." American Journal of Sociology 105: 3: 603-51.
Stephens, Hugh W. 1997. The Texas City Disaster, 1947. University of Texas Press.

Michelle Meyer is the director of the Hazard Reduction and Recovery Center and an associate professor in the Landscape Architecture and Urban Planning Department at Texas A&M University. She received her PhD in sociology at Colorado State University. She uses the lens of social capital and collective efficacy to theoretically understand how relationships between individuals and between governmental and nongovernmental organizations generate or hinder disaster risk and recovery. Hence, her interests have led her to research expansively on volunteer organizations, volunteerism, and philanthropy in disaster.