Behavior Analysis of Socially Vulnerable Households Responding to Planned Power Shutoffs
Publication Date: 2022
Abstract
Planned power shutoffs have been introduced as a new normal to prevent wildfire risks related to windblown debris that comes in contact with power lines. Despite positive aspects of this mitigation policy, problems remain. Planned power shutoffs inevitably create disproportionate difficulties for socially vulnerable populations. This study aimed to understand the community perceptions of risk, their attitudes, and their needs and losses during planned power shutoffs. A descriptive cross-sectional study was conducted among 440 Californians experiencing planned power shutoffs or receiving alert notifications on power shutoffs from September 2019 to October 2020. The survey first asked participants to assess their social vulnerability in terms of ability to purchase emergency items, concern about health, and social connections that can be used during planned power shutoffs. Based on this criteria, 90 participants (21%) were identified as socially vulnerable. Results indicated that socially vulnerable groups experience hardships, such as food spoilage, more often than others during power shutoffs. Results also indicated that there are statistically significant differences in socially vulnerable participants’ attitudes towards utility companies, the need for backup generators, and losses due to power shutoffs, compared to other groups. These findings suggest that additional targeted interventions are required for socially vulnerable populations to enhance their ability to cope with planned power shutoffs.
Behavior Analysis of Socially Vulnerable Households Responding to Planned Power Shutoffs
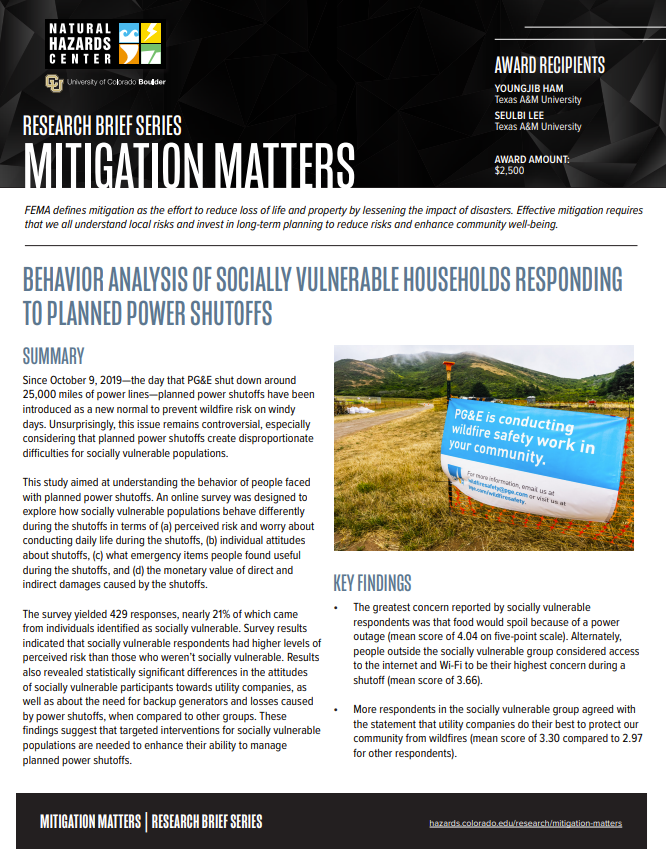
On October 9, 2019, California’s largest utility company, PG&E, shut down around 25,000 miles of power lines as a preemptive strategy to reduce the risk of wildfires caused by windblown debris that came in contact with power lines (Rhodes et al. 20201). The widespread planned blackout affected more than two million people across California (Wong-Parodi 20202). Elevators and traffic lights stopped working, schools canceled classes, businesses closed, and some households were without electricity for up to five days. Unsurprisingly, this issue brought heavy criticism, especially in light of the impacts on vulnerable populations. In one incident, a northern California man dependent on oxygen supply equipment died within 12 minutes of the PG&E power shutoff (McDonald, 20193). According to a regional daily newspaper, firefighters responding to the emergency tried to use a defibrillator but could not revive him because there was no power (McDonald, 2019). In another instance, a 72-year-old woman, recalled having to decide between charging her electric wheelchair or her heart monitor (Chabria & Luna 20204). Although the planned power shutoffs are meant to save lives and property from wildfires, they create dire consequences for some populations, such as older adults, people with disabilities, and those experiencing poverty. In other words, blackouts might be inconvenient for some but life-threatening for others.
In this context, this study aimed to understand the behavior of people in the face of the planned power shutoffs. Particularly, it explored how socially vulnerable populations behave differently during the planned power shutoffs in terms of perceived risk, attitude, need, and loss.
Methods
Research Design
This study conducted a survey to examine the behavior of people who have experienced planned power shutoffs in California. The data was collected using an online survey platform, Qualtrics. The questionnaire included 34 structured questions about planned power shutoffs at the household level, including perceived risk, attitudes, needs, and losses.
Participants, Sampling, Procedures, and Ethical Approval
We collected 559 zip codes included in a PG&E outage map to select addresses. Then, the online survey platform, Qualtrics, invited survey participants based on the collected zip codes. The online survey link was distributed via email and invited subjects were first asked to confirm that they either experienced planned power shutoffs or received alert notifications of shutoffs from September 2019 through October 2020. If the subjects answered yes to one or both of the two questions, a consent form outlining the purpose of the survey and respondent rights was provided. By signing the consent form, the subjects agreed to participate in the survey and received a Qualtrics incentive ($4 cash value) as compensation for the completed survey. This survey protocol was approved by the Institutional Review Board of Texas A&M University on July 21, 2020 (IRB#2020-0587).
Measures
The survey first assessed the social vulnerability of participants using four responses that were measured using a 5-point Likert scale (with choices of strongly disagree, disagree, neutral, agree, and strongly agree). Participants were asked to rank the following potential impacts of their exposure to the planned power shutoffs:
- I did not have money to buy emergency items needed.
- I worried about my health and the use of medical equipment.
- I was almost in danger because I was not able to use medical equipment.
- I did not have friends, family, or neighbors who could get in touch with me.
Participants were defined as socially vulnerable if they answered “strongly agree" to one of the above four questions.
The perceived risk, attitude, and need in this project was also measured based on a five-point Likert scale. In this survey, perceived risk refers to how much individuals worry about their daily life during the planned power shutoffs (Dominianni et al. 20185). Attitude refers to how positive or negative individuals feel about the planned power shutoffs (Fox-Rogers et al. 20166). Need refers to how much individuals perceive the specific emergency items as useful during the planned power shutoffs (Teo et al. 20197). Detailed survey questions for each item are given in.
Table 1. Survey Questions Determining Perceived Risk, Attitude, and Need
| Items | Questions |
| Perceived Risk | I worried about maintaining my preferred room temperature. |
| I worried about getting in touch with my family and friends. | |
| I worried about access to internet and Wi-Fi. | |
| I worried about work, study, or other important things I have to do. | |
| I worried about running out of food or food spoiling. | |
| Attitude | Utility companies are doing their best to protect our community from wildfires. |
| Public safety power shutoffs will help to reduce wildfires. | |
| Utility companies are well prepared for implementing the power shutoffs. | |
| The notification helped me prepare for the planned power shutoffs. | |
| Need | Backup generators help keep me safe and comfortable. |
| Batteries help keep me safe and comfortable. | |
| Flashlights help keep me safe and comfortable. | |
| Drinking water helps keep me safe and comfortable. | |
| Nonperishable food helps keep me safe and comfortable. | |
| Medicines help keep me safe and comfortable. |
Loss was expressed as a monetary value of direct and indirect damage caused by planned power shutoffs as evaluated by respondents. Detailed survey questions and response categories for loss are given in Table 2.
Table 2. Survey Questions Determining Loss
| Items | Questions | Response Categories |
| Loss | Due to blackouts, how much do you expect your direct loss to be? (e.g., food spoilage, injuries, decrease in sales, or damage to electronic data) | Less than $10 |
| $10-$99 | ||
| $100-$499 | ||
| $500-$999 | ||
| More than $1,000 | ||
| Due to blackouts, how much do you expect your indirect loss to be? (e.g., cancellation of social activities, increased psychological stress, or any kinds of inconvenience you felt) | Less than $10 | |
| $10-$99 | ||
| $100-$499 | ||
| $500-$999 | ||
| More than $1,000 |
Results
Data Analysis
Sample Demographics
The surveys yielded a total of 440 responses. After checking the validity of the collected survey data, 11 respondents were excluded from the analysis because they have experienced power shutoffs for reasons such as lightning, equipment malfunctions, or unpaid electric bills. As a result, the final sample consisted of 429 respondents: 189 males, 236 females, and four unspecified gender designations. Respondent ages ranged from 19 to 79 years old.
Table 3 shows respondent demographics by gender, age, education, and family income compared to data about Californians from the 2019 U.S. Census (U.S. Census Bureau, 20198). Although the sample distribution of gender and family income is relatively similar, there are several biases in age and education. Our study sample slightly over represents 35-44 age group, for example. Those with post-graduate degrees are also overrepresented. This is generally reflective of sampling biases that occur in online surveys (Boas et al., 20209). Such biases could be mitigated by an increased sample size and do not change the main conclusions of the survey or affect generalizability.
Table 3. Respondent Demographics by Percentage
| Items | 2019 Census (California) | Socially Vulnerable Respondents (n = 90) | Other Respondents (n = 339) | |
|---|---|---|---|---|
| Gender | Male | 49.7 | 44.4 | 44.0 |
| Female | 50.3 | 54.4 | 55.2 | |
| Unknown | - | 1.1 | 0.9 | |
| Age | 18 – 24 | 12.0 | 7.8 | 10.0 |
| 25 – 34 | 19.8 | 22.2 | 14.7 | |
| 35 – 44 | 17.3 | 34.4 | 27.4 | |
| 45 – 54 | 16.3 | 15.6 | 12.7 | |
| 55 – 64 | 15.6 | 13.3 | 13.9 | |
| 65 and over | 19.1 | 4.4 | 19.5 | |
| Unknown | - | 2.2 | 1.8 | Education | Less than high school | 16.0 | 4.4 | 1.5 |
| High school | 20.6 | 6.7 | 9.1 | |
| Collegea | 50.3 | 50.0 | 62.2 | |
| Post-Graduateb | 13.1 | 38.9 | 27.1 | Family Income | Less than $25,000 | 14.9 | 18.9 | 10.6 |
| $25,000 – $49,999 | 16.7 | 16.7 | 16.8 | |
| $50,000 – $99,999 | 27.8 | 17.8 | 28.0 | |
| $100,000 – $199,999 | 26.8 | 37.8 | 32.2 | |
| More than $200,000 | 13.7 | 8.9 | 12.4 | |
Socially Vulnerable Groups and Others
The distributions of participant responses to questions assessing social vulnerability, as described in the Measures section above, are as follows. Among 429 survey participants, 31 (7.2%) strongly agreed with the first statement, 46 (10.7%) with the second, 19 (4.4%) with the third, and 10 (2.3%) with the fourth. Since some participants indicated they strongly agreed with more than one question, a total of 90 respondents (20.97%) were identified as socially vulnerable. The remaining 339 participants responded with an answer other than “strongly agree.”
T-Test Results
All data analyses were carried out using R software for statistical computing. We converted ordinal variables, perceived risk, attitude, and need into a numerical scale, noting “strongly disagree” as one point through to five points for “strongly agree.” A two-sample t-test was run to determine whether there were differences between socially vulnerable respondents and the other respondents. The mean and standard deviation of each survey item are given in Table 4.
Table 4. T-Test Results of Perceived Risks, Attitudes, and Needs
| Items | Questions | Socially Vulnerable Respondents | Other Respondents | p-value | ||
|---|---|---|---|---|---|---|
| Mean | SD | Mean | SD | |||
| Perceived Risk | I worried about maintaining my preferred room temperature. | 3.66 | 1.26 | 3.05 | 1.05 | <0.001 |
| I worried about getting in touch with my family and friends. | 3.66 | 1.29 | 2.87 | 1.15 | <0.001 | |
| I worried about access to the internet and Wi-Fi. | 4.00 | 1.15 | 3.66 | 1.17 | <0.01 | |
| I worried about work, study, or other important things I have to do. | 3.91 | 1.21 | 3.31 | 1.21 | <0.001 | |
| I worried about running out of food or food spoiling. | 4.04 | 1.27 | 3.58 | 1.19 | <0.001 | |
| Attitudes | Utility companies are doing their best to protect our community from wildfires. | 3.30 | 1.35 | 2.97 | 1.15 | <0.05 |
| Public safety power shutoffs will help to reduce wildfires. | 3.60 | 1.31 | 3.56 | 0.96 | 0.28 | |
| Utility companies are well prepared for implementing public safety power shutoffs. | 3.16 | 1.32 | 2.99 | 1.11 | 0.22 | |
| The notification helped me prepare for the planned power shutoffs. | 3.79 | 1.21 | 3.71 | 0.92 | 0.30 | |
| Needs | Backup generators help keep me safe and comfortable. | 3.87 | 1.42 | 3.54 | 1.30 | <0.01 |
| Batteries help keep me safe and comfortable. | 3.89 | 1.23 | 3.68 | 1.08 | 0.09 | |
| Flashlights help keep me safe and comfortable. | 4.01 | 1.13 | 3.89 | 1.01 | 0.14 | |
| I worried about work, study, or other important things I have to do. | 3.91 | 1.21 | 3.31 | 1.21 | <0.001 | |
| Drinking water helps keep me safe and comfortable. | 4.08 | 1.23 | 3.94 | 1.08 | 0.06 | |
| Nonperishable food helps keep me safe and comfortable. | 3.86 | 1.18 | 3.83 | 1.07 | 0.58 | |
| Medicines help keep me safe and comfortable. | 3.83 | 1.28 | 3.61 | 1.17 | 0.06 | |
Findings
Risk Perception and Primary Concerns About Power Shutoffs
Socially vulnerable respondents indicated a higher level of perceived risk than non-socially vulnerable respondents on all five questions, as shown in Table 4. Socially vulnerable populations reported their greatest concern was food spoiling because of a power outage (mean score of 4.04 on five-point scale). On the other hand, non-socially vulnerable populations considered accessing the internet and Wi-Fi to be the fact that most concerned them when affected by the power shutoffs (mean score of 3.66). Overall, these two groups have statistically significant differences on all five questions with p-value < 0.001 or p-value < 0.01.
Attitudes About Power Shutoffs
There were no statistical differences between the two groups on survey items that assessed their attitudes about planned shutoffs, such as how effective the shutoffs were in reducing wildfire risk, how well utility companies planned ahead in implementing the shutoffs, or how useful notifications from utility companies were. However, more respondents in the vulnerable groups agreed with the statement that utility companies are doing their best to protect our community from wildfires (mean score of 3.30 for socially vulnerable respondents and 2.97 for other respondents; p < 0.05. See Table 4).
Primary Needs During Power Shutoffs
Similar to the previous studies (Beatty et al. 201910; Dominianni et al. 2018), respondents in our survey reported that access to drinking water, flashlights, nonperishable food, and batteries would help keep them safer during the power shutoffs. Although we did not observe meaningful differences between the two groups in most survey items, socially vulnerable populations indicated a greater need for backup generators (the mean score was 3.87 for socially vulnerable respondents, while the mean score was 3.54 for other respondents; p < 0.05. See Table 4). In open-ended questions, some respondents also reported that having ice and candles on hand could be useful when experiencing a power shutoff.
Losses Caused by Power Shutoffs
The majority (60%) of the socially vulnerable households indicated a direct loss attributable to the planned power shutoffs was greater than $100. In terms of the indirect losses attributed to psychological stress or the lack of social activities, responses in the $100 to $499 range were most frequently chosen by the socially vulnerable groups (32.2% of socially vulnerable respondents) while the response of less than $10 was the most frequently chosen by other respondents (33.9%). Detailed distributions of respondents’ responses are shown in Table 5.
Table 5. T-Test Results of Loss
| Questions | Response Categories | Socially Vulnerable Respondents (n=90) | Other Respondents (n=339) | p-value | ||
| Number of Responses | Percentages | Number of Responses | Percentages | |||
| How much do you expect your direct loss to be? | Less than $10 | 11 | 12.2 | 96 | 28.3 | <0.001 |
| $10-$99 | 25 | 27.8 | 111 | 32.7 | ||
| $100-$499 | 37 | 41.1 | 109 | 32.2 | ||
| $500-$999 | 8 | 8.9 | 15 | 4.4 | ||
| More than $1,000 | 9 | 10.0 | 8 | 2.4 | ||
| How much do you expect your indirect loss to be? | Less than $10 | 20 | 22.2 | 115 | 33.9 | <0.01 |
| $10-$99 | 25 | 27.8 | 107 | 31.6 | ||
| $100-$499 | 29 | 32.2 | 88 | 26.0 | ||
| $500-$999 | 8 | 8.9 | 20 | 5.9 | ||
| More than $1,000 | 8 | 8.9 | 9 | 2.7 | ||
Discussion
This study shed light on the importance of understanding how different people cope with planned power shutoffs that temporarily disrupt electricity service during times of high fire risk. The survey results confirmed that there is a clear disparity in the ability to adapt between socially vulnerable groups and others.
A Matter of Survival
For socially vulnerable groups, power shutoffs can be distressing experiences. As the survey results indicated, the primary concern expressed by socially vulnerable groups was related to the most basic survival needs, such as worry that food might run out. Many were also worried that they might not be able to access healthcare equipment when confronted with power shutoffs, causing a pressing need for backup generators. These findings suggest that some socially vulnerable groups may perceive the power shutoffs as a matter of survival rather than inconvenience. Therefore, with an in-depth understanding of the basic survival needs of vulnerable groups should be considered and mitigation strategies that support their resilience to power shutoffs should be designed.
A Vicious Circle
Socially vulnerable respondents more strongly agreed that utility companies did their best to protect their community when compared to other respondents. This positive attitude towards utility companies could be explained in the context of responsibility (Fox-Rogers et al., 2016; Guliasi, 202111). As socially vulnerable groups perceive themselves as being susceptible to external environmental changes, they may consider the risk associated with power shutoffs as their own responsibility because they are vulnerable. This can lead to self-depreciation and a sense of hopelessness that makes them less able to protect themselves and advocate for their rights, which in turn makes them even more vulnerable. Therefore, it is imperative to make every effort to stop this vicious circle.
Limitations and Future Directions
There are limitations to this study. First, since survey respondents were recruited through web-based services, the sample was less diverse, especially concerning age and educational status. The survey sample only included people who are skilled at using a computer since the survey was conducted online. Such characteristics of respondents infer that they are likely skillful at using mobile devices, better able to access information about planned power shutoffs, and accordingly, less susceptible to the power shutoffs compared to those who are unfamiliar with computers or mobile devices. Second, in this project, the level of social vulnerability was assessed based on information provided by the respondents and so may not entirely reflect the views of those who are often regarded as socially vulnerable in the related literature (e.g., families with low-income, older adults who live alone, less educated individuals, those who don’t speak English well, single parents, people with disabilities, and those who lack employment and housing). In this context, future studies will include approaches to identify the needs and challenges of various socially vulnerable groups. Also, future studies will discuss how to provide proactive interventions for socially vulnerable groups.
Refereces
-
Rhodes, N., Ntaimo, L., & Roald, L. (2020). Balancing wildfire risk and power outages through optimized power shut-offs. IEEE Transactions on Power Systems, 36(4), 3118-3128. ↩
-
Wong-Parodi, G. (2020). When climate change adaptation becomes a “looming threat” to society: Exploring views and responses to California wildfires and public safety power shutoffs. Energy Research & Social Science, 70, https://doi.org/10.1016/j.erss.2020.101757 ↩
-
McDonald, S. (2019). California man dependent on oxygen died 12 minutes after PG&E power shutoff. Newsweek. Retrieved Jan. 18, 2022, from https://www.newsweek.com/california-man-dependent-oxygen-died-12-minutes-after-pge-power-shutoff-1464766 ↩
-
Chabria, A., & Luna, T. (2019). PG&E power outages bring darkness, stress, and debt to California’s poor and elderly. Los Angeles Times. Retrieved Dec. 9, 2020, from https://www.latimes.com/california/story/2019-10-11/pge-power-outage-darkness-stress-debt-vulnerable. ↩
-
Dominianni, C., Ahmed, M., Johnson, S., Blum, M., Ito, K., & Lane, K. (2018). Power outage preparedness and concern among vulnerable New York City residents. Journal of urban health, 95(5), 716-726. ↩
-
Fox-Rogers, L., Devitt, C., O’Neill, E., Brereton, F., & Clinch, J. P. (2016). Is there really “nothing you can do”? Pathways to enhanced flood-risk preparedness. Journal of Hydrology, 543, 330-343. ↩
-
Teo, M., Goonetilleke, A., Deilami, K., Ahankoob, A., & Lawie, M. (2019). Engaging residents from different ethnic and language backgrounds in disaster preparedness. International Journal of Disaster Risk Reduction, 39, https://doi.org/10.1016/j.ijdrr.2019.101245 ↩
-
U.S. Census Bureau (2019). QuickFacts: California. U.S. Department of Commerce. Retrieved Dec. 13, 2020, from https://www.census.gov/quickfacts/fact/table/CA ↩
-
Boas, T. C., Christenson, D. P., & Glick, D. M. (2020). Recruiting large online samples in the United States and India: Facebook, mechanical turk, and qualtrics. Political Science Research and Methods, 8(2), 232-250. ↩
-
Beatty, T. K., Shimshack, J. P., & Volpe, R. J. (2019). Disaster preparedness and disaster response: Evidence from sales of emergency supplies before and after hurricanes. Journal of the Association of Environmental and Resource Economists, 6(4), 633-668. ↩
-
Guliasi, L. (2021). Toward a political economy of public safety power shutoff: Politics, ideology, and the limits of regulatory choice in California. Energy Research & Social Science, 71, https://doi.org/10.1016/j.erss.2020.101842 ↩
Ham, Y, & Lee, S. (2022). Behavior Analysis of Socially Vulnerable Households Responding to Planned Power Shutoffs (Natural Hazards Center Mitigation Matters Research Report Series, Report 9). Natural Hazards Center, University of Colorado Boulder. https://hazards.colorado.edu/mitigation-matters-report/behavior-analysis-of-socially-vulnerable-households-responding-to-planned-power-shutoffs