The Effect of Federal Recovery Funds on Mitigation Behavior
Publication Date: 2021
Abstract
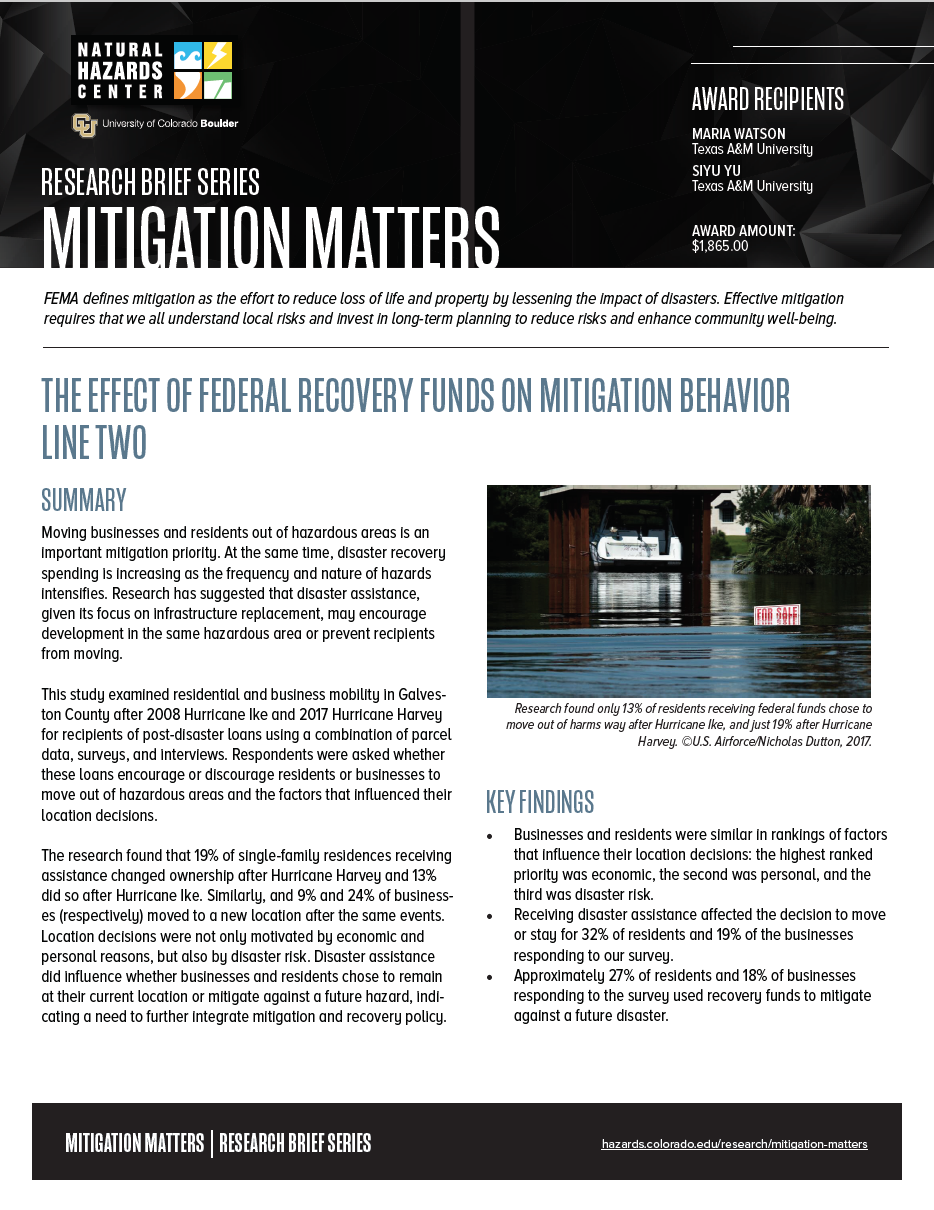
Moving businesses and residents out of hazardous areas is a priority for mitigating future risks. As the frequency and magnitude of natural hazards intensify, disaster recovery spending is also increasing. Research has suggested that disaster assistance, because it focuses on infrastructure replacement, may encourage development in the same hazardous area or prevent recipients from moving. This study examined residential and business mobility for recipients of post-disaster loans in Galveston County, Texas, after Hurricane Ike (2008) and Hurricane Harvey (2017). The study asked whether these loans encourage or discourage residents and businesses to move out of hazardous areas. It also examined the factors influencing their location decisions. This research found that 19% and 13% of single-family residences receiving assistance changed ownership after Hurricane Harvey and Hurricane Ike, respectively, and 9% and 24% of businesses moved to a new location. Location decisions were motivated not only by economic and personal reasons, but also by disaster risk. Disaster assistance, itself, did have an effect on whether businesses and residents chose to remain at their current location or move to avoid a future hazard, indicating a need to further integrate mitigation and recovery policy.
The Effect of Federal Recovery Funds on Mitigation Behavior
Human mobility plays an important role in disaster response, evacuation strategies, and long-term disaster recovery (Wang & Taylor, 2016). Studies indicate that unusual and extreme events and changes in the natural environment can influence resident migration (Morrow-Jones, 1991; Bengtsson et al., 2011), but this mobility can differ based on existing community relationships and social vulnerability (Toole et al., 2015; Findlay & Geddes, 2011; Mutton & Haque, 2004). Zoning changes and buyouts are important mitigation strategies for moving people out of floodplains (Godschalk et al., 1998) given that development and urbanization continue to occur in hazardous areas (Cutter et al., 20081, Douglas et al. 20082; Easterling et al. 20003). However, disaster-related movement can also be voluntary. Disaster assistance for businesses has faced criticism for tying aid to place, meaning that funds are contingent on the recipient remaining in the disaster area (Graham, 2007). This prevents businesses from adapting to changing conditions, such as population displacement, which may affect the success of their business. However, considering the concept more broadly, the issue of tying aid to place also relates to post-disaster mobility for residents and their ability to move away from physically vulnerable areas. Although the assistance discussed in Graham’s 2007 article explicitly stated that funding recipients needed to remain in their existing place of business for one year, disaster assistance may lead to place fixation in more indirect ways (Bagstad et al., 2007). For example, infrastructure replacement programs are necessarily dependent on the physical location of the damaged property. If these programs are loans rather than grants, the additional debt burden of the loan may make the costs associated with moving impossible to support.
Introduction
Human mobility plays an important role in disaster response, evacuation strategies, and long-term disaster recovery (Wang & Taylor, 20164). Studies indicate that unusual and extreme events and changes in the natural environment can influence resident migration (Morrow-Jones, 19915; Bengtsson et al., 20116), but this mobility can differ based on existing community relationships and social vulnerability (Toole et al., 20157; Findlay & Geddes, 20118; Mutton & Haque, 2004). Zoning changes and buyouts are important mitigation strategies for moving people out of floodplains and hazardous areas (Godschalk et al., 19989), although this movement can also be voluntary. Disaster assistance for businesses has faced criticism for tying aid to place, meaning that funds are contingent on the recipient remaining in the disaster area (Graham, 200710). This prevents businesses from adapting to changing conditions, such as population displacement, which may affect the success of their business. However, considering the concept more broadly, the issue of tying aid to place also relates to post-disaster mobility for residents and their ability to move away from physically vulnerable areas. Although the assistance discussed in Graham’s 2007 article explicitly stated that funding recipients needed to remain in their existing place of business for one year, disaster assistance may lead to place fixation in more indirect ways. For example, infrastructure replacement programs are necessarily dependent on the physical location of the damaged property. If these programs are loans rather than grants, the additional debt burden of the loan may make the costs associated with moving impossible to support.
This study identified patterns in mobility after disaster events for business and residents that received recovery loans in Galveston County after Hurricanes Ike and Harvey. Specifically, the research questions were: (1) Do loans encourage or discourage residential or business mobility in hazardous areas?, and (2) What factors influence decisions to relocate for businesses and residents in hazardous areas?
Methods
Research Design
This study used administrative (parcel) data for 2008-2020 from the Galveston County Appraisal District to link homes and businesses approved for recovery loans to a physical structure. Using tax information, we examined how loan amount, damage, and home value were related to decisions to relocate after the event. The loan-approved structures also served as the sample frame for survey and interview methods1, which allowed us to understand the factors behind whether homes and businesses would choose to move or stay in their current location, and whether approved recovery funds were used for mitigation against future disasters.
Participants and Sampling
Freedom of Information requests to the U.S. Small Business Administration (SBA) provided us with the number of businesses and homes that were approved for disaster loans after Hurricane Ike in 2008 (2,424 homes and 521 businesses) and Hurricane Harvey in 2017 (3,028 homes and 263 businesses) in Galveston County. Using these two events gave us both long- and short-term time frames for mitigation behaviors as well as provided a subset of homes and businesses impacted by multiple disaster events. Of the group of home loan recipients, a random sample (n=900) was taken for survey and interview recruitment. Because businesses have low response rates to mailing recruitment (Xiao & Peacock, 201411) and there were fewer business loans than home loans, the entire group of business loan recipients was used for survey and interview recruitment, excluding lessors of residential and commercial property due to the number of secondary homes in the area (Hamideh et al. 201812)Endnote 1 . For homes, we could not track residents once they moved, so we relied on the damaged residence as the sampling unit. For businesses, an initial online search was done to determine their current location, operating status, and contact information. We used the damaged property as the primary sampling unit for businesses, but also recruited businesses that previously occupied a damaged property and were operating in a different location.
Procedures
Sampled households were mailed a postcard that included a brief description of the study, the email address of the principal investigator, a QR code, and a URL leading to a Qualtrics survey. The first page of the survey displayed the project information where participants consented to the study. The final page of the survey asked if the respondent would be interested in participating in a longer interview. Businesses either received an email, postcard, or contact form message, depending on what information was available on their public site.
Measures
This study combined structured and semi-structured data. The parcel data and survey data were standardized and based on previous studies and existing literature. However, the study included an open-ended question where businesses and residents could provide unstructured comments. Interviews will be completed in August and are semi-structured based on guiding topical questions and the respondent’s survey answers (if applicable).
Results
Data Analysis
Loan data was linked to parcel data through a combination of geographic information system data and STATA, a statistical software package. First, addresses in the loan data were geocoded and spatially joined to the nearest parcel polygon (2008 data for Hurricane Ike and 2017 data for Hurricane Harvey). If the parcel address and loan address did not match, the address was separated into street name and number and underwent text matching. If a match could not be found, the address was searched manually. Not all loan addresses could be matched to a parcel, however. The next year of parcel data was then merged in through STATA and the reduction in improvement value was calculated as a proxy for damage. Lastly, 2011 parcel data and 2020 parcel data were merged in for Ike data and Harvey data, respectively, to compare whether the name associated with the parcel had changed for homes. A name was considered changed if both the first and last name changed and the household was coded as having moved. Businesses were coded as having moved if their address changed based on the online search. The survey data was downloaded and summarized using STATA; 18 businesses and 56 residents responded. The findings presented in this report are based on preliminary analysis of the quantitative data.
Findings
Who Moved?
Tables 1 and 2 provide descriptive statistics on the percentage and characteristics of single-family homes that changed ownership and businesses that moved after the hurricane events. After Hurricane Harvey, 551 single-family residences that received an SBA disaster loan changed ownership (19%) between 2017 and 2020, whereas 2,333 residences had the same ownership in 2020 compared to 2017 (81%). After Hurricane Ike, 308 single-family residences that received an SBA disaster loan changed ownership (13%) between 2017 and 2020, whereas 2,010 residences had the same ownership in 2008 compared to 2011 (87%). After Hurricane Harvey, 12 businesses that received an SBA disaster loan moved to a new location (9%) between 2008 and 2020, while 116 kept their original location (91%). After Hurricane Ike, 60 businesses moved to a new location (24%) between 2008 and 2020, while 187 stayed in their original location (76%).
Table 1. Summary of Ownership Changes in Single-Family Residences After Hurricane Ike and Hurricane Harvey
| Hurricane Harvey | ||||
| Single Family Residences | Moved (n=551) | Stayed (n=2,333) | ||
| Mean | SD | Mean | SD | |
| Value Loss (%) | 20.15 | 16.20 | 19.82 | 14.55 |
| 2017 Improvement Value ($) | 155,483.70 | 88,574.72 | 158,471.80 | 87,769.76 |
| Loan Amount ($) | 82,569.16 | 56,436.12 | 80,317.91 | 49,507.32 |
| Hurricane Ike | ||||
| Single Family Residences | Moved (n=308) | Stayed (n=2,010) | ||
| Mean | SD | Mean | SD | |
| Value Loss (%) | 28.24 | 38.46 | 12.06 | 25.77 |
| 2008 Improvement Value ($) | 109,571.80 | 73,380.79 | 113,486.70 | 81,570.71 |
| Loan Amount ($) | 82,165.68 | 77,707.80 | 71,145.27 | 67,076.22 |
Loan amount, damage, and resources were summarized for each group (“new ownership” vs. “same ownership” for residences, and “moved” vs. “stayed” for businesses) to see whether there were any notable differences. For single family residences, higher-value loss from the hurricane, lower improvement values, and higher loan amounts characterized the group that changed ownership. These differences were more pronounced after Hurricane Ike than after Hurricane Harvey. Businesses that moved were more likely to be younger, more damaged, and approved for higher loan amounts. They were also more likely to have survived long-term after the hurricanes. Results for business size were inconsistent across the events; larger businesses were more likely to stay in place after Harvey but more likely to move after Ike. Interviews can help to clarify whether the recovery context between the two hurricanes may have played a role or if this was just a product of the sample size.
Table 2. Summary of Location Changes of Businesses After Hurricane Ike and Hurricane Harvey
| Hurricane Harvey | ||||
| Businesses | Moved (n=12) | Stayed (n=106) | ||
| Mean | SD | Mean | SD | |
| Open (1=yes, 0=no) | 0.92 | 0.29 | 0.76 | 0.43 |
| Age (years) | 11.01 | 9.93 | 16.42 | 11.59 |
| Number of employees | 6.11 | 8.80 | 6.45 | 13.54 |
| Loan amount ($) | 76,866.67 | 84,614.26 | 104,941.50 | 13,3861.00 |
| Flood depth (ft.) | 1.96 | 1.54 | 1.47 | 1.53 |
| Hurricane Ike | ||||
| Businesses | Moved (n=60) | Stayed (n=187) | ||
| Mean | SD | Mean | SD | |
| Open (1=yes, 0=no) | 0.65 | 0.48 | 0.53 | 0.50 |
| Age (years) | 12.77 | 8.76 | 14.73 | 15.66 |
| Number of employees | 7.65 | 12.14 | 7.01 | 10.56 |
| Loan amount ($) | 91,234.00 | 153,232.90 | 138,074.90 | 198,704.90 |
| Flood depth (ft.) | 1.76 | 1.01 | 1.49 | 1.05 |
What Factors Impacted the Decision to Move or Stay?
Because parcel data can provide only observational information, we conducted a survey to collect data on the decision-making and motivation of residents and business owners/managers about whether to move from or stay at their current locations. The survey question pertaining to reasons for moving was modified from Xiao and colleagues’ 2018 Hurricane Sandy survey. Table 3 displays the relative importance of the factors.
Table 3. Average Business and Resident Ranking of Factors That Influenced Decisions to Move from or Stay in Their Disaster-Impacted Location
| Residents | Businesses | ||
| 3.50 | Proximity to job | 2.56 | Existing customer base |
| 4.62 | Proximity to family | 4.13 | Personal ties to the commmunity |
| 4.69 | Disaster risk | 4.56 | Disaster risk |
| 4.83 | Proximity to services and stores | 4.88 | Business ties with the commmunity |
| 5.02 | Proximity to friends | 5.75 | Established business network |
| 5.43 | Access to amenities such as parks, waterfront, etc. | 5.75 | Cost of moving to another location |
| 6.57 | Sentimental reasons | 5.81 | Effort required to move versus stay in place |
| 7.07 | Current mortgage or lease related limitations | 6.44 | Friendly business environment |
| 7.36 | Proximity to school and daycare | 7.44 | Availability of the workforce |
| 7.38 | Availability of alternative housing | 8.13 | Availability of an alternative location |
| 9.52 | Other | 10.56 | Other |
The top factor for businesses and residents illustrates the connection between the two: businesses ranked their existing customer base as most important and residents cited proximity to their job. Both businesses and residents listed personal ties to their location as their next most important factor (specifically proximity to family for residents), and disaster risk as the third highest. Receiving disaster assistance affected the decision to move or stay for 32% of residents and 19% of the business respondents, and 27% of residents and 18% of businesses used recovery funds to mitigate against a future disaster. For those that didn’t move, some businesses and residents used recovery funds for mitigation on their current structure. For residents, 27% of loan recipients used the funds to make their homes more physically resistant to a disaster and 18% of businesses made their building more physically resistant to disaster.
Discussion
In summary, not all recipients of disaster recovery assistance remain in their same location. Survey data indicates that decisions are driven by economic and personal reasons, but also by disaster risk. Disaster assistance, itself, has an effect on some businesses’ and residents’ decisions to remain at their current location or move to avoid a future hazard. Future work will statistically test whether groups that moved or stayed at their original location differ significantly based on amount of damage, structural characteristics, and demographic and economic characteristics. In addition, while the study examined homes and businesses that occupied a structure that was approved for an SBA loan, this is just a subset of the overall population. Future work will employ matching methods to compare moving behaviors in disaster assistance recipients to those not receiving assistance. Although the sample of survey respondents is small due to COVID-19 research modifications, ongoing in-depth interviews will help illuminate the decision-making process for homes and businesses deciding whether to leave or stay in the face of future natural disasters.
Endnotes
Endnote 1: This research was approved by the Texas A&M Institutional Review Board on 02/04/2020 (No: IRB2019-1466M). COVID-19 modifications to make the research fully virtual were approved on 11/09/2020.↩
References
-
Cutter, S. L., & Finch, C. (2008). Temporal and spatial changes in social vulnerability to natural hazards. Proceedings of the National Academy of Sciences, 105(7), 2301-2306. ↩
-
Douglas, I., Alam, K., Maghenda, M., McDonnell, Y., McLean, L. & Campbell, J. (2008). Unjust waters: Climate change, flooding and the urban poor in Africa, Environment and Urbanization 20(1), 187–205. https://doi.org/10.1177/0956247808089156 ↩
-
Easterling, D. R., Evans, J. L., Groisman, P. Y., Karl, T. R., Kunkel, K. E., & Ambenje, P. (2000). Observed variability and trends in extreme climate events: a brief review. Bulletin of the American Meteorological Society, 81(3), 417-426. https://doi.org/10.1175/1520-0477(2000)081<0417:OVATIE>2.3.CO;2 ↩
-
Wang, Q., & Taylor, J.E. (2016). "Patterns and limitations of urban human mobility resilience under the influence of multiple types of natural disaster." PLoS One, 11(1): e0147299. ↩
-
Morrow‐Jones, H. A., & Morrow‐Jones, C. R. (1991). Mobility due to natural disaster: Theoretical considerations and preliminary analyses. Disasters, 15(2), 126-132. 10.1111/j.1467-7717.1991.tb00441.x ↩
-
Bengtsson, L., Lu, X., Thorson, A., Garfield, R., & Von Schreeb, J. (2011). Improved response to disasters and outbreaks by tracking population movements with mobile phone network data: a post-earthquake geospatial study in Haiti. PLoS Medicine, 8(8), e1001083. ↩
-
Toole, J. L., Herrera-Yaqüe, C., Schneider, C. M., & González, M. C. (2015). Coupling human mobility and social ties. Journal of The Royal Society Interface, 12(105), 20141128 ↩
-
Findlay, A., & Geddes, A. (2011). Critical views on the relationship between climate change and migration: some insights from the experience of Bangladesh. In E. Piguet, A. Pécoud, & P. de Guchteneire (Eds.), Migration and climate change (pp. 138-159). UNESCO/Cambridge University Press. ↩
-
Godschalk, D. R., Kaiser, E. J., & Berke, P. R. (1998). Integrating hazard mitigation and local land use planning. In R. Burby (Ed.), Cooperating with nature: Confronting natural hazards with land-use planning for sustainable communities (pp.85-118). Joseph Henry Press. https://doi.org/10.17226/5785 ↩
-
Graham, L. T. (2007). Permanently failing organizations? Small business recovery after September 11, 2001. Economic Development Quarterly, 21(4), 299-314. https://doi.org/10.1177/0891242407306355 ↩
-
Xiao, Y., & Peacock, W. G. (2014). Do hazard mitigation and preparedness reduce physical damage to businesses in disasters? Critical role of business disaster planning. Natural Hazards Review, 15(3), 04014007. ↩
-
Hamideh, S., Peacock, W. G., & Van Zandt, S. (2018). Housing recovery after disasters: Primary versus seasonal/vacation housing markets in coastal communities. Natural Hazards Review. 040180003. ↩
Watson, M. & Yu, S. (2021). The Effect of Federal Recovery Funds on Mitigation Behavior (Natural Hazards Center Mitigation Matters Research Report Series, Report 7). Natural Hazards Center, University of Colorado Boulder. https://hazards.colorado.edu/mitigation-matters-report/the-effect-of-federal-recovery-funds-on-mitigation-behavior