Burning Down the House
Flame Imagery, Risk Communication, and Household Behavior
Publication Date: 2022
The complete study is described in a peer-reviewed publication in Communications Earth & Environment (Byerly Flint et al., 20221). Excerpts from that publication are included in the report below.
Abstract
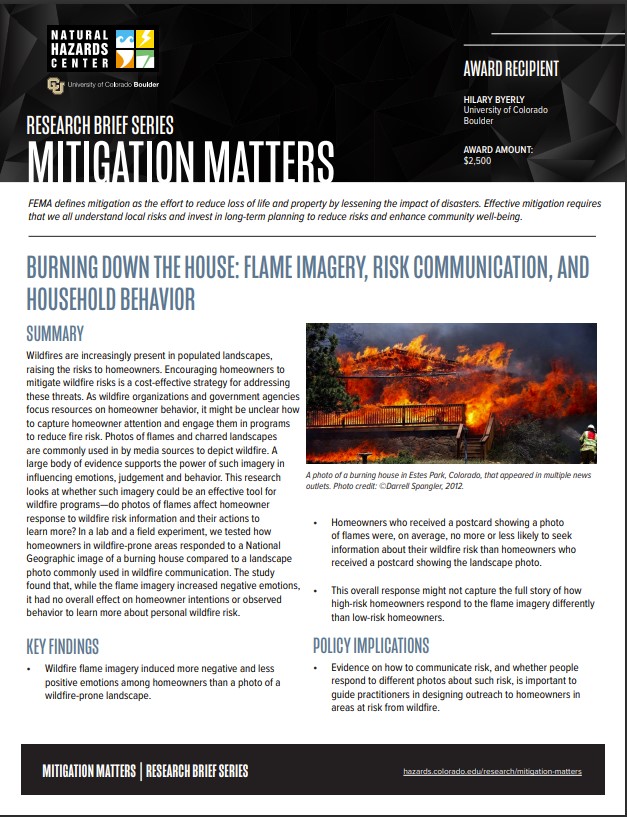
The increasing frequency and intensity of wildfires raises risks to communities. To reduce community wildfire risk, many organizations try to influence homeowner behavior. While wildfire practitioners lack causal evidence of how to capture homeowner attention and engage them in wildfire mitigation programs, photos of flames and charred landscapes are commonly used in mainstream media to depict impacts of wildfire. We conducted a field experiment in a wildfire-prone city in the western United States to test whether flame imagery affected risk information-seeking behavior. Homeowners (N = 5,785) were mailed a postcard directing them to visit a personalized webpage to learn more about their wildfire risk. Some respondents were shown a postcard with a photo of a burning house (flame photo), while others saw a photo of the local city (status quo photo). In a second study, we measured differences between the two photos in an online experiment with homeowners in wildfire-prone states (N = 440). After viewing the flame photo, these homeowners reported feeling more anxious, fearful and worried, compared to those who viewed the status quo photo. Despite these reported emotional differences between the flame and status quo photos, the field experiment showed no significant difference between the photos in web page visitation. Subsequent analysis conducted after this report found that response to the photos varies by homeowner wildfire risk. Evidence on how to communicate risk using specific imagery can aid in the design of materials to engage homeowners to address the risks on their properties.
Introduction
Wildfires increasingly occur in areas that put private property and communities at risk (Radeloff et al., 20182; Schoennagel et al., 20173). As these risks increase, organizations and government agencies are focusing attention on homeowner behavior (Calkin et al., 20144). Yet wildfire practitioners often lack evidence-based guidance on what causes homeowners to engage in risk-reduction, including whether to highlight the negative consequences of inaction.
Highlighting the negative consequences of inaction may indeed affect homeowner actions to learn more about wildfire risk. A large body of evidence shows that small tweaks in how information is framed and communicated can affect behavior (Thaler, 20165; Tversky & Kahneman, 19816). If those tweaks induce negative emotions, such as fear and worry, people may be motivated to take actions that reduce risk (Weber, 20067). Fear appeals, which seek to influence behavior by highlighting the severity and salience of threats (Nabi et al., 20188), have shown to consistently affect attitudes, intentions, and behaviors, although the majority of this research has focused on health (Tannenbaum et al., 20159). People also tend to be loss-averse in that avoiding losses is preferred to seeking equivalent gains (Kahneman & Tversky, 198410). In the case of wildfire, highlighting the potential loss of property may be more motivating than highlighting potential gains in a positive message about the benefits of risk-reduction. Additionally, increasing the salience of possible consequences can influence judgements about how likely those consequences are to occur (Kahneman, 200311). Imagery of a burning structure could encourage residents to consider that possibility and seek information about their wildfire risk.
Research on other natural hazards suggests the importance of negative emotions in preparing for earthquakes and flooding (Keller et al., 200612; Marti et al., 201813; McClure et al., 200914). However, these studies were conducted with small samples and measured effects on attitudes and behavioral intentions, rather than actual behavioral outcomes. Considerably more research has focused on negative framing in communicating climate change risks (e.g., Hornsey & Fielding, 201615; Schwartz & Loewenstein, 201716). Scientists are also calling for greater use of emotion in science and climate change communication (Martinez-Conde & Macknik, 201717; van der Linden et al., 201518). Yet it is unclear how inducing certain emotions actually affects behavior (Chapman et al., 201719). In a recent meta-analysis, van Valkengoed and Steg (201920) evaluated factors associated with climate change adaptation behavior (including preparing for, responding to, and seeking information about natural hazards, such as flooding and wildfire). They found few studies that establish causal relationships and few studies that test whether interventions to influence behavior are actually effective. This research aims to address these gaps.
Current Research
The purpose of this research is to determine whether homeowners respond differently to a photo of a burning house (flame photo) compared to a landscape photo typically used in wildfire communications (status quo photo). In Study 1, an online sample of homeowners (N = 440) was randomly assigned to view either a photo of a burning house or a landscape photo, and then asked to report on their emotional response, risk assessment, behavioral intentions, and personal preferences. In Study 2, two of these photos were used in a field experiment with homeowners (N = 5,785) in a wildfire-prone city to test whether the flame imagery affected information-seeking behavior when compared to a status quo photo.
Methods
Study 1: Online Experiment
Participants
The sample included online research participants from Prolific (www.prolific.co) who are self-reported homeowners and reside in one of the 15 most wildfire-prone states in the United States (CoreLogic, 201921). Participants were compensated one dollar for completing the survey, which took about five minutes.
Sampling
Previous studies informed a power analysis to determine the number of participants necessary to detect an effect. A similar study design, which showed college students photos of flooding and asked about risk perceptions, found effect sizes ranging from 0.35 to 0.63 (Keller et al., 2006). A meta-analysis on the effect of fear appeals found an average weighted effect size of d = 0.29 (Tannenbaum et al., 2015). Based on these results, the present study sought to detect an effect of d = 0.35. This would require about 100 participants in each treatment at α = 0.05 and β = 0.80. Additionally, it was estimated that up to 10% of responses might be incomplete. A total of 440 participants were recruited for the study.
Procedures
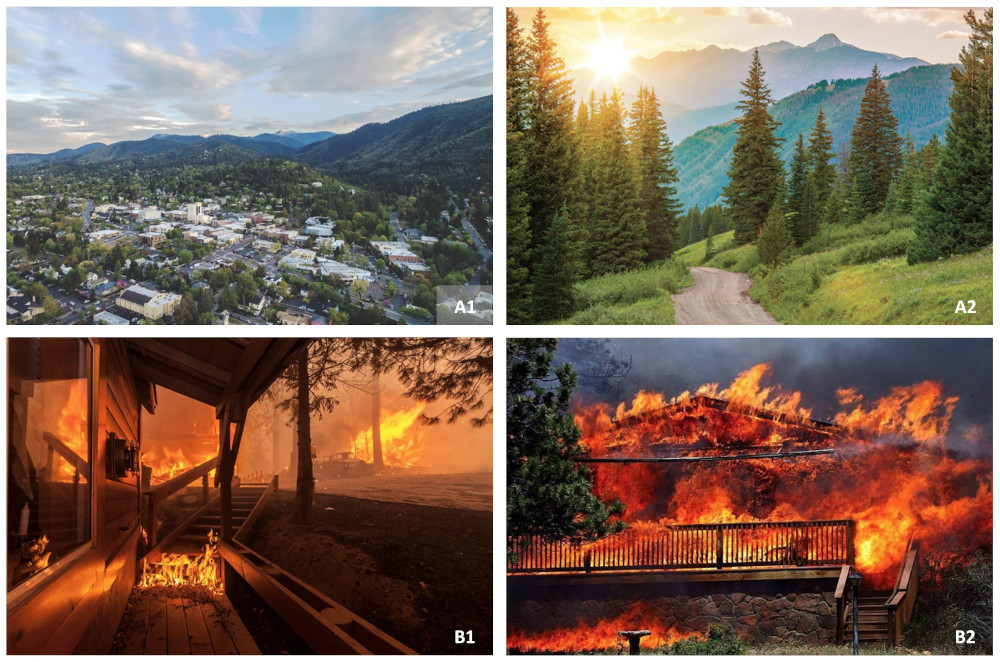
The introduction to the survey asked participants to imagine they live in an area at risk from wildfire and that there have been 10 large wildfires in the area in the last 100 years. This approach was used by Keller et al. (2006) to study risk communication related to flooding probability assessments. Participants were then asked to imagine they received a postcard from the local fire department with a photo on one side and a message stating their property was at high risk for wildfire on the other. The photo shown to participants was randomly assigned from one of four photos (Figure 1). Two of the photos represented the status quo because they had been used by fire departments to communicate with homeowners about wildfire risk. Two photos represented flame imagery because they showed burning houses and had appeared in media outlets along with stories about wildfire destruction. Participants were then asked questions related to their emotional reactions, risk assessments of wildfire, behavioral intentions to seek information about wildfire risk, and personal preferences regarding the two photos.
Figure 1. Photos Shown to Homeowners in the Online Experiment (Study 1)
Measures
The types of questions included in the survey were meant to identify possible differences in responses to the two photos in a wildfire context. Participants were first asked their emotional reactions to determine whether the flame photos elicited more negative emotions (anxious, fearful, worried) and less positive emotions (calm, peaceful, or safe) than the status quo photos. The second battery of questions measured whether the flame photo affected a participant’s assessment of the wildfire risk of their imagined home, including the chance of a wildfire, the chance of home damage in a wildfire, and the riskiness of living in a place like this. These questions were modeled after similar risk-perception studies (Keller et al., 2006; Wilson et al., 201922). The third set of questions focused on information-seeking behavioral intentions, including receiving more information about wildfire risk and visiting a personalized wildfire risk web page. These questions also followed Wilson et al. (2019) and were adapted to reflect the behavioral outcome in Study 2. Finally, participants were asked about personal preferences related to the photos: How much do you like this photo? and How personally relevant is this photo? (Mrkva et al., 201923).
Responses were provided on Likert scales that were defined by question. Measures of emotion and personal reactions were rated from not at all (0) to the most possible (10). Responses to “Chance of…” questions were rated from no chance (0%) to for sure (100%); “How risky is living here?” was rated from not risky at all (0) to extremely risky (10). Behavioral intentions were rated on a five-point Likert scale from extremely unlikely (1) to extremely likely (5).
Analysis
The goals of this study were (a) to measure the differences between the two photos that would be used in a field experiment (Study 2) and (b) to determine whether reactions to those two photos generalized to two similar photos. Differences between the field experiment photos were evaluated using t-tests with Benjamini-Hochberg corrections for multiple comparisons (Benjamini & Hochberg, 199524). Generalizability of similarities and differences to the other two photos was tested using one-way analysis of variances and post-hoc Tukey’s Honestly Significant Difference test (Abdi & Williams, 201025). Ethical approval was provided by the University of Colorado Institutional Review Board (Protocol # 20-0372, approved July 23, 2020).
Results
There were 440 participants in the study, evenly distributed across the four treatment photo groups. Responses differed for all emotional reactions to the two photos in Study 2 (Table 1). Compared to the status quo photo, the flame photo caused participants to feel more anxious (Mdiff = 2.3, 95% CI = 1.7 to 3.0), fearful (Mdiff = 2, 95% CI = 1.3 to 2.6), and worried (Mdiff = 2.3, 95% CI = 1.7 to 2.9), and less calm (Mdiff = -1.8, 95% CI = -2.4 to -1.1), peaceful (Mdiff = -2.1, 95% CI = -2.8 to -1.5) and safe (Mdiff = -2.2, 95% CI = -2.8 to -1.6).
Table 1. Online Experiment (Study 1) Results
| Measure | Status Quo A1 (n = 111) | Status Quo A2 (n = 109) | Flame B1 (n = 109) | Flame B2 (n = 111) | F Statistic | t Statistic |
| Emotional Responses (The photo makes me feel…) | ||||||
| Worried | 4.6 (3) | 4.5 (3) | 6.9 (2) | 7.0 (2) | 35.5*** | 7.4*** |
| Anxious | 4.9 (3) | 4.4 (3) | 6.8 (2) | 6.9 (2) | 30.3*** | 7.0*** |
| Fearful | 5.3 (3) | 4.8 (3) | 7.6 (2) | 7.6 (2) | 45.1*** | 5.8*** |
| Calm | 3.6 (3) | 4.3 (3) | 1.8 (2) | 1.4 (2) | 37.2*** | -5.5*** |
| Peaceful | 3.6 (3) | 4.3 (3) | 1.5 (2) | 1.0 (2) | 48.0*** | -6.5*** |
| Safe | 3.6 (3) | 4.0 (3) | 1.4 (2) | 1.2 (2) | 46.8*** | -7.3*** |
| Risk Assessments | ||||||
| Chance of fire (%) | 45 (30) | 46 (30) | 49 (30) | 50 (30) | 0.864 | 1.2 |
| Chance of fire damage (%) | 60 (20) | 60 (20) | 62 (30) | 61 (20) | 0.233 | 0.7 |
| How risky is living here? | 6.2 (2) | 6.0 (2) | 7.0 (2) | 7.3 (2) | 9.05*** | 2.6* |
| Behavioral Intentions | ||||||
| Receive more information | 4.4 (0.8) | 4.4 (0.8) | 4.5 (0.8) | 4.6 (0.7) | 1.86 | 0.8 |
| Visit personalized website | 3.7 (0.6) | 3.7 (0.6) | 3.7 (0.5) | 3.8 (0.5) | 1.14 | 0.2 |
| Personal Preferences | ||||||
| Like the photo | 7.6 (2) | 7.4 (2) | 4.6 (3) | 3.4 (3) | 71.9*** | -8.4*** |
| Photo is personally relevant | 5.6 (3) | 5.3 (3) | 3.9 (3) | 4.0 (3) | 10.4*** | -4.3*** |
The flame photo also caused respondents to rate their imagined home as slightly riskier than those who viewed the status quo photo (Mdiff = 0.8, 95% CI = 0.2 to 1.4), however they assessed no difference in the probability of wildfire or chance of damages. There was also no difference in behavioral intentions after viewing the two photos. When asked, “If the local fire department created a website that shows wildfire risk information specific to your property, how likely are you to visit this website?” those who viewed either photo responded they were, on average, “somewhat likely” to visit the website (Mdiff = 0.0, 95% CI = -0.1 to 0.2). There were differences in personal responses to the two photos: the flame photo was less liked (Mdiff = -3.0, 95% CI = -3.7 to -2.3) and less personally relevant (Mdiff = -1.7, 95% CI = -2.5 to -0.9) than the status quo photo.
Regarding generalizability to similar photos, responses to the two photos used in wildfire communications were similar to each other and different from the photos of burning houses for all measures (Table 1). The same is true for the two photos of burning houses—responses were different from the wildfire communications photos and similar to one another for all but one measure. Respondents liked the flame photo used in Study 2 less than the other flame photo (Mdiff = -1.2, 95% CI = -2.1 to -0.3, p = 0.003).
Study 2: Field Experiment
Participants
Participants were property owners in Ashland, Oregon. Ashland is a relatively dense wildland-urban interface city with a median housing value of more than double that of the United States and a population that is older, whiter, and more educated than national population averages (U.S. Census Bureau, 201926).
Sampling
The sample frame included every parcel within the city limits of Ashland, Oregon (N = 6,400). The sample of homeowners was identified using the Jackson County Property Data list (https://web.jacksoncounty.org/pdo/). Owners of multiple properties were identified using a name-matching process, which resulted in 5,785 unique property owners. Property owners were also identified as part-time residents if their mailing address was not in Ashland. A mailing list was constructed from the property data list and matched to parcel-level wildfire risk assessment data collected by Ashland Fire and Rescue.
Based the response rate (55%) to a household survey conducted by Ashland Fire and Rescue in the study area and the results of a previous study with a similar design (Meldrum et al., 202127), 22%, or about 1,400 households were expected to visit the web pages. Based on previous research and the goals of Ashland Fire and Rescue, our study sought to detect an effect size of w = 0.05. This required a sample size of at least 3,140 at α = 0.05 and β = 0.80.
Procedures
Each property owner in the sample was mailed a postcard by Ashland Fire and Rescue in July 2020. The organization provides wildfire education and services to residents. As a part of their wildfire risk reduction mission, Ashland Fire and Rescue sought to inform homeowners about the risk factors on their property.
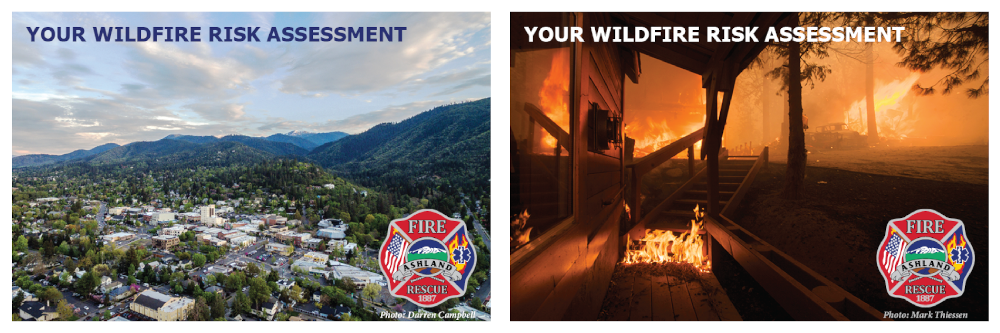
The postcard informed recipients of their parcel’s wildfire risk and directed them to visit a personalized web page to learn more about their risk factors and resources for taking action. Property owners were randomly assigned to receive one of two versions of the postcard—either the treatment, which had an image of a burning house (flame photo), or the control, which had an image of the Ashland landscape (status quo photo) (Figure 2). Assignment to treatment followed a randomized block design, in which homeowners were randomly and evenly distributed between the treatment and control groups according to their wildfire risk rating (low to extreme).
Figure 2. Two Versions of the Postcard Mailed to Homeowners in the Field Experiment (Study 2)
A unique code on the postcard allowed recipients to access their web pages. Web page visits were tracked using Google Analytics. Ethical approval was provided by the University of Colorado Institutional Review Board (Protocol # 20-0177, approved April 16, 2020), including a waiver of informed consent.
Analysis
The primary outcome measure was whether or not a property owner visited their wildfire risk web page. This was measured by tracking the unique codes entered to access the web pages. For the preliminary analysis, a Pearson’s chi-squared test evaluated whether differences in web page visits between the two experimental groups could be attributed to chance. Subsequent analysis (not described here) modeled the response with covariates and identified whether response to the flame photo was moderated by a homeowner’s wildfire risk (which was pre-registered here: https://osf.io/f7t9u/).
Results
The sample included 5,785 property owners divided equally between the two versions of the photos (Table 2). On average, Ashland properties are on smaller lots (0.20 acres) valued at nearly half a million dollars ($452,000) and were built in the 1970s. Regarding ownership characteristics, 7.8% of property owners own more than one property in Ashland and 16% reside in Ashland only part-time. The flame treatment includes structures slightly older than those in the status quo (difference = 2 years, p = 0.01) and a slightly larger proportion of part-time owners (difference = 2 percentage points, p = 0.04).
| Overall, n = 5,785 | Status Quo Photo, n = 2,892 | Flame photo, n = 2,893 | |
| Risk score | 470 (380, 530) | 470 (380, 530) | 470 (380, 530) |
| Property Size (Acres) | 0.20 (0.14, 0.27) | 0.20 (0.14, 0.27) | 0.20 (0.15, 0.27) |
| Property Value | 452 (374, 549) | 449 (374, 546) | 453 (374, 551) |
| Year Built | 1975 (1950, 1994) | 1976 (1951, 1995)* | 1974 (1950, 1993)* |
| Multiple Properties (A) | 454 (7.8%) | 234 (8.1%) | 220 (7.6%) |
| Part-Time Resident (B)d> | 953 (16%) | 234 (8.1%) | 220 (7.6%) |
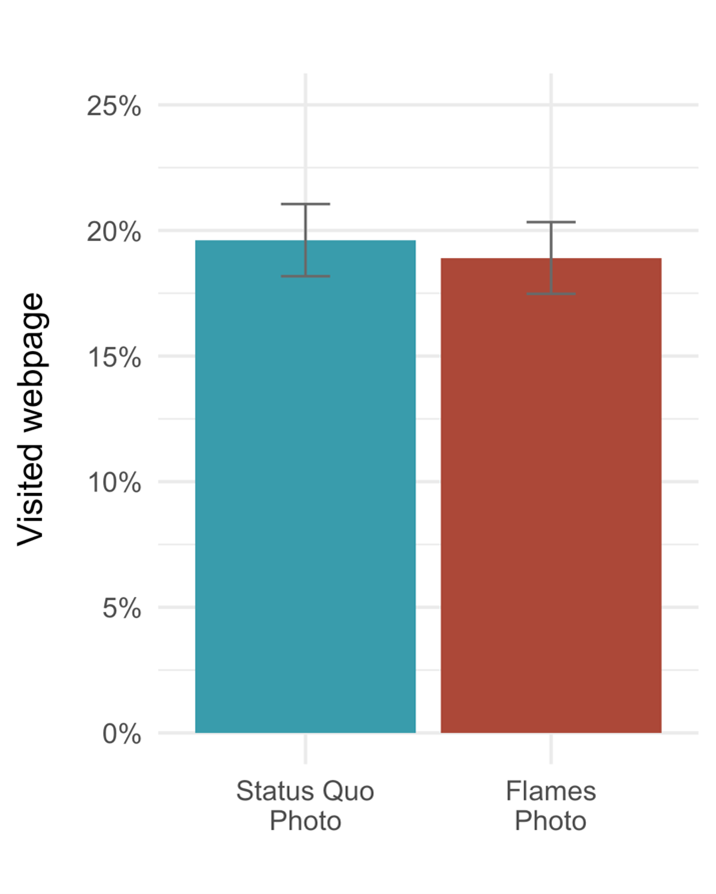
Overall, 19.3% (95% CI [18.3%, 20.3%]) of homeowners who received postcards visited their parcel-specific web pages. There is no difference in visitation between those who received the flame photo and those who received the status quo photo (Figure 3; flame photo = 18.8%, status quo photo = 19.7%; χ2(1, n = 5785) = 0.7, p = 0.4).
Figure 3. Wildfire Risk Information-Seeking Behavior by Experimental Condition in Study 2
Discussion
Community destruction from wildfire is increasingly costly, leading agencies and organizations to invest in outreach to homeowners to reduce wildfire risk. These practitioners lack causal evidence on strategies to deliver that outreach, particularly whether or not it should highlight negative worst-case wildfire scenarios. Results from these two studies show that, while photos of flames affect homeowners’ self-reported emotions and risk assessments, flame photos do not appear to have an overall effect on their information-seeking behavior when compared to imagery typically used in wildfire communications.
In the field experiment, homeowners who received a postcard showing a flame photo were equally likely to visit their wildfire risk web page as those who received a postcard showing a photo of the local community. This result matches results from the online experiment with homeowners, whose behavioral intentions to visit a personalized web page were no different after viewing the photos. However, the flame photo did induce considerably more negative emotions and less positive emotions compared to the status quo photo.
The failure of the flame photo’s emotional effects to translate into a behavioral effect may be conceptually understood by the brain’s two systems of decision-making (Kahneman, 2003). While the fast, intuitive System 1 is influenced by imagery and emotion, the slow, analytical System 2 effortfully engages in thoughtful reasoning. People are more likely to rely on their analytical system when message comprehensibility and personal relevance are high (Petty & Cacioppo, 198628). The communication about wildfire risk in the field experiment may have been clear and relevant enough to engage analytical processing and override effects of imagery and emotion on behavior.
However, it is unknown whether the photos in the field experiment elicited the same emotional responses as in the online experiment. Laboratory experiments, in which subjects are aware of their participation in research, are subject to biases in responses, including from perceived expectations of researchers (experimenter demand effect) or efforts to present oneself in a positive manner (social desirability bias). The scrutiny, context, and subject pool selection in the online experiment may have influenced whether those effects are generalizable to the field (Levitt & List, 200729).
Conducting the field experiment in just one community could also limit generalizability to communities and homeowners with different characteristics that moderate response to flame imagery. According to Ashland Fire and Rescue, residents are highly engaged in the issue of wildfire. Perhaps these factors affected homeowner response to the images, including whether they engaged in System 1 or System 2 processing. Moreover, the sample included only property owners. It is possible that renters who live on the at-risk property are more affected by the salience of potential losses from wildfire that cannot be compensated for by insurance payments.
Additional analysis from this study (Byerly Flint et al., 2022) finds that the flame imagery differentially affects high- and low-risk homeowners. Related research has found that homeowners respond differently to communication according to their properties’ wildfire risk (Meldrum et al., 2021). Viewing the negative consequences of wildfire may affect homeowners differently if, at the same time, they also learn that their property is at extreme versus low risk for wildfire. Additional exploratory analysis could point to other household characteristics that affect treatment response, and future studies with larger sample sizes across multiple communities will allow for more causal evidence on whether flame imagery influences behavior for some populations more than others.
Evidence on how to communicate risk, and whether people respond to different photos about such risk, is important to guide practitioners in designing outreach to homeowners in areas at risk from wildfire. Continued collaborations between researchers and practitioners to test assumptions and build evidence-based programs can improve efforts to promote risk mitigation as threats from wildfire, hurricanes, and other natural disasters are projected to grow in a changing climate.
References
-
Byerly Flint, H., Champ, P. A., Meldrum, J. R., & Brenkert-Smith, H. (2022) Wildfire imagery reduces risk information-seeking among homeowners as property wildfire risk increases. Communication Earth & Environment 3 (229). https://doi.org/10.1038/s43247-022-00505-7 ↩
-
Radeloff, V. C., Helmers, D. P., Kramer, H. A., Mockrin, M. H., Alexandre, P. M., Bar-Massada, A., Butsic, V., Hawbaker, T. J., Martinuzzi, S., Syphard, A. D., & Stewart, S. I. (2018). Rapid growth of the US wildland-urban interface raises wildfire risk. Proceedings of the National Academy of Sciences, 115(13), 3314–3319. https://doi.org/10.1073/pnas.1718850115 ↩
-
Schoennagel, T., Balch, J. K., Brenkert-Smith, H., Dennison, P. E., Harvey, B. J., Krawchuk, M. A., Mietkiewicz, N., Morgan, P., Moritz, M. A., Rasker, R., Turner, M. G., & Whitlock, C. (2017). Adapt to more wildfire in western North American forests as climate changes. Proceedings of the National Academy of Sciences, 114(18), 4582–4590. https://doi.org/10.1073/pnas.1617464114 ↩
-
Calkin, D. E., Cohen, J. D., Finney, M. A., & Thompson, M. P. (2014). How risk management can prevent future wildfire disasters in the wildland-urban interface. Proceedings of the National Academy of Sciences, 111(2), 746–751. https://doi.org/10.1073/pnas.1315088111 ↩
-
Thaler, R. H. (2016). Behavioral Economics: Past, Present, and Future. American Economic Review, 106(7), 1577–1600. https://doi.org/10.1257/aer.106.7.1577 ↩
-
Tversky, A., & Kahneman, D. (1981). The framing of decisions and the psychology of choice. Science, 211(4481), 453–458. https://doi.org/10.1126/science.7455683 ↩
-
Weber, E. U. (2006). Experience-Based and Description-Based Perceptions of Long-Term Risk: Why Global Warming does not Scare us (Yet). Climatic Change, 77(1), 103–120. https://doi.org/10.1007/s10584-006-9060-3 ↩
-
Nabi, R. L., Gustafson, A., & Jensen, R. (2018). Framing Climate Change: Exploring the Role of Emotion in Generating Advocacy Behavior.Science Communication, 40(4), 442–468. https://doi.org/10.1177/1075547018776019 ↩
-
Tannenbaum, M. B., Hepler, J., Zimmerman, R. S., Saul, L., Jacobs, S., Wilson, K., & Albarracín, D. (2015). Appealing to fear: A meta-analysis of fear appeal effectiveness and theories. Psychological Bulletin, 141(6), 1178–1204. https://doi.org/10.1037/a0039729 ↩
-
Kahneman, D., & Tversky, A. (1984). Choices, values, and frames. American Psychologist, 39(4), 341–350. https://doi.org/10.1037/0003-066X.39.4.341 ↩
-
Kahneman, D. (2003). A perspective on judgment and choice: Mapping bounded rationality. American Psychologist, 58(9), 697–720. http://dx.doi.org/10.1037/0003-066X.58.9.697 ↩
-
Keller, C., Siegrist, M., & Gutscher, H. (2006). The Role of the Affect and Availability Heuristics in Risk Communication. Risk Analysis, 26(3), 631–639. https://doi.org/10.1111/j.1539-6924.2006.00773.x ↩
-
Marti, M., Stauffacher, M., Matthes, J., & Wiemer, S. (2018). Communicating Earthquake Preparedness: The Influence of Induced Mood, Perceived Risk, and Gain or Loss Frames on Homeowners’ Attitudes Toward General Precautionary Measures for Earthquakes. Risk Analysis, 38(4), 710–723. https://doi.org/10.1111/risa.12875 ↩
-
McClure, J., White, J., & Sibley, C. G. (2009). Framing effects on preparation intentions: Distinguishing actions and outcomes. Disaster Prevention and Management: An International Journal, 18(2), 187–199. https://doi.org/10.1108/09653560910953252 ↩
-
Hornsey, M. J., & Fielding, K. S. (2016). A cautionary note about messages of hope: Focusing on progress in reducing carbon emissions weakens mitigation motivation. Global Environmental Change, 39, 26–34. https://doi.org/10.1016/j.gloenvcha.2016.04.003 ↩
-
Schwartz, D., & Loewenstein, G. (2017). The Chill of the Moment: Emotions and Pro-environmental Behavior. Journal of Public Policy & Marketing. https://doi.org/10.1509/jppm.16.132 ↩
-
Martinez-Conde, S., & Macknik, S. L. (2017). Opinion: Finding the plot in science storytelling in hopes of enhancing science communication. Proceedings of the National Academy of Sciences, 114(31), 8127–8129. https://doi.org/10.1073/pnas.1711790114 ↩
-
van der Linden, S., Maibach, E., & Leiserowitz, A. (2015). Improving Public Engagement With Climate Change: Five “Best Practice” Insights From Psychological Science. Perspectives on Psychological Science, 10(6), 758–763. https://doi.org/10.1177/1745691615598516 ↩
-
Chapman, D. A., Lickel, B., & Markowitz, E. M. (2017). Reassessing emotion in climate change communication. Nature Climate Change, 7(12), 850. https://doi.org/10.1038/s41558-017-0021-9 ↩
-
van Valkengoed, A. M., & Steg, L. (2019). Meta-analyses of factors motivating climate change adaptation behaviour. Nature Climate Change, 9(2), 158. https://doi.org/10.1038/s41558-018-0371-y ↩
-
CoreLogic. (2019). 2019 CoreLogic Wildfire Risk Report. https://www.corelogic.com/downloadable-docs/wildfire-report_0919-01-screen.pdf ↩
-
Wilson, R. S., Zwickle, A., & Walpole, H. (2019). Developing a Broadly Applicable Measure of Risk Perception.Risk Analysis, 39(4), 777–791. https://doi.org/10.1111/risa.13207 ↩
-
Mrkva, K., Westfall, J., & Van Boven, L. (2019). Attention Drives Emotion: Voluntary Visual Attention Increases Perceived Emotional Intensity. Psychological Science, 30(6), 942–954. https://doi.org/10.1177/0956797619844231 ↩
-
Benjamini, Y., & Hochberg, Y. (1995). Controlling the False Discovery Rate: A Practical and Powerful Approach to Multiple Testing. Journal of the Royal Statistical Society. Series B (Methodological), 57(1), 289–300. JSTOR. ↩
-
Abdi, H., & Williams, L. (2010). Tukey’s Honestly Signiflcant Difierence (HSD) Test. In N. J. Salkind (Ed.), Encyclopedia of Research Design. Sage Publications. ↩
-
U.S. Census Bureau. (2019). Population Estimates, July 1, 2019 (V2019)—Ashland, OR and United States. https://www.census.gov/quickfacts/fact/table/US,ashlandcityoregon/PST045219 ↩
-
Meldrum, J. R., Brenkert-Smith, H., Champ, P. A., Gomez, J., Byerly, H., Falk, L., & Barth, C. M. (2021). Would you like to know more? The effect of personalized wildfire risk information and social comparisons on information-seeking behavior in the wildland–urban interface. Natural Hazards. https://doi.org/10.1007/s11069-021-04534-x ↩
-
Petty, R. E., & Cacioppo, J. T. (1986). The Elaboration Likelihood Model of Persuasion. In Advances in Experimental Social Psychology (Vol. 19, p. 83). Academic Press. ↩
-
Levitt, S. D., & List, J. A. (2007). What Do Laboratory Experiments Measuring Social Preferences Reveal About the Real World? Journal of Economic Perspectives, 21(2), 153–174. ↩
Byerly, H. (2022). Burning Down the House: Flame Imagery, Risk Communication, and Household Behavior (Natural Hazards Center Mitigation Matters Research Report Series, Report 4). Natural Hazards Center, University of Colorado Boulder. https://hazards.colorado.edu/mitigation-matters-report/burning-down-the-house