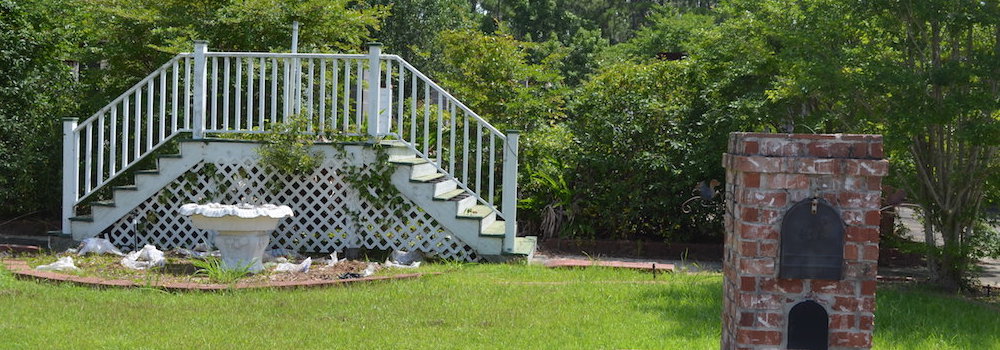
 A decade after Hurricane Katrina, Diamondhead, Mississippi is still a patchwork of empty, overgrown lots. ©Hazards and Vulnerability Research Institute, 2015.
By Susan Cutter and Christopher Emrich
While emergency managers at all levels have shown an interest in identifying vulnerable populations before and after disasters, the ability to systematically measure or monitor social vulnerability—the differential disaster impacts on social groups based on pre-event social conditions and capacities to adequately prepare for, respond to, and recover from disruptive events—across a range of places has been lacking.
The development and implementation of the Social Vulnerability Index (or SoVI for short) into recent disaster response and recovery operations has helped fill this gap between science and practice. SoVI enables comparisons of social characteristics between places—specifically socioeconomic characteristics that contribute to a community’s disaster response and recovery capability. SoVI uses 29 different social and economic variables from the U.S. Census to represent a composite score of the underlying drivers of social vulnerability such as gender, social status, age, race and ethnicity, and wealth. In addition to producing a numeric value, SoVI outputs include a map illustrating relative levels (low, medium, high) of vulnerability. The social vulnerability index also provides detailed information about the drivers of vulnerability for specific geographic area of interest.
SoVI’s incorporation into the Federal Emergency Management Agency Geospatial Framework—a set of spatial products delivered to state and local emergency managers in times of crises—is a good example of translating vulnerability science to practice. While social vulnerability assessment is valuable for pre-impact planning, how useful is an informational product such as SoVI to response and recovery operations?
This question was put to the test during the historic floods of 2015 in South Carolina. Specifically, SoVI was leveraged into actionable intelligence and targeted response and recovery planning. The Governor of South Carolina appointed a disaster recovery coordinator and team with two missions: 1) accelerate recovery quickly across the entire state, and 2) develop recovery priorities in an apolitical fashion.
South Carolina relied on SoVI to identify priority areas requiring prolonged assistance in recovering from the disaster. For example, the South Carolina Disaster Recovery Office used SoVI to focus Voluntary Organizations Active in Disaster (VOAD) efforts in areas where help was needed most, rather than in the most accessible or convenient places, locations the media was focused on, or areas with potentially politicized needs. Further, when social vulnerability data were coupled with data from FEMA, the National Flood Insurance Program (NFIP), and Small Business Administration (SBA) to determine unmet needs, the remaining pockets of affected residents who needed additional resources for recovery were quickly highlighted.
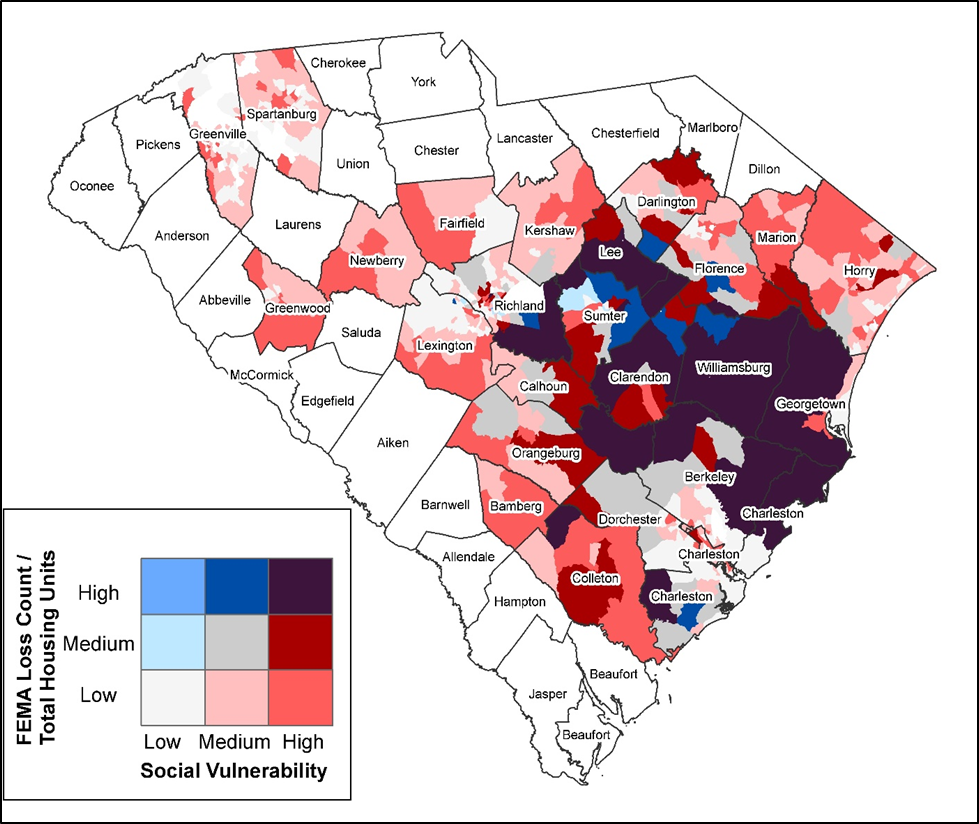
The approach ultimately focused on those communities with high social vulnerability scores and the greatest damages and flood levels (shown in dark purple in Figure 1). It highlighted where volunteer organizations could prioritize resources to provide immediate relief, housing rehabilitation, and initial recovery. The use of SoVI gave state recovery personnel a much needed focal point for their recovery planning activities—one based on theory and measureable information. Implementing SoVI enabled the South Carolina Disaster Recovery Office to meet the governor’s mandate to take a non-partisan approach to distributing scarce disaster recovery dollars to those who needed it most.
 Figure 1. Illustration of disaster impact (FEMA-Verified Loss Count/Total housing units) and existing social vulnerability. The areas with the greatest need are shaded in dark purple (high impact and high social vulnerability). Map created by Christopher Emrich. Source: South Carolina Action Plan for Disaster Recovery, 2016.
Using the Social Vulnerability Index to allocate (often scarce) resources before, during, and after disasters allows for a clear and sustained unity of effort among organizations. More importantly, SoVI enables a fiscally conscious approach to resource allocation because it streamlines the process of targeting and prioritization and reduces political debates by local constituencies through an evidence-based approach.
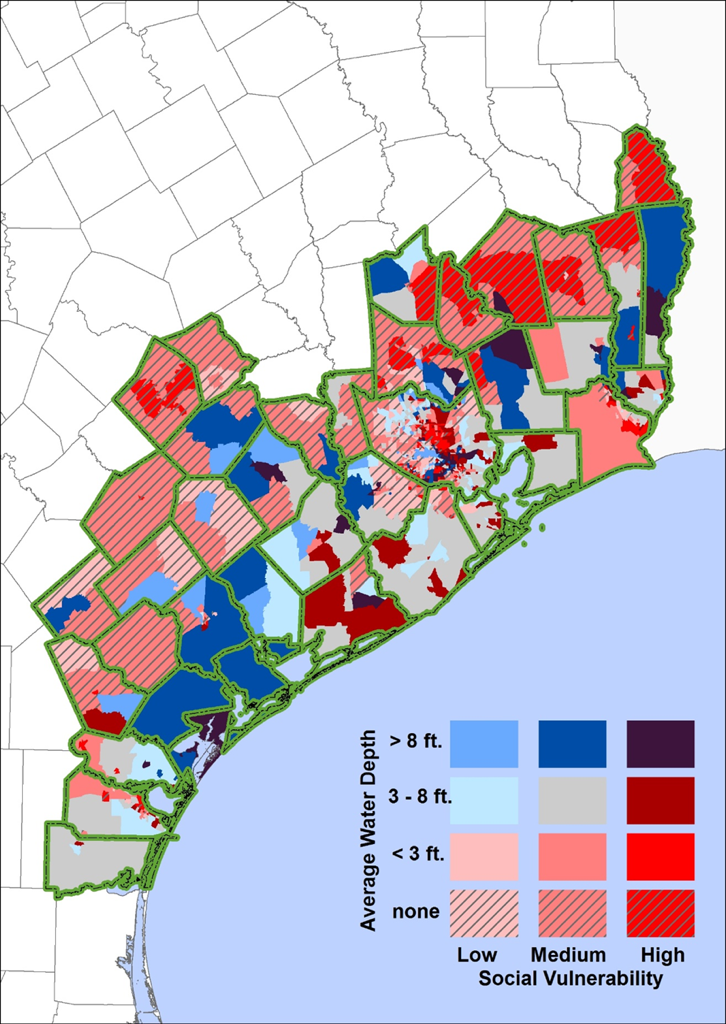
Since 2015, state and federal emergency management teams have used this tool in Florida (Hurricane Matthew), Louisiana (floods), South Carolina (Hurricane Matthew), West Virginia (floods), and most recently in Houston after Hurricane Harvey (Figure 2).
 Figure 2. Illustration of disaster impact (flood depth) and existing social vulnerability. The areas with the greatest need are shaded in dark purple (high impact and high social vulnerability). Source: Christopher Emrich, 2017.
Over time and across disaster contexts, our team has learned a number of important lessons from the deployment of SoVI as an operational tool for emergency managers. We conclude by sharing a few of those here:
Learning Takes Time, But It Is Always Worthwhile
First and foremost, we recognized the steep learning curve of emergency managers in understanding SoVI’s underlying architecture, as well as approaches to data interpretation and analytic limitations. The learning involved significant give-and-take between disaster scholars and practitioners in explaining social vulnerability both conceptually and practically. Once response and recovery teams and decision makers were confident in their understanding of the tool, its application, and its limitations, SoVI became widely used by state and local officials to identify unmet needs and target resources such as the planning and distribution of U.S. Department of Housing and Urban Development Community Development Block Grant-Disaster Recovery (HUD CDBG-DR) funds.
Evidence-Based Decision-Making Matters
Second, SoVI converts decades of disaster research has taught us that marginalized populations without access to goods, services, information, and assistance are less able to rebound from disasters—into useable data. This evidenced-based measure quickly enabled targeted decision making rather than the typical one-size-fits-all approach employed during disasters.
Knowledge of Social Vulnerability Can Translate into More Equitable Approaches
Third, the successful application of SoVI to numerous disaster response and recovery operations demonstrates the significant positive effect of using an evidence-based social vulnerability approach in the emergency management cycle, especially in the response and long-term recovery phases. It also adheres to the principles of good governance, social justice, and equity by helping those most in need first.
The social vulnerability index began as a conceptual model (1995-96) and turned into an empirical modelling challenge (1998-2002) before being translated into an evidence-based method for assessing disparities in hazard impacts across the United States. Since the seminal publication in 2003, SoVI has been refined and modified to reflect our current understanding of the drivers of vulnerability. It incorporates the most recent socioeconomic data in its construction. The widespread use of SoVI in the research arena is not confined to the United States as variants of SoVI are used worldwide. The real success in SoVI’s timeline is the most recent application in assisting emergency managers to define the populations in the most need after a disaster and targeting response and recovery resources. In other words, translating disaster research into practice. This is what makes research count, after all.
Susan Cutter is a Carolina Distinguished Professor of Geography at the University of South Carolina where she also directs the Hazards & Vulnerability Research Institute. Her research focuses on vulnerability and resilience science, especially disaster resilience indicators for communities.