Developing a New Interdisciplinary Model for Mapping Flood Risks and Impacts
Publication Date: 2025
Abstract
In July 2023, severe flooding impacted the northeastern United States. Rural Ludlow, Vermont, was hit with over six inches of rain in less than 48 hours and is still recovering. In this context, this research has been designed to address the following research question: What challenges and opportunities exist with respect to the accessibility and accuracy of current flood risk maps? To answer this question, this study uses a mixed methods approach including interviews, community mapping, and site visits. Preliminary results indicate that flood map accuracy and accessibility are issues of concern for research participants, including impacted residents, community organizers, and local and state officials, who highlighted ongoing erosion, infrequent map updating, and other concerns. Impacted community members, in particular, noted challenges distinguishing between the Federal Emergency Management Agency’s National Flood Hazard Layer and the River Corridor maps developed by the State of Vermont. They also had difficulty effectively navigating websites and getting questions answered. As flooding across the country becomes more common and severe, it is crucial to better understand how users interact with available flood prediction resources to make appropriate decisions regarding flooding issues. These decisions may have implications for the design and development of maps and additional tools.
Introduction
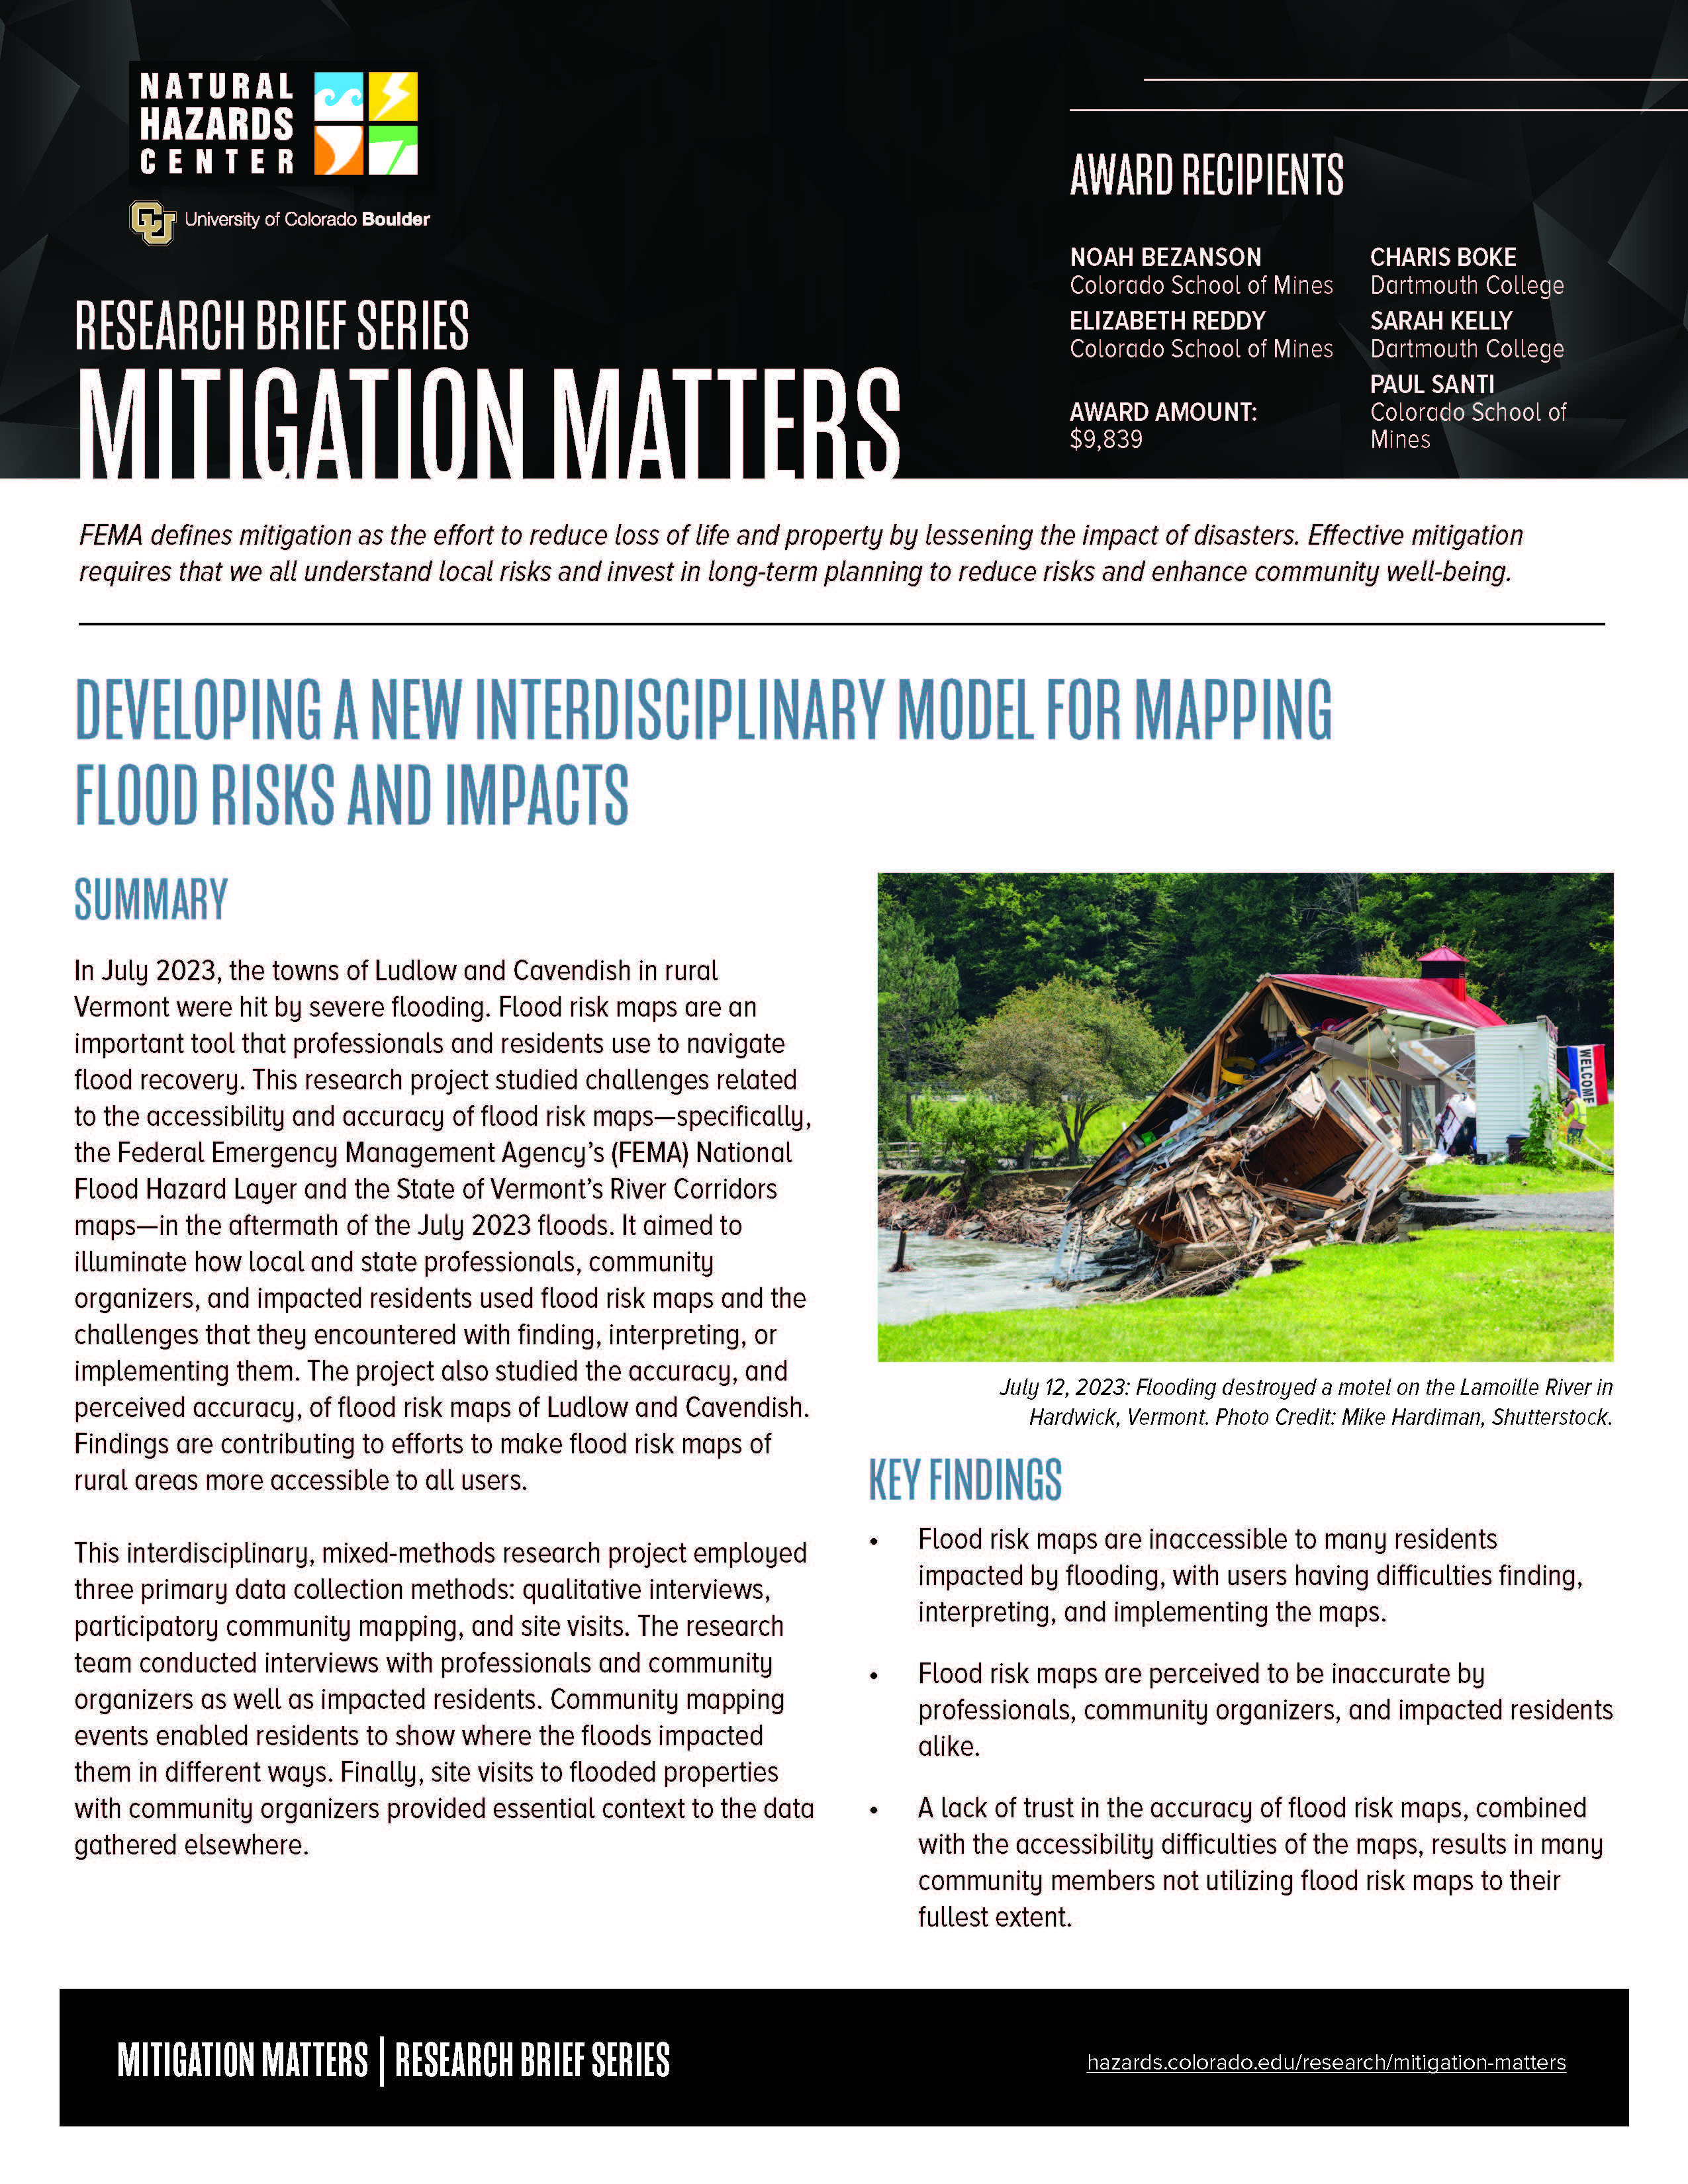
In July of 2023, severe flooding impacted the northeastern United States, causing an estimated $2.2 billion in damages (Smith, 20201). Ludlow, Vermont was hit with over six inches of rain in less than 48 hours (McCullum et al., 20232; National Weather Service, 20233) and is still recovering. As climate change continues to shift the area’s hydrological systems (Hayhoe et al., 20074), there will be more floods and more disasters in this area. Using interdisciplinary methods, including participatory mapping (Elwood & Leitner, 19985)—a form of community based research (Strand, 20036)—and more traditional flood impacts mapping, this research project addressed identified challenges related to the accessibility and accuracy of flood maps; specifically, the Federal Emergency Management Agency’s (FEMA) National Flood Hazard Layer and the State of Vermont’s River Corridors maps.
The primary aim of this research was to understand the nature of existing flood maps and how these flood maps are currently used by different groups, including town-, county-, and state-level officials; community organizers; and impacted community members. We also sought to learn how these groups access and act on the maps and assess their accuracy and utility in relation to those uses. This report submission marks the end of the primary data collection period of this research, undertaken between May 13 and July 26, 2024. Preliminary data analysis has revealed themes of interest that will require further investigation regarding the accuracy and accessibility of flood maps. Findings from this research have potential implications for practice or policy, especially concerning the creation and implementation of future flood risk maps. Findings are contributing to the development of criteria and constraints for the design of a new map tool that will be created by the research team in the future. Finally, we will continue to conduct additional data analysis and disseminate our findings.
Literature Review
Flood risk maps are designed and maintained by federal agencies and state governments to communicate the level of risk of a major flood event in a specific area. For example, FEMA’s National Flood Hazard Layer designates 100-year floodplains, official floodways, and other relevant spaces. Vermont’s River Corridor maps represent erosion risks by mapping the meander belts of rivers. However, the creation of these maps is not solely a technical issue; there are several social factors that must be considered to make flood risk maps accessible to end users, such as impacted community members. Map accessibility does not only mean that community members are able to view the flood map data. As Elwood and Leitner (1998) state, community members must also be able to interpret the maps, as well as utilize the maps to make any necessary changes to their way of life. These three levels of accessibility—locating, interpreting, and utilizing maps—will be referred to repeatedly throughout this paper. This more comprehensive view of map accessibility acknowledges that community members may not have the skills or knowledge to understand and use flood maps, which are often highly technical. These challenges, as well as some ideas for overcoming them, are discussed in a case study by Auliagisni and colleagues (20227). This study analyzed how a community in New Zealand used flood hazard maps. The authors found that the current flood hazard maps were often difficult for residents who could potentially be affected by flooding to find and understand. They point to the importance of creating easily readable flood maps, as well as implementing outreach groups to ensure all community members are aware of potential hazards. These actions address multiple levels of accessibility (Auliagisini et al., 2022). Our research project was designed to address the three levels of accessibility in a similar way.
The findings from this research will eventually result in the development of a set of criteria and constraints for the design of a new map tool. Participatory geographic information systems (PGIS) (Kar et al., 20168), also known as public participation mapping or participatory mapping, , was a core research approach for this project and will continue to be for future work that incorporates this project’s findings. This term was coined in 1996 to describe research techniques that prioritized making geographic information system (GIS) mapping tools accessible to all stakeholders in the community being mapped (Sieber, 20009). PGIS originated in the field of citizen science, which has been described as how the public participates in creating and using scientific research (Thompson, 201610). A number of PGIS projects have taken place in the United States, many of which were conducted in urban areas (Pánek et al., 202011; Rickenbacker et al., 201912; Vajjhala, 200513). PGIS projects have also been successful in more rural contexts, like the one in which this project takes place (Jankowski, 200914). There are also various ways to adapt the PGIS framework to different contexts. For example, PGIS could involve creation of a three-dimensional map using different types of pins or markers (Cadag & Gaillard, 201215), or it could involve drawing maps by hand on paper (Vajjhala, 2005). These case studies show that PGIS does not always require the use of advanced computer programs. This flexibility is valuable, as it enables us to find an approach that works in rural Vermont.
PGIS work has long been recognized as complex. As early as 1998, Harris and Weiner (199816) put forth the succinct and accurate argument that “GIS is a contradictory technology that simultaneously marginalizes and empowers people and communities” (p. 2). The authors argued that community outreach actions taken by experts are often overlooked and that PGIS is very much situated in the specific political and social context of a place. There are also barriers of cost and unequal power distribution, as outlined by Robinson and colleagues (201717). GIS software and the hardware to run it continues to be prohibitively expensive. Additionally, even the most expansive PGIS initiatives cannot directly involve every individual in the mapmaking process, and some local knowledge may be contradictory. Robbins (200318) argues that this provides an opportunity for GIS to help answer questions about the formation of knowledge. These differences in local knowledge must be acknowledged. Beyond the more obvious power differential between outside researchers and community members, additional inequities exist within communities themselves. It is possible for PGIS to be used to reinforce these existing power structures by only paying lip service to community involvement and using it to support preconceived ideas (McCall, 200319). McCall (2003) extensively describes the traits of successful PGIS projects, which include supporting equity and respect for rights; this could include ensuring maps’ “manageability at local level by local people” (p. 8). The positive aspects of PGIS projects outlined in this paper and others will be important to emulate.
Research Question
There is currently extensive literature discussing the accuracy of flood maps, as well as more limited literature on the accessibility of flood maps to various user groups. However, there is a gap in the literature around the use of flood maps by community groups and activists in rural areas. By focusing on one specific geographic context, the towns of Ludlow and Cavendish in rural Vermont in the wake of the July 2023 floods, this project was able to address this gap during a fast six-month timeframe, successfully producing findings to address its research question regarding the challenges and opportunities which exist with respect to the accessibility and accuracy of current flood risk maps.
Findings will inform the development of criteria for an accessible new map tool for use by community groups, activists, and disaster response and recovery professionals. This work will be completed over the course of the first author’s master’s thesis, which will be submitted in April 2025, and two peer-reviewed publications, to be submitted before the end of 2025.
Research Design
This research project used a mixed methods approach. The research team included two anthropologists (the second and fourth authors), a geographer (the third author), and an engineering student (the first author). This interdisciplinary team was uniquely positioned to take on a mixed methods project. Each member of the team was able to use their expertise with specific methods (for example, interviewing or community mapping) to guide the first author in how to most effectively use the methods and to implement the methods to advance the broader project in which this research is an element.
This research used interviews, community mapping, and site visits to collect data. These methods were determined during a scoping trip conducted by the first author in March 2024. This trip included interviews with regional and state-level officials, as well as site visits undertaken by the first author and other members of the team. The bulk of data collection was performed between May and July 2024.
Study Site
This study took place in Ludlow and Cavendish, two neighboring small towns in rural Vermont. The towns are situated alongside the Black River, about ten miles west of the New Hampshire border. The area is mountainous and largely forested. Dozens of brooks and streams of various sizes feed into the Black River in and around the two towns. Okemo Ski Resort is located in Ludlow and shapes the demographics and businesses in both towns. Many of the homes in Ludlow, as well as a significant number of the homes in Cavendish, are vacation homes that are empty for much of the year. Most homeowners that live in the area year-round are not wealthy, and they are impacted by a housing shortage. There are various drivers of this housing shortage, including the high number of houses owned by non-residents or rented as short-term rentals. The year-round population of Ludlow is about 2,200, while Cavendish has approximately 1,400 people; over 90 percent of each of the towns is white (U.S. Census Bureau, n.d.-a20, n.d.-b21). Both towns have many features of a stereotypical small rural town. Everyone seems to know everyone, and there is a single grocery store. People look out for one another when faced with disasters such as flooding. Because of the towns’ sizes and the study team members’ pre-existing connections with people in both communities, building productive relationships was possible, even with a truncated study timeline.
Interviews
Semi-structured interviews were conducted by the first author with two distinct groups of people. The first group was made up of professionals and community organizers who use flood maps in their official roles in some capacity. This included town managers, zoning officials, county-level regional planners, and professionals working for the State of Vermont. It also included residents who work in local community-based organizations that assist in flood response or recovery. A total of 12 people were interviewed from this group. The second group included people who were directly affected by the flooding in July 2023. This group was mostly homeowners and business owners whose property was affected by the flooding, but also included residents of the area who personally assisted in response and recovery efforts. People in this group used flood maps either before or after the flooding, mostly to understand flood risk or how flooding might affect insurance rates. There was a total of 11 people interviewed from the second group.
Different interview guides were used for the different groups. Examples of the questions that we asked each group can be found in the Appendix. We used purposive sampling to identify participants in the professional group through online searches. We then contacted them by email or phone. We also used snowball sampling to identify additional participants (Bernard, 201122). For example, participants in the impacted residents group were identified by community partners, who knew which residents may be most willing to talk about their experiences. All interview questions and processes followed the research protocol approved by the Colorado School of Mines Human Subjects Committee, dated February 12, 2024.
Community Mapping
The team held four different community mapping exercises over the course of this research. These community exercises contributed to the first author’s research, but were funded by another grant the team received through the Natural Hazards Center’s Weather Ready Research Award, “Mutual Aid for Resilience: Mapping Vermont’s 2023 Flood Response Networks.” One large community mapping event was held on June 28, 2024. Seventeen local residents and town officials attended this meeting. Participants were recruited through a variety of avenues, including flyers hung in both towns and press releases to local newspapers: the Rutland Hearld, the Vermont Journal, the Eagle Times, the Reporter, the Mountain Times, the Chester Telegraph, and the Mount Holly Newsflash. Two other community mapping exercises were also hosted: at the annual Mt. Holly Energy Fair on June 16, 2024, and at the weekly farmer’s market in Ludlow on July 14, 2024. At these events, participants were invited to tell their stories and/or place stickers on a map. Twelve people participated at the Mt. Holly Energy Fair, while 22 people participated at the Ludlow farmer’s market. The demographics of participants in the energy fair and farmer’s market activities were quite different from that of the community meeting—our team saw participation from a higher percentage of second homeowners in the latter. A more scaled-back version of the exercise was additionally conducted at a community lunch in Ludlow on July 18, 2024, which was attended by dozens of people, mostly older adults. Not all attendees participated—approximately 15 people spoke with us. These activities were valuable in demonstrating how a wide range of people experienced the floods in July 2023.
During these community mapping exercises, participants were asked to mark on a map where they saw flooding and/or erosion occur. Participants also marked where roads were closed, where important hubs for recovery were set up, and what they viewed as critical infrastructure. These activities were typically done in small groups of three to five people, with groups sharing the maps they made afterwards. These community mapping exercises revealed how people understood themselves as being impacted by the flooding, as well as critical decision-making information they perceived to be lacking. At each event, participants were also asked if they had videos or photos that they would be willing to share with the research team; follow-up interviews are ongoing. Photos and videos will be used to amplify and enhance detail for the two-dimensional data represented by dots, lines, and other marks on the maps generated by the research team.
Site Visits
The first author conducted site visits to approximately 30 homes and businesses that flooded in July 2023. Some of the businesses and residences had applied for, been approved for, and accepted FEMA buyouts. Places where erosion occurred, or where roads were blocked, were also visited. Buildings in both towns that became hubs for distribution of aid during the flood recovery process were toured. These sites were all important to people’s experiences of flooding or flood recovery in some way. The site visits also provided the first author with a better understanding of the area that the flood maps display. Looking at maps in ArcGIS or Google Earth cannot indicate how people experience the land and flood events, making this project’s mixed methods approach particularly useful.
As part of site visits, residents at some of the homes and owners or employees at businesses were briefly interviewed. These visits also offered opportunities for organic and unscheduled interviews that involved touring private property with the owners to observe and map where water advanced onto their property. Site visits revealed both what people expected before flooding and the actual inundation of the flood. This information enabled the first author to begin addressing questions on both the accuracy and accessibility of the flood maps. Many site visits were completed alongside community partners who were aware of which sites within the study area flooded.
Preliminary Findings
Flood Map Accessibility
Both professionals (town-, county-, and state-level officials; community organizers) and impacted residents and business owners who were interviewed voiced their beliefs that flood maps, especially FEMA’s National Flood Hazard Layer, were difficult for the public to use. One professional described the FEMA flood maps “as fairly inaccessible to the public.” This interviewee went on to say that the State of Vermont’s River Corridor maps were “more accessible, but it’s still probably an issue.” Another professional said that “people don’t know where to go or who to ask” when they had questions about the flood maps, and that his office received “spillover” of people seeking explanations of the flood maps even though that was not in his job description.
Impacted residents confirmed this finding when they directly expressed a lack of knowledge about who to go to for clarity on the flood maps. Multiple people struggled to understand the definitions of what was being mapped, and how it impacted their property. One resident whose home was damaged in the flooding said they “don’t know one from the other” regarding the floodway, flood hazard areas, and river corridor. The resident continued to say that they were “still trying to figure it out because no one will tell me” and described their view that nobody will provide any type of explanation of the flood maps. Other residents whose properties were damaged by flooding told a similar story. One said that they “couldn’t find any information that was helpful” on FEMA’s or the State of Vermont’s websites. They went on to explain that they “didn’t know what to look at.”
Professionals working for the town or state clearly stated that both FEMA’s National Flood Hazard Layer and the State of Vermont’s river corridor maps were likely inaccessible for untrained users. However, they were often careful to separate themselves from the broader public by clarifying that they knew how to find and interpret the flood maps. One professional interviewee did this by describing the flood maps as “difficult for your average person to interpret,” implicitly placing themselves in a separate category. A different professional explained how they learned to use the flood maps from another professional, tracing their progression from layperson to a professional comfortable with the flood maps. They explained that without the assistance of their mentor, “it would’ve taken forever to figure out how they did [a specific task using the flood maps].” This anecdote revealed both the initial inaccessibility of the flood maps, as well as the importance of having someone familiar with the flood maps available to explain how to use them effectively.
Flood Map Accuracy
While the inaccessibility of the maps to local residents was mentioned by many interviewees, the inaccuracy of the FEMA flood maps was almost universally discussed in interviews. Many interviewees, when asked about the flood maps, commented on their inaccuracy right away. For example, during a meeting with a local business owner, they immediately stated that the maps were simply “not accurate enough.” Concerns about accuracy also arose during interviews with professionals. One county-level official reflected, “I can't tell you how many times, especially after the ‘23 flood, how many times we see homes that aren't in the floodplain that get whacked, and homes that are [in the floodplain] that are fine.” This quote reflects that the FEMA floodplains did not accurately predict the pattern of flooding in July 2023. These accuracy issues were also acknowledged by local government officials and state officials in floodplain and river management.
The inaccuracy of flood maps was also revealed through community mapping exercises. Participants in these exercises placed dots on a two-dimensional map representing where they remembered the flooding to have occurred. It is important to note that the community mapping events happened approximately one year after the July 2023 flooding, so it is possible that participants may not have remembered exactly where flooding occurred. However, as this research project continues, photos and video evidence of the flooding will be cross-referenced with dots on the two-dimensional map to increase accuracy of the community mapping exercise. The number of flood events that occurred outside of the flood hazard areas suggests that flooding did in fact happen in many places outside of FEMA’s mapped areas.
Site visits were also essential for confirming the inaccuracy of flood maps. As one interviewee said during a site visit to his property, “you can't rely on the flood maps without a site visit.” Site visits were useful for seeing the types of features that caused flood maps to be inaccurate. These included culverts that were undersized or clogged, eroding riverbanks, and buildings or other structures that were simply built too low or too close to the river.
Discussion
Preliminary data analysis indicated inaccessibility and inaccuracies in flood maps. The first point that most interviewees made when asked about flood maps was that they are inaccurate along the Black River and the mountain streams and brooks that feed into it. The other research methods, including community mapping and site visits, confirmed that neither the FEMA National Flood Hazard Layer nor the State of Vermont’s river corridor maps accurately represented the actual flooding in July 2023 in many parts of the study area, and certainly did not reflect people’s actual experience of flooding. There are several possible reasons for this inaccuracy. First, the FEMA flood maps have not been updated in over 15 years, and the updates at that time were minimal. Every flood event has changed the flow of the river, and there have been two major flood events in the past 15 years, as well as several less destructive events. The hydrologic changes in the river have resulted in changes in the flooding pattern; therefore, the flood maps do not, and cannot, accurately display recent flooding. Second, inundation flooding predicted by the FEMA flood map is not the only type of flooding impact in places such as Ludlow and Cavendish. The erosion caused by fast-moving rivers also results in damage, as do undercutting and seepage hazards from the long, intense pluvial events that caused the floods of 2023. The risks from this type of flooding are not displayed on the FEMA flood maps. FEMA’s in-progress updates to the National Flood Hazard Layer will fix some of the issues with accuracy, such as shifts in the river’s regular predicted course. However, the maps still cannot predict the risks caused by potential erosion, undercutting, and seepage. Creating maps that contain these elements would require a fundamental shift in how FEMA maps flood risk.
Interviews also revealed that many people feel that flood maps are inaccessible to the impacted community members and those trying to support them. Several causes of this inaccessibility were directly discussed in interviews. Some people stated it was difficult to figure out which maps were the most relevant. Others had challenges finding any of the flood maps at all. Multiple interviewees also discussed troubles related to trying to find answers to their questions about what the flood maps represent and how to interpret them. These may have design implications for future flood maps, a few of which are discussed below.
Conclusions
Potential Implications for Practice or Policy
As flooding across the country becomes more common and more severe, it is crucial to better understand how users interact with available flood prediction resources, including maps. Knowledge about their uses, limitations, and implications will help users make appropriate decisions regarding flooding issues. This is especially true in locations where flood hazard areas change often. Accuracy and accessibility currently present substantial challenges to users. Future flood risk mapping processes would benefit from incorporating the effects of erosion caused by rivers and streams. In addition to being accurate, flood maps should be created and made available in ways that prioritize accessibility. Such goals can be reached in several ways. For example, maps could be designed to be more easily interpreted by non-professional users. This could include making the definitions of map areas in any legends clearer, for example by having an extended definition pop up when hovering above a feature in the legend of an online map. Lowering the sensitivity of the online map viewers would also improve the maps for many users, making the maps slower but easier to navigate. Alternatively, map designers could create a companion tool—such as a pamphlet or online guide—to make the existing flood maps more easily understandable for community members. The purpose of these tools will depend on the criteria and constraints developed through further research and analysis conducted over the next year. Finally, federal and state bodies could provide community liaisons or user guides to help community members access, read, and use existing flood risk maps. These steps would also reduce pressure on local officials who are being asked questions about maps that they are not in charge of in the wake of a disaster.
Limitations
This research project took place within a specific geographical context, which impacts both the technical aspects of the findings and the data gathered through interviews. This specific region deals with specific types of flooding that are not found in every part of the country. Not every state needs a River Corridors program like Vermont’s, though some may benefit from similar interventions. Flood maps will not have the same inaccuracies across the entire country, though attention to local inaccuracies matters everywhere. Additionally, there are cultural attitudes within the study area that affected findings from the interviews. Many interviewees were distrustful of federal government programs, which may have affected how they interacted with the FEMA flood maps and with FEMA in the aftermath of the flooding. These attitudes may not be the same everywhere across the country.
This project also took place within an accelerated timeline. The scoping trip by the first author in March 2024 was quickly followed by a more extended fieldwork trip, which lasted from May 2024 through July 2024. The first author is continuing to gather in-person data for his thesis project through the end of July; further data will be gathered via Zoom. Because of this timeline, data analysis at this stage has been preliminary. Further research activities are discussed more in-depth below.
Future Research Directions
The first author will continue to gather data on flood maps in the coming months, including additional interviews and archival research. He will also conduct several additional data analysis activities. Interview data will be analyzed more thoroughly using thematic analysis. Additional maps of the area will be developed, along with a computer-based watershed model that models major flood events in the past accurately. Design criteria will be developed for a new mapping tool intended to be used by community members directly affected by flooding. The social vulnerability factors that affected how the communities within the study area were impacted by flooding will be investigated more in-depth. Finally, this research will be the subject of the first author’s master’s thesis paper, which will be submitted in April 2025. The first author will also present his findings at the Annual Natural Hazards Research and Applications Workshop in July 2025. The rest of the team will continue to develop research related to exploring and teaching related themes in the future. Second, third, and fourth authors will continue to collaborate with student researchers and citizen scientists to chronicle everyday processes of response, recovery, resilience, and mitigation work in these river valleys. The team will analyze how community members responding to floods collaborate with neighbors and officials, and how they navigate state policies, as well as relations with local landforms and waterways. Ongoing study of these dynamics will be applicable to scholars and practitioners of environment and disaster working across the Global North on rural riverine flooding, particularly in areas impacted by deindustrialization. Finally, in 2025-2026, the team will develop a mapping tool for communities to more easily document, communicate about, and plan for flooding events—one method for preventing such rifts from worsening in future events.
References
-
Smith, A. B. (2020). U.S. billion-dollar weather and climate disasters, 1980—present (NCEI Accession 0209268) [Data set]. NOAA National Centers for Environmental Information. https://doi.org/10.25921/STKW-7W73 ↩
-
McCullum, A., Stephens, S., & Dockser, C. (2023, July 24). Maps: Which areas in Vermont were hit hardest in the July flooding? Vermont Public. https://www.vermontpublic.org/2023-07-13/maps-which-areas-in-vermont-were-hit-hardest-in-this-weeks-flooding ↩
-
National Weather Service (2023). The Great Vermont Flood of 10-11 July 2023: Preliminary meteorological summary. U.S. Department of Commerce, National Oceanic and Atmospheric Administration. https://www.weather.gov/btv/The-Great-Vermont-Flood-of-10-11-July-2023-Preliminary-Meteorological-Summary ↩
-
Hayhoe, K., Wake, C. P., Huntington, T. G., Luo, L., Schwartz, M. D., Sheffield, J., Wood, E., Anderson, B., Bradbury, J., DeGaetano, A., Troy, T. J., & Wolfe, D. (2007). Past and future changes in climate and hydrological indicators in the US Northeast. Climate Dynamics, 28(4), 381–407. https://doi.org/10.1007/s00382-006-0187-8 ↩
-
Elwood, S., & Leitner, H. (1998). GIS and community-based planning: Exploring the diversity of neighborhood perspectives and needs. Cartography and Geographic Information Systems, 25(2), 77–88. https://doi.org/10.1559/152304098782594553 ↩
-
Strand, K. M. (2003). Principles of best practice for community-based research. Michigan Journal of Community Service Learning, 9(3). http://hdl.handle.net/2027/spo.3239521.0009.301 ↩
-
Auliagisni, W., Wilkinson, S., & Elkharboutly, M. (2022). Using community-based flood maps to explain flood hazards in Northland, New Zealand. Progress in Disaster Science, 14, 100229. https://doi.org/10.1016/j.pdisas.2022.100229 ↩
-
Kar, B., Sieber, R., Haklay, M., & Ghose, R. (2016). Public Participation GIS and Participatory GIS in the Era of GeoWeb. The Cartographic Journal, 53(4), 296–299. https://doi.org/10.1080/00087041.2016.1256963 ↩
-
Sieber, R. E. (2000). A PPGIScience? [Public participation geographic information systems]. Cartographica, 38(3/4), 1–4. ↩
-
Thompson, M. M. (2016). Upside-down GIS: The future of citizen science and community participation. The Cartographic Journal, 53(4), 326–334. https://doi.org/10.1080/00087041.2016.1243863 ↩
-
Pánek, J., Glass, M. R., & Marek, L. (2020). Evaluating a gentrifying neighborhood’s changing sense of place using participatory mapping. Cities, 102, 102723. https://doi.org/10.1016/j.cities.2020.102723 ↩
-
Rickenbacker, H., Brown, F., & Bilec, M. (2019). Creating environmental consciousness in underserved communities: Implementation and outcomes of community-based environmental justice and air pollution research. Sustainable Cities and Society, 47, 101473. https://doi.org/10.1016/j.scs.2019.101473 ↩
-
Vajjhala, S. (2005). Integrating GIS and participatory mapping in community development planning [Conference presentation abstract]. 2005 ESRI International Users Conference, San Diego, CA, United States. https://proceedings.esri.com/library/userconf/proc05/abstracts/a1622.html ↩
-
Jankowski, P. (2009). Towards participatory geographic information systems for community-based environmental decision making. Journal of Environmental Management, 90(6), 1966–1971. https://doi.org/10.1016/j.jenvman.2007.08.028 ↩
-
Cadag, J. R. D., & Gaillard, J. (2012). Integrating knowledge and actions in disaster risk reduction: The contribution of participatory mapping. Area, 44(1), 100–109. https://doi.org/10.1111/j.1475-4762.2011.01065.x ↩
-
Harris, T., & Weiner, D. (1998). Empowerment, Marginalization, and “Community-integrated” GIS. Cartography and Geographic Information Systems, 25(2), 67–76. https://doi.org/10.1559/152304098782594580 ↩
-
Robinson, J. A., Block, D., & Rees, A. (2017). Community geography: Addressing barriers in public participation GIS. The Cartographic Journal, 54(1), 5–13. https://doi.org/10.1080/00087041.2016.1244322 ↩
-
Robbins, P. (2003). Beyond ground truth: GIS and the environmental knowledge of herders, professional foresters, and other traditional communities. Human Ecology, 31(2), 233–253. https://doi.org/10.1023/A:1023932829887 ↩
-
McCall, M. K. (2003). Seeking good governance in participatory-GIS: A review of processes and governance dimensions in applying GIS to participatory spatial planning. Habitat International, 27(4), 549–573. https://doi.org/10.1016/S0197-3975(03)00005-5 ↩
-
U.S. Census Bureau. (n.d.-a). Cavendish town, Windsor County, Vermont—Census Bureau Profile. Retrieved October 3, 2024, from https://data.census.gov/profile/Cavendish_town,_Windsor_County,_Vermont?g=060XX00US5002712250 ↩
-
U.S. Census Bureau. (n.d.-b). Ludlow town, Windsor County, Vermont—Census Bureau Profile. Retrieved October 3, 2024, from https://data.census.gov/profile/Ludlow_town,_Windsor_County,_Vermont?g=060XX00US5002741275 ↩
-
Bernard, H. R. (2011). Research methods in anthropology: Qualitative and quantitative approaches (5th ed). AltaMira Press. ↩
Bezanson, N., Reddy, E., Boke, C., Kelly, S., & Santi, P. (2025). Developing a New Interdisciplinary Model for Mapping Flood Risks and Impacts. (Natural Hazards Center Mitigation Matters Research Report Series, Report 24). Natural Hazards Center, University of Colorado Boulder. https://hazards.colorado.edu/mitigation-matters-report/developing-a-new-interdisciplinary-model-for-mapping-flood-risks-and-impacts