Mitigating Homeowner Flood Risk After Harvey
An Assessment of Houston’s Home Repair and Elevation Programs
Publication Date: 2025
Abstract
This report describes our investigation of a homeowner repair and mitigation assistance program—managed initially by the city of Houston and later by the Texas General Land Office—to help Houston homeowners affected by Hurricane Harvey and other flooding events. Specifically, our study focused on the social vulnerability of neighborhoods eligible to participate in the program and the home repair completion rates in these neighborhoods. We also investigated how program participants perceived their previous flooding experiences and the program’s offer to elevate their homes to mitigate future flood risk. We collected data using multiple methods. First, we conducted surveys and short interviews with 50 households. Second, the first and second authors—who are also faculty members—led undergraduate students on a structured field trip to neighborhoods participating in the program. During the field trip, students engaged with residents by having informal conversations with them about their experiences and attended a presentation by two elevation experts during which they had the opportunity to ask questions. Student observations and the presentation were recorded as qualitative data. Third, we reviewed public documents about the program’s project completion rates—by which we mean the number of home renovation projects completed out of the total number of homes that qualified for assistance. Our findings showed that project completion rates were lower in more socially vulnerable neighborhoods. They also revealed that homeowners in frequently flooded areas were more likely to elevate their homes. Interviews showed the importance of government aid in facilitating home elevation. Participants had diverse views on flood risk and the benefits of raising homes. Some homeowners chose not to elevate their homes because they wanted to preserve the original aesthetic of their community. Other homeowners were concerned about the accessibility of ramps to elevated homes. Several interviewees said they valued ramp designs in elevated homes that addressed their mobility challenges.
Introduction
After Hurricane Harvey, the Federal Emergency Management Agency (FEMA) updated the boundaries of the 100-year and 500-year floodplains in Houston (Shao, 20181). During the same period, the Harris County government passed regulations requiring newly constructed single-family homes outside the floodplain to be elevated 1 foot above the floodplain and those located inside the floodplain to be elevated 2 feet above the floodplain (Harris County Flood Control District, n.d.2; Pytel, 20223). The City of Houston designed the Harvey Homeowner Assistance Program (HoAP) to provide homeowners residing in areas at risk of flooding with financial assistance for repairing and elevating their home. The city closed HoAP after 1 year of operation. A similar state-level program known as the Homeowner Assistance Program (HAP)—which is administered by the Texas General Land Office (GLO)—subsequently began operating in the City of Houston. HoAP and HAP provided various types of homeowner assistance in communities affected by Harvey or at risk of flooding, including repairing, rehabilitating, or reconstructing homes; elevating homes above flood level in coordination with reconstruction assistance; and temporary relocation assistance (Texas General Land Office, n.d.4). They were designed to assist low to moderate-income, and historically hard-to-reach vulnerable populations.
This report describes our multi-methods study of HoAP and HAP. Our data collection methods included a structured fieldtrip for 25 undergraduate students to flood-prone neighborhoods where they had the opportunity to learn from program participants about their experiences. The principal investigators also conducted interviews and surveys with 50 homeowners and analyzed program data and secondary data to assess the social vulnerability of neighborhoods eligible to participate in the programs.
The purpose of the study was to understand the relationship between social vulnerability, prior flooding experiences, and the completion of home elevation projects in Houston. We also sought to understand how homeowners perceived the opportunity to elevate their homes and whether their decision was influenced by demographic, practical, or perceptual factors. We aimed to advance mitigation policy by providing insight into how to develop targeted outreach to homeowners about home elevation in flood-prone areas.
Literature Review
Houston’s demographic makeup is highly varied, with significant numbers of residents identifying as Hispanic or African American as well as a high number of immigrant residents. There are also many neighborhoods with economic disadvantages and inadequate infrastructure. These communities often experience more adverse outcomes in disasters due to factors such as poverty, language barriers, and limited access to health care and transportation, which can hinder emergency response and recovery efforts (Peacock et al., 20145).
Research shows that low-income neighborhoods in Houston tend to be at lower elevations, putting them at greater risk of flooding, even after taking factors such as latitude, longitude, and population density into account (Lu, 20176). Using data from Google Maps and the American Community Survey, Lu (2017) found that several measures of neighborhood disadvantage in Houston—including lower median household income, poverty, and higher rates of ethnic minorities and non-citizens—were linked to lower neighborhood elevations that are more vulnerable to flooding. Lu (2017) also showed that disadvantaged neighborhoods tend to be at lower elevations in most of the 20 largest metropolitan areas in the United States, underscoring a new aspect of environmental inequality and its consequences for marginalized communities.
Zahran et al. (20087) found that communities with socially vulnerable populations in Eastern Texas experienced higher rates of casualties during floods. Socioeconomic advantages and engagement in mitigation efforts played a significant role in reducing casualty rates, particularly in communities with lower social vulnerability.
Numerous international studies have explored how individuals make decisions and the factors that impact their choices about flood risk mitigation (Botzen et al., 20138; Grothmann & Reusswig, 20069; Kellens et al., 201310). Grothmann and Reusswig (2006) utilized survey data from Germany and found that individuals’ decisions about purchasing flood mitigation devices, elevating their homes, or undertaking other structural mitigation measures were strongly influenced by their perception of personal flood risk and the effectiveness of the mitigation measures. Poussin et al. (201411) used a combination of revealed preference and stated preference data from France to investigate both the number of flood mitigation measures present in households and the intention to implement such measures. Botzen et al.’s (2013) study provided insights into the motivations, limitations, and preferences of homeowners. They found that a significant proportion of homeowners in the Netherlands (52%) were willing to invest $10,000 to raise the level of their house and protect it from potential flooding. Interestingly, the authors also found that people value the option to eliminate flood risk through adaptation measures more than they value flood insurance. This indicates that they are willing to pay for risk elimination through elevation.
Studies have also looked at obtaining loans to raise the base of an existing house or to build a house on stilts (Danh & Mushtaq, 201112). The availability of federal government grants for mitigation—such as the FEMA’s Hazard Mitigation Grant Program, Flood Mitigation Assistance Program, and Pre-Disaster Mitigation Grant Program—supports the decision to elevate homes, as people might not have the personal funds or credit to afford this measure (Al Assi et al., 202313; Mobley et al., 202014). Collectively, these studies underline how both physical and social factors play a role in influencing individuals’ choices to elevate their homes in flood areas. However, none of these studies look at people who were already participating in a reconstruction program where they had the opportunity to raise their homes.
Flooding in Houston, Texas, is the product of natural vulnerability and anthropogenic exacerbation, marked by a history of catastrophic events that have shaped the region’s urban development and policymaking frameworks. Houston’s geographical setting on a flat coastal plain, combined with its proximity to the Gulf of Mexico, inherently predisposes it to flooding risks (Cohen et al., 201815). The city’s rapid urban expansion since the mid-20th century has further intensified these vulnerabilities by reducing natural land cover and overwhelming existing drainage systems (Zhang et al., 201816).
Hurricane Harvey, which struck Houston in August 2017, stands as a landmark event in this history, highlighting the acute vulnerability of the city to catastrophic flooding. Harvey dumped an estimated 27 trillion gallons of rain over Texas, leading to widespread flooding that affected over 300,000 structures and displaced more than 30,000 people in Houston alone (Texas Division of Emergency Management, n.d.17). The economic damages were staggering—estimated at approximately $125 billion—making Harvey one of the costliest disasters in U.S. history (National Hurricane Center, 201818). The hurricane’s aftermath exposed critical weaknesses in Houston’s flood management systems, including outdated infrastructure and inadequate urban planning that failed to keep pace with rapid development (Malecha et al., 202119).
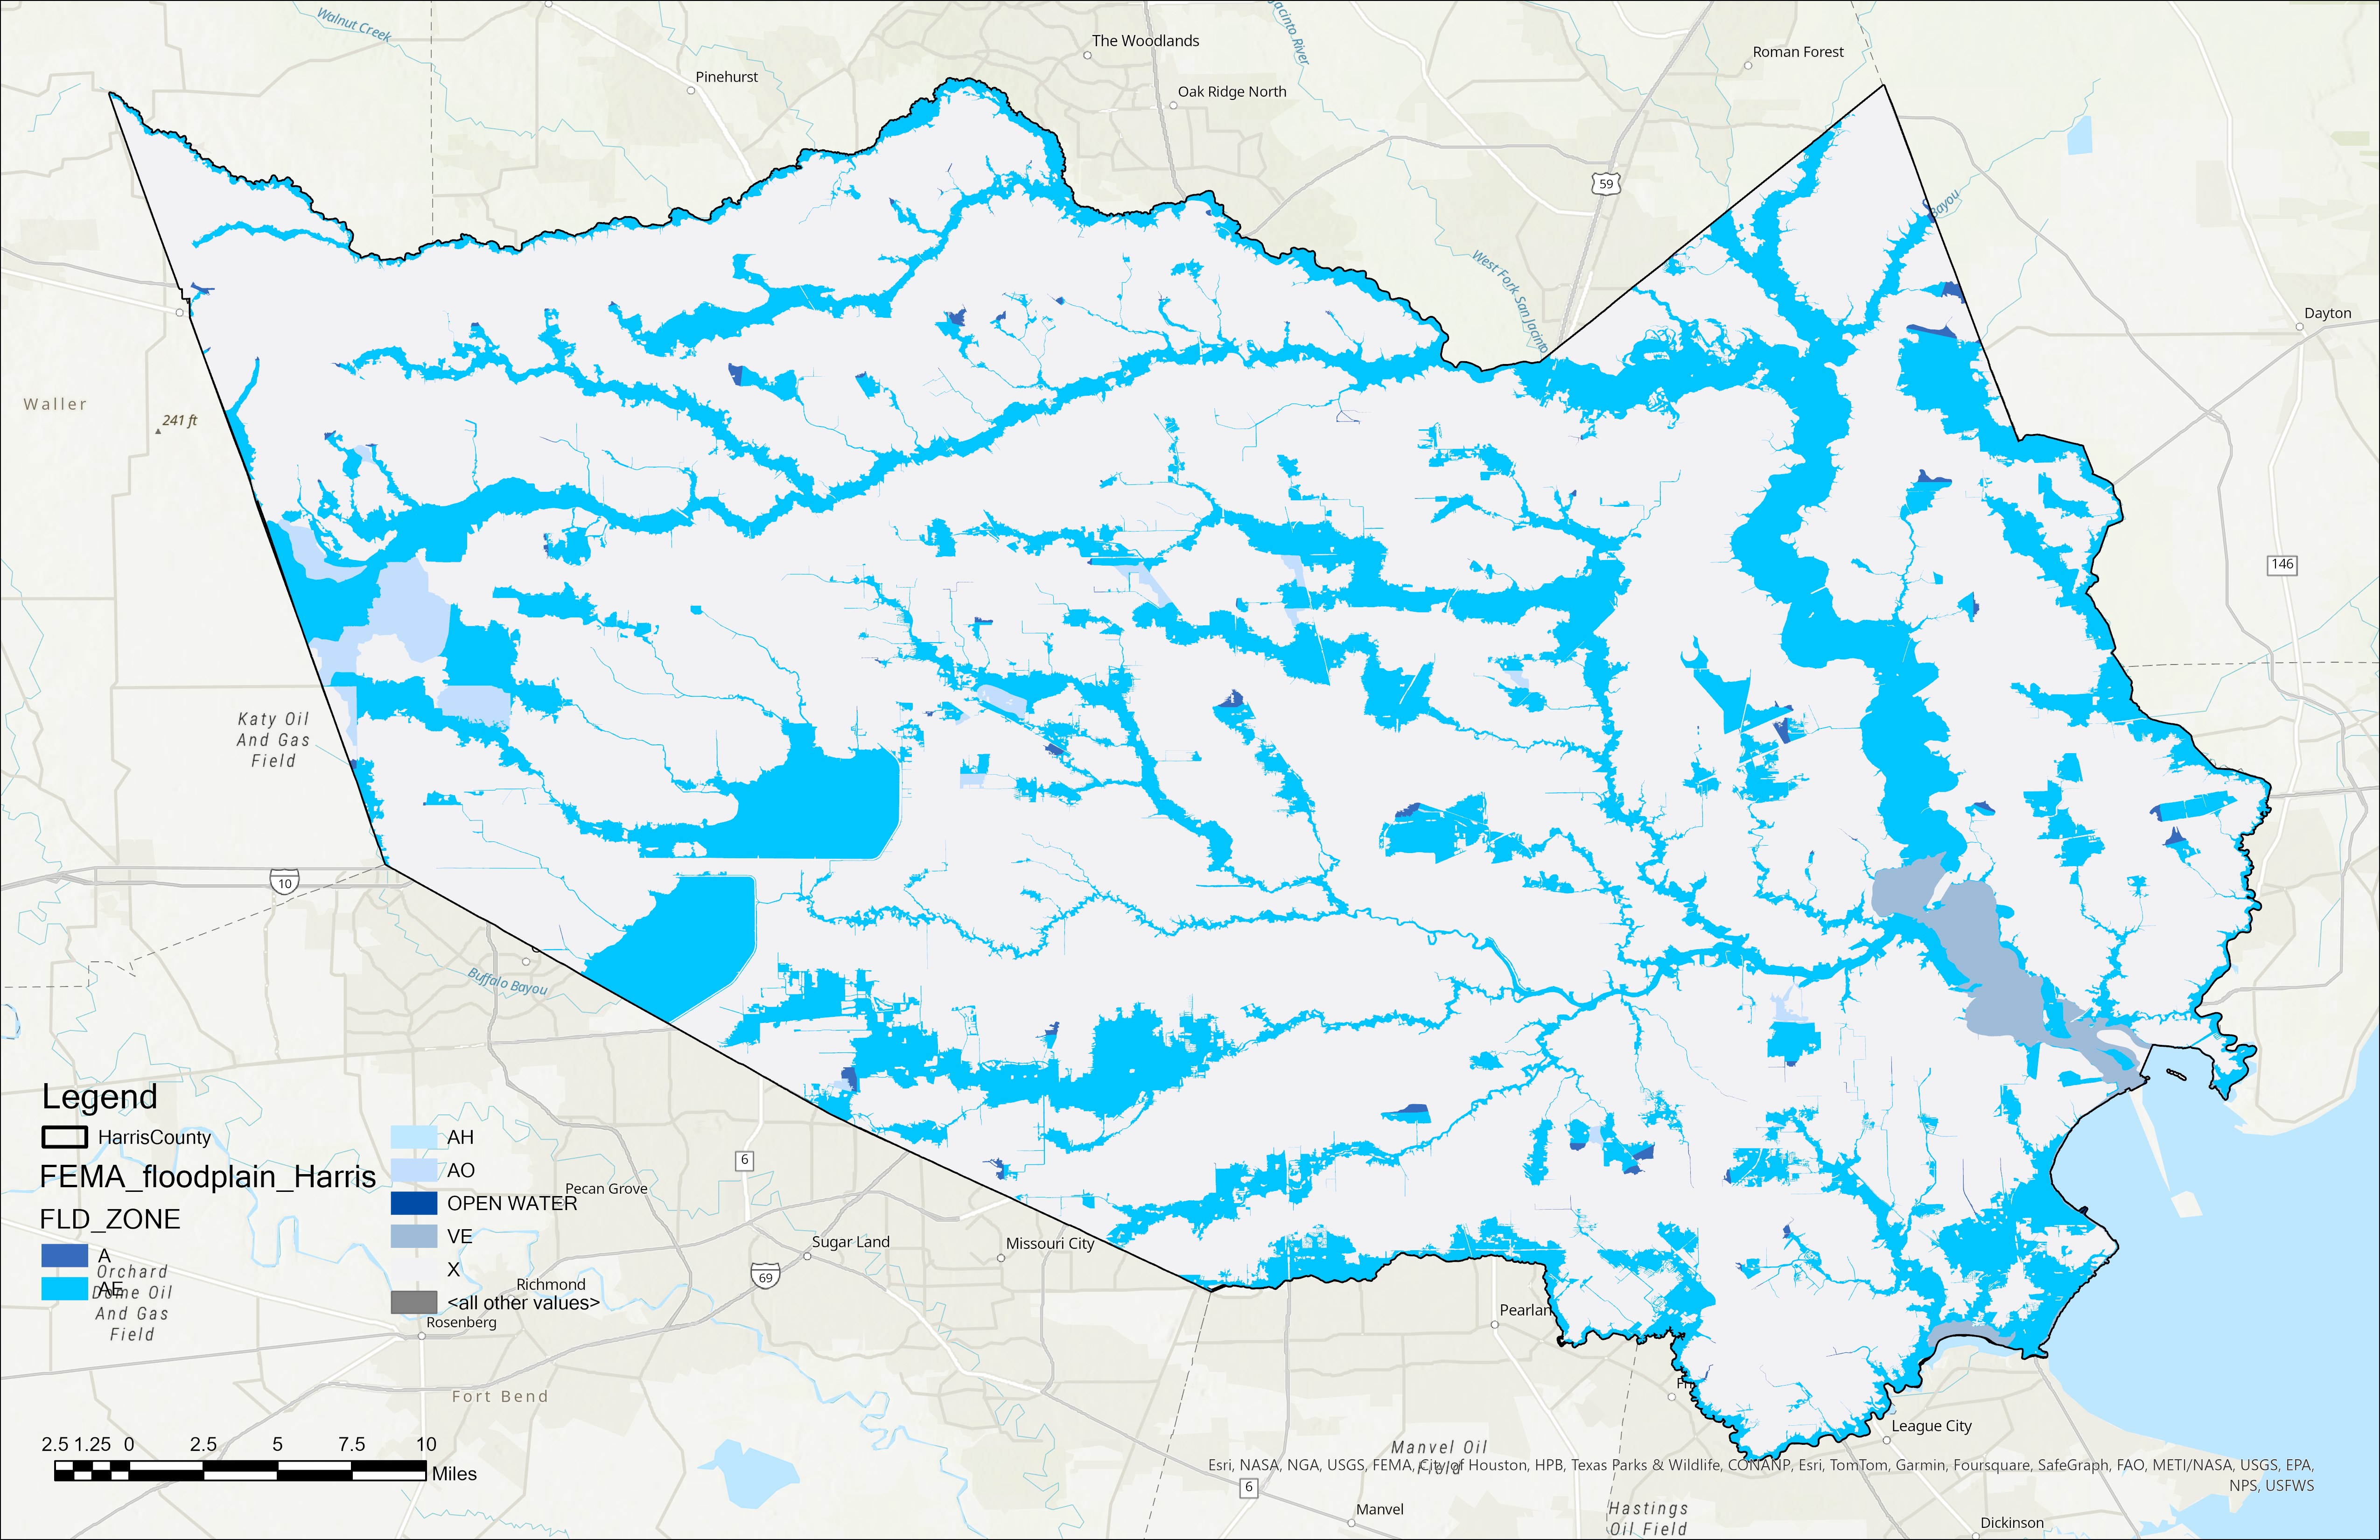
Houston’s floodplains are extensively mapped by FEMA (see Figure 1). These maps are regularly updated to reflect changes in topography, hydrology, and urban development. However, the dynamic nature of land use and climate in the region means these maps can quickly become outdated, posing challenges to accurate risk assessment and management (Smiley et al., 202020).
Figure 1. Federal Emergency Management Agency Floodplain Map of Harris County, Texas
Research Question
Our study addressed the following research questions:
- How does the demographic makeup of Houston correlate with social vulnerability to disasters?
- How do social, personal, and demographic factors influence home elevation among participants in home repair programs?
- What are the practical considerations and perceptions of flood risks that influence homeowners' decisions to elevate their homes?
Research Design
Study Site and Access
Houston, Texas, is a city that showcases the intricate balance between fast urban growth and susceptibility to natural hazards, especially floods. We chose Houston purposefully because of its vulnerability to flooding worsened by its geographic and topographic characteristics. Houston's social and cultural backdrop is a community with differences in socioeconomic status, impacting both exposure to risk and the ability to bounce back from challenges. Our research primarily focused on individuals involved in home repair programs, which concentrate on areas frequently affected by floods. These areas are home to a mix of long-time residents and transient populations, creating challenges and opportunities for engaging with community members on mitigation strategies and resilience practices. Collaboration with Texas Housers—a nonprofit organization dedicated to promoting housing justice and advocating for low-income families—facilitated our access to research participants. This group has connections within the communities they serve; their established presence and continuous engagement efforts helped build trust among residents who may have initially been hesitant about participating in research activities.
Data Collection
Field Trip
A group of 25 undergraduate students from Texas A&M University's Urban and Regional Studies Capstone Course and two faculty members organized a field trip to 13 flood-affected neighborhoods for observation purposes. In addition, our students heard firsthand during the field trip from five community members who experienced flooding. The field trip lasted approximately 8-10 hours. We chose to visit 13 selected neighborhoods, because of their proximity to the Bayou and the high concentration of flood-prone homes. During our visit, we met with residents, home elevation experts, and representatives from Texas Housers. Representatives from Texas Housers introduced us to four participants in their program and arranged for us to observe other homes within the selected neighborhoods. The field trip allowed us to gather valuable data through observations, informal conversations, and a formal presentation on home elevation aimed at providing practical solutions to residents. Students’ fieldnotes were shared with lead investigators for this project and analyzed as part of our qualitative data.
Following the neighborhood visits, we met with two elevation specialists at the Texas Housers office who gave a presentation on the technical and financial complexities of home elevation. This meeting deepened our understanding of the challenges that homeowners face in elevating their homes. We recorded the meeting and the question-and-answer session that followed and analyzed it as part of our interview data.
Overall, this field trip significantly contributed to our findings by providing firsthand insights into the lived experiences of residents, their perceptions of flood risks, and their views on home elevation. The observations and interactions directly informed our study's conclusions on the social, practical, and demographic factors influencing home elevation decisions in flood-prone communities.
Secondary Data Collection and Analysis
We used secondary data to assess the need for home elevation based on 100-year floodplain maps. To understand the physical factors affecting homeowners’ elevation choices, we analyzed the following Geographic Information Systems (GIS) data sets and topics:
- The National Flood Hazard Layer (FEMA, n.d.21): flooding frequency
- Texas Basemap—Lidar Elevation Data (Texas Natural Resources Information System and Texas Geographic Information Office, 202322): topography
To understand the relationship between social factors and homeowners’ elevation choices, we analyzed social vulnerability data from the Centers for Disease Control and Prevention’s (CDC, 202023) Social Vulnerability Index. We also analyzed publicly available data from the City of Houston's HoAP program to understand the number of homes that were elevated and their location (City of Houston, n.d.-a24).
We sent a public information request to the Texas GLO asking for HAP’s public records about the HAP such as maps, data, charts, and program guidelines related to the elevation requirements and rebuilding/reconstruction of homes in the 100-year and 500-year floodplain; the sociodemographic information of the applicants for each home assisted; and, whether the construction was on the foundation (slab, pier or/and beam). We did not receive their information in time for inclusion in this report but will use it in a future publication.
Surveys and Interviews
During multiple site visits, the lead investigators on the research team conducted surveys and interviews with 50 homeowners participating in the HoAP program managed by the City of Houston or the HAP program managed by Texas GLO. The research participants knew about or had been offered the opportunity to elevate their homes. The purpose of the interviews and surveys was to explore how they perceived home elevation.
We recruited participants from 13 selected neighborhoods across Houston that were identified on maps as being affected by flooding. We focused on multiple clusters in the city, specifically traveling to areas north, south, west, and east of downtown. This approach allowed us to capture diverse experiences from various parts of the city affected by flooding. Table 1 provides an overview of the demographic and other characteristics of our survey and interview sample.
Table 1. Select Characteristics of Research Participants
| Agea | 20-39 40-59 60-79 80+ Not Provided |
3 34 9 2 |
6 68 18 4 |
| Gender | Female Male Not Provided |
14 2 |
28 4 |
| Race | Black or African American American Indian or Alaska Native Mixed-Race Other |
3 5 10 |
6 10 20 |
| Ethnicity | Hispanic Non-Hispanic Not Provided |
33 3 |
66 6 |
| Survey Language | English Spanish |
8 |
16 |
| Monthly Incomeb | $0 to $499 $500 to $999 $1,000 to $1,499 $1,500 to $1,999 $2,000 to $2,499 $2,500 to $2,999 $3,000 to $3,499 $3,500 to $3,999 $4,000 to $4,499 $4,500 to $4,999 Not Provided |
7 11 4 7 3 2 4 2 1 7 |
14 22 8 14 6 4 8 4 2 14 |
| Disabilityc | Has a Disability Does not Have a Disability Not Provided |
19 5 |
38 10 |
| Elevated Home | Yes No |
13 |
26 |
We administered surveys and interviews using a door-to-door approach. We asked respondents to choose whether to do the survey and interview inside or outside of their homes. Most chose inside because participants wanted us to see their new homes. The duration of each visit varied, lasting between 20 minutes to over an hour (most were around 40 minutes).
Interviews were recorded, but in cases where participants did not want to be recorded, we took detailed notes instead. The survey measured variables such as demographics, flood experiences, decisions about home elevation, and perceptions of government assistance. A follow-up interview was conducted to ensure consistency of the survey data collected. See Table A1 in the Appendix for examples of survey questions that we asked and Table A2 for examples of interview questions.
For the quantitative analysis, survey data from 50 participants was analyzed using descriptive statistics to summarize key variables such as demographics, flood experiences, and home elevation decisions. Excel was used to calculate means, medians, and standard deviations. Chi-square tests were conducted to identify significant relationships between categorical variables, such as age, disability status, and the decision to elevate homes.
For the qualitative analysis, interview transcripts were coded and analyzed thematically. Major themes such as government assistance, perceptions of flood risks, neighborhood aesthetics, and practical challenges like accessibility were identified and explored. Thematic coding allowed us to extract recurring patterns across participants’ responses, and Dedoose software was used to organize and analyze the qualitative data systematically. These combined methods provided a comprehensive understanding of the factors influencing homeowners' decisions regarding elevation and their experiences with flooding and government programs.
Ethical Considerations and Researcher Positionality
The investigators ensured that the research was conducted ethically and in accordance with our protocol, which was approved by the Institutional Review Board at Texas A&M University. We approached the project with respect for the community and obtained informed consent from all participants before involving them in any research activities. Participants were compensated with $20 and will be provided with access to information resulting from their participation. Participants’ privacy was protected throughout the research process, with all collected information treated confidentially and handled with care. For example, to ensure participants' anonymity, we assigned pseudonyms to all individuals mentioned in the study. This method protected their identities while still allowing us to provide detailed insights into their experiences. We plan to share the results with participants through follow-up communications, including focus group discussions and presentations in person and via phone conference.
Findings
Analysis of Secondary Data From the Social Vulnerability Index
The CDC Social Vulnerability Index is a quantitative measure developed to assess the susceptibility of communities to hazards (Flanagan et al., 201125). It integrates socioeconomic, demographic, and housing variables to evaluate the relative vulnerability of different populations, especially during disasters. The index has since been widely applied in disaster management and resilience planning across various geographical settings (Ramesh et al., 202226). This comprehensive approach facilitates a nuanced understanding of the overall social vulnerability of communities.
In Houston, Texas, the issue of social vulnerability is particularly acute due to the city’s diverse and uneven socioeconomic makeup. Houston’s expansive urban environment is characterized by significant disparities in income, racial, and ethnic composition, as well as access to essential services, which all contribute to varying degrees of vulnerability across its communities. Figure 2, for example, shows the percentage of people living below the 150% poverty line in areas with high flooding risk in Harris County. The census tracts with elevated poverty rates are depicted in red.
Figure 2. Percentage of Persons Living Below the 150% Poverty Line in Harris County, Texas, by Census Tract
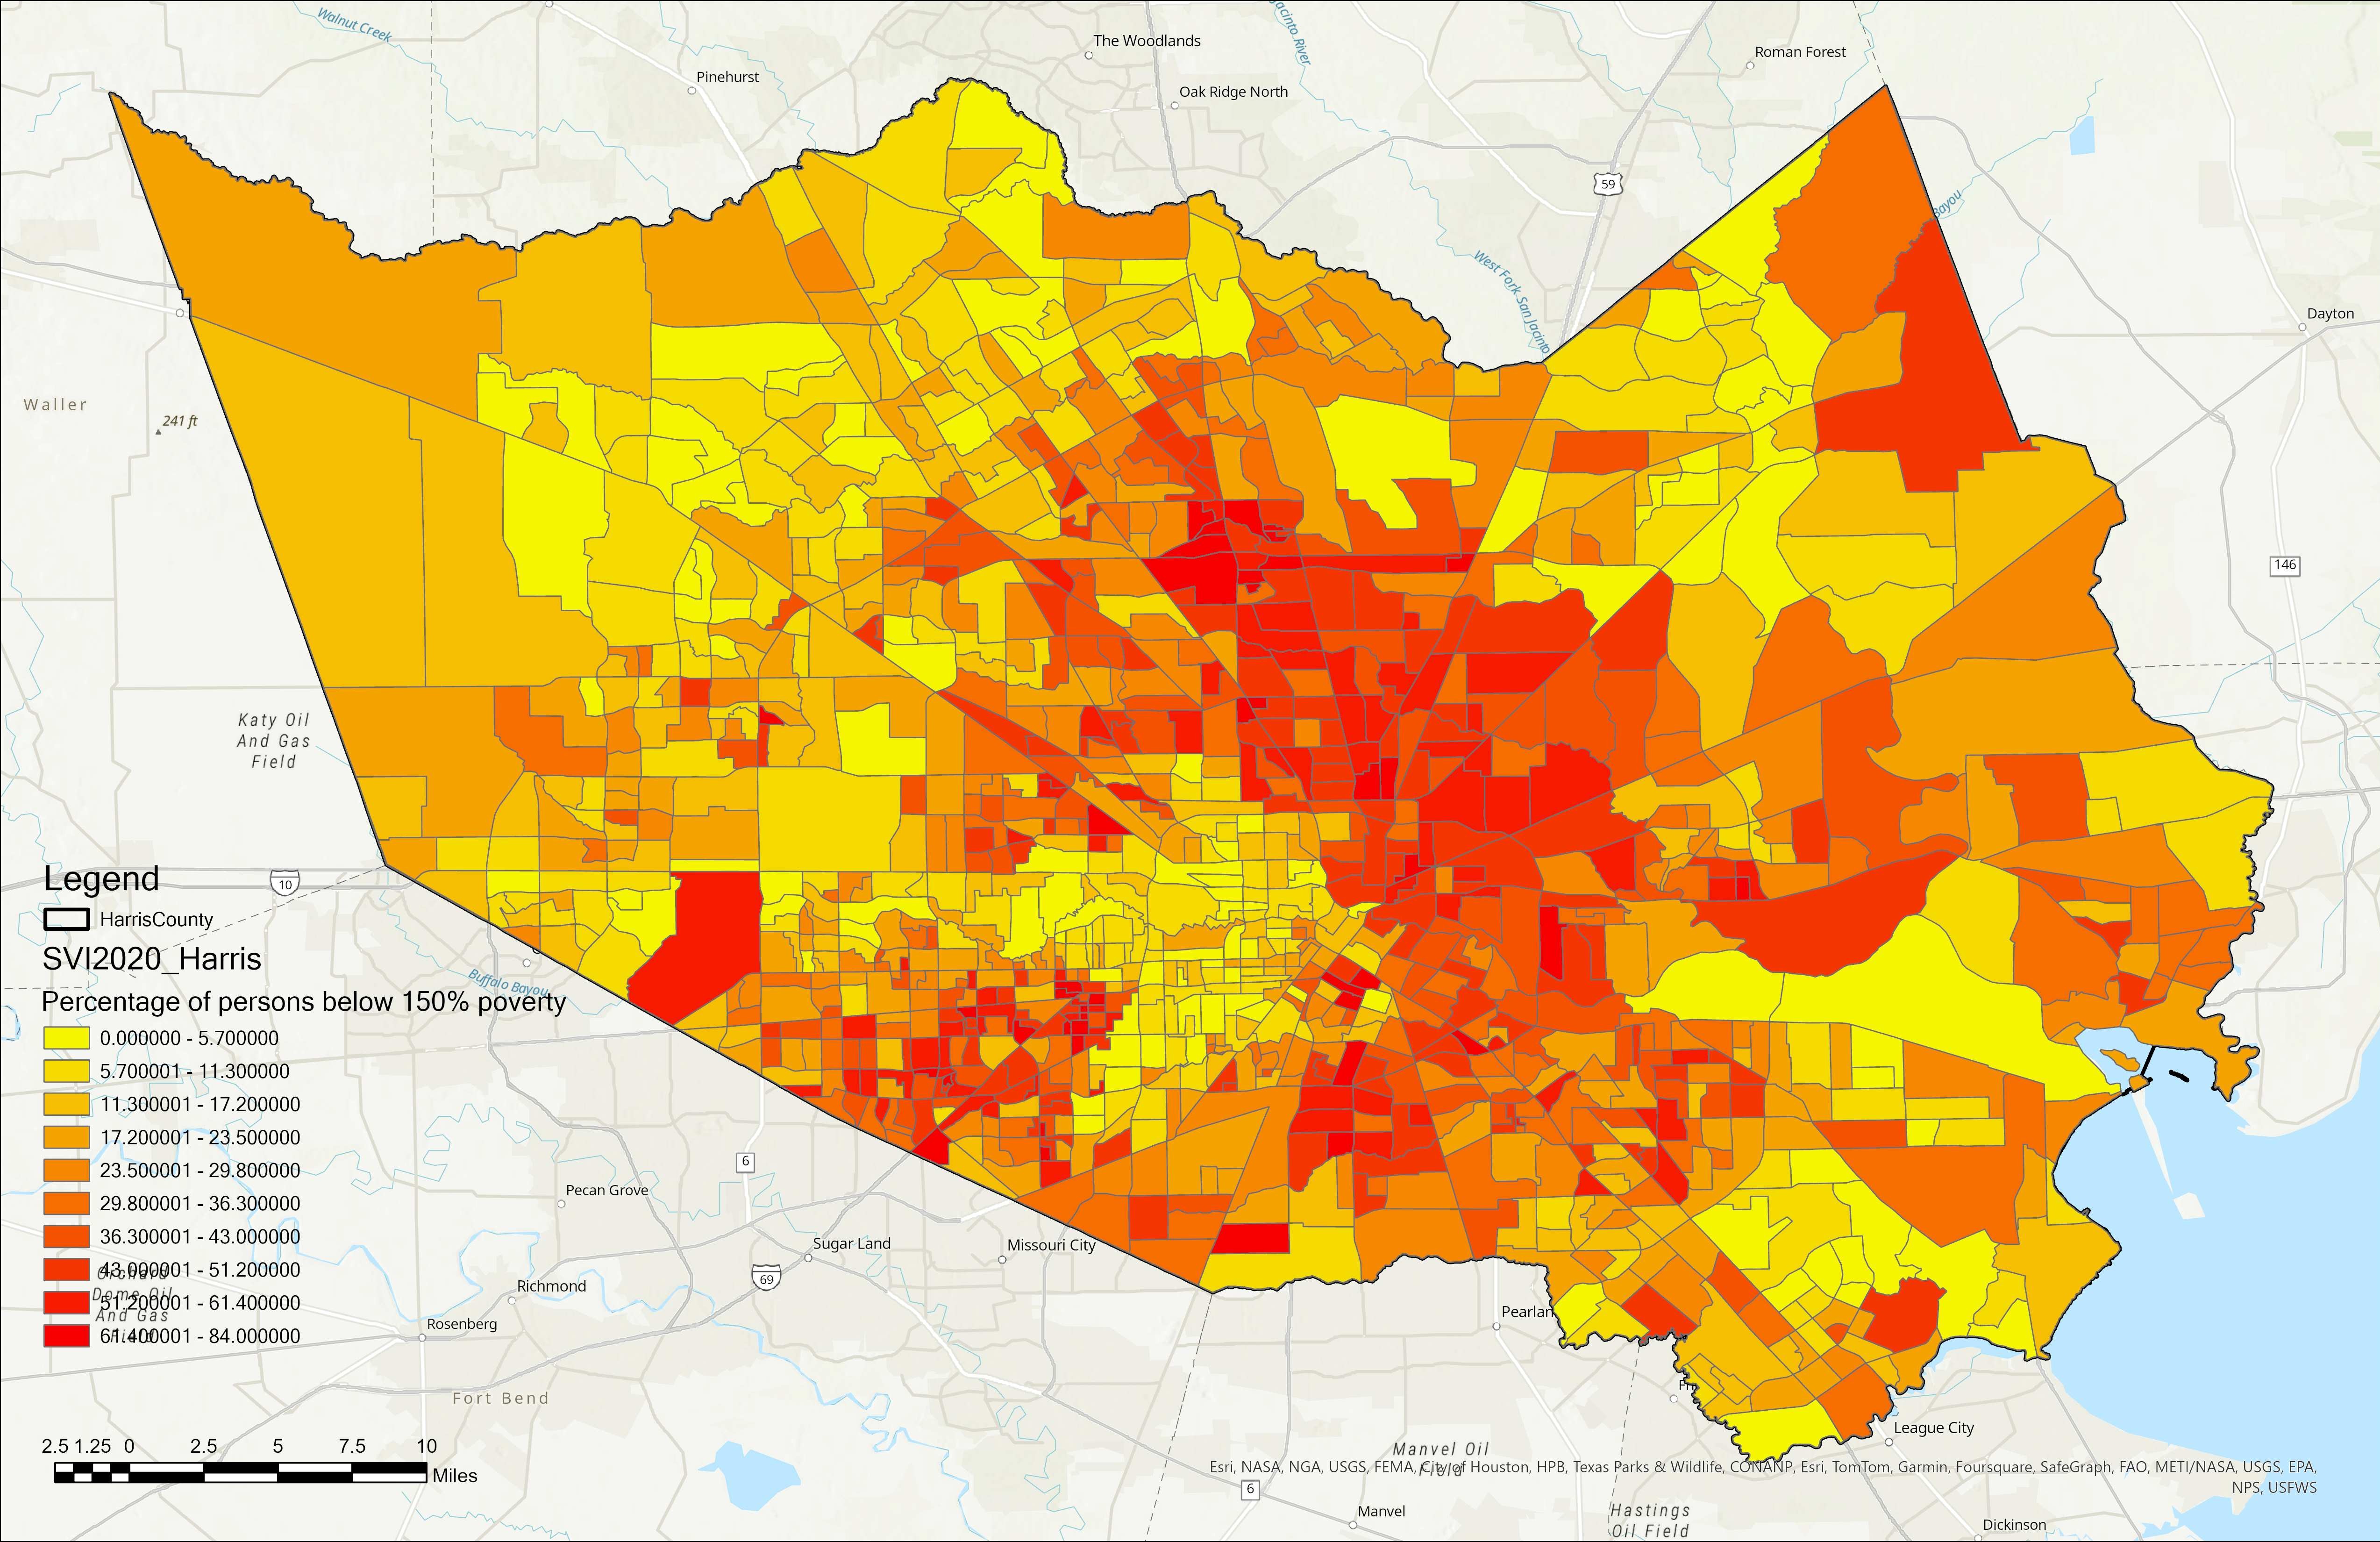
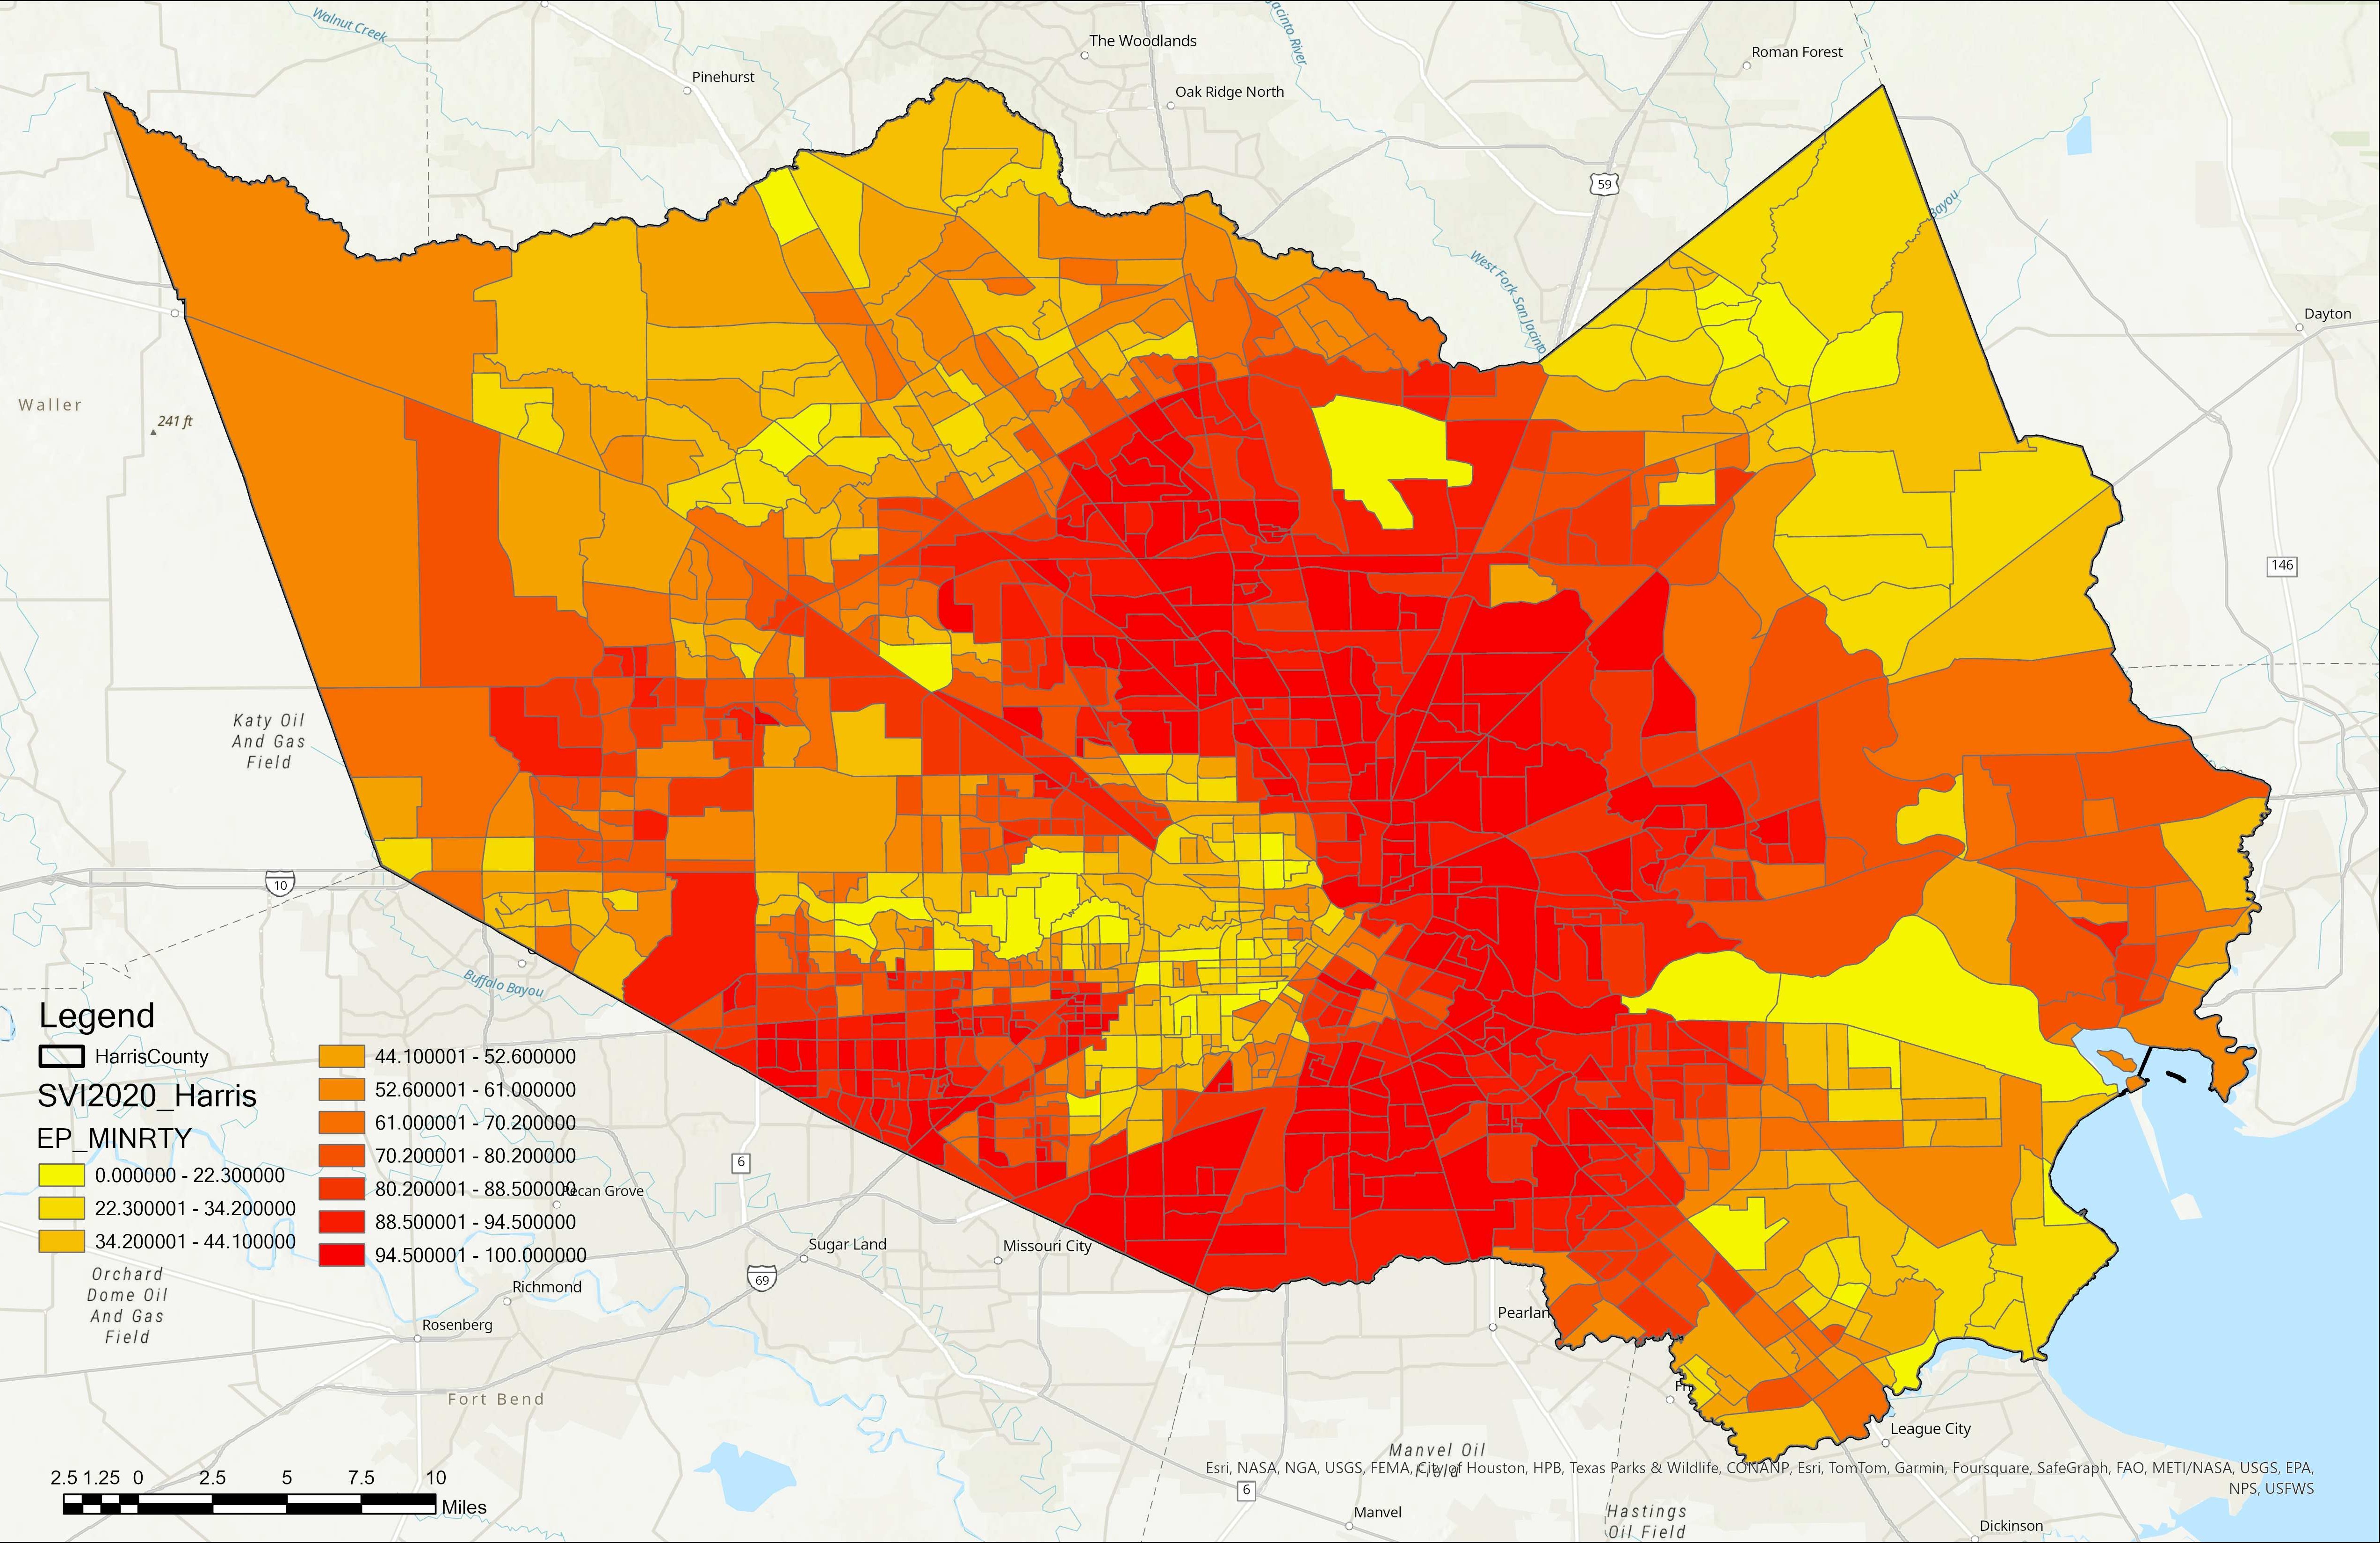
Figure 3 shows the percentage of the nonwhite population living in each census tract in Harris County. Red shading denotes census tracts with populations that have higher percentages of minorities. Poverty and racial disparities are often exacerbated during environmental emergencies, such as the frequent and severe flooding events the city experiences.
Figure 3. Percentage of Nonwhite Population in Harris County, Texas, by Census Tract
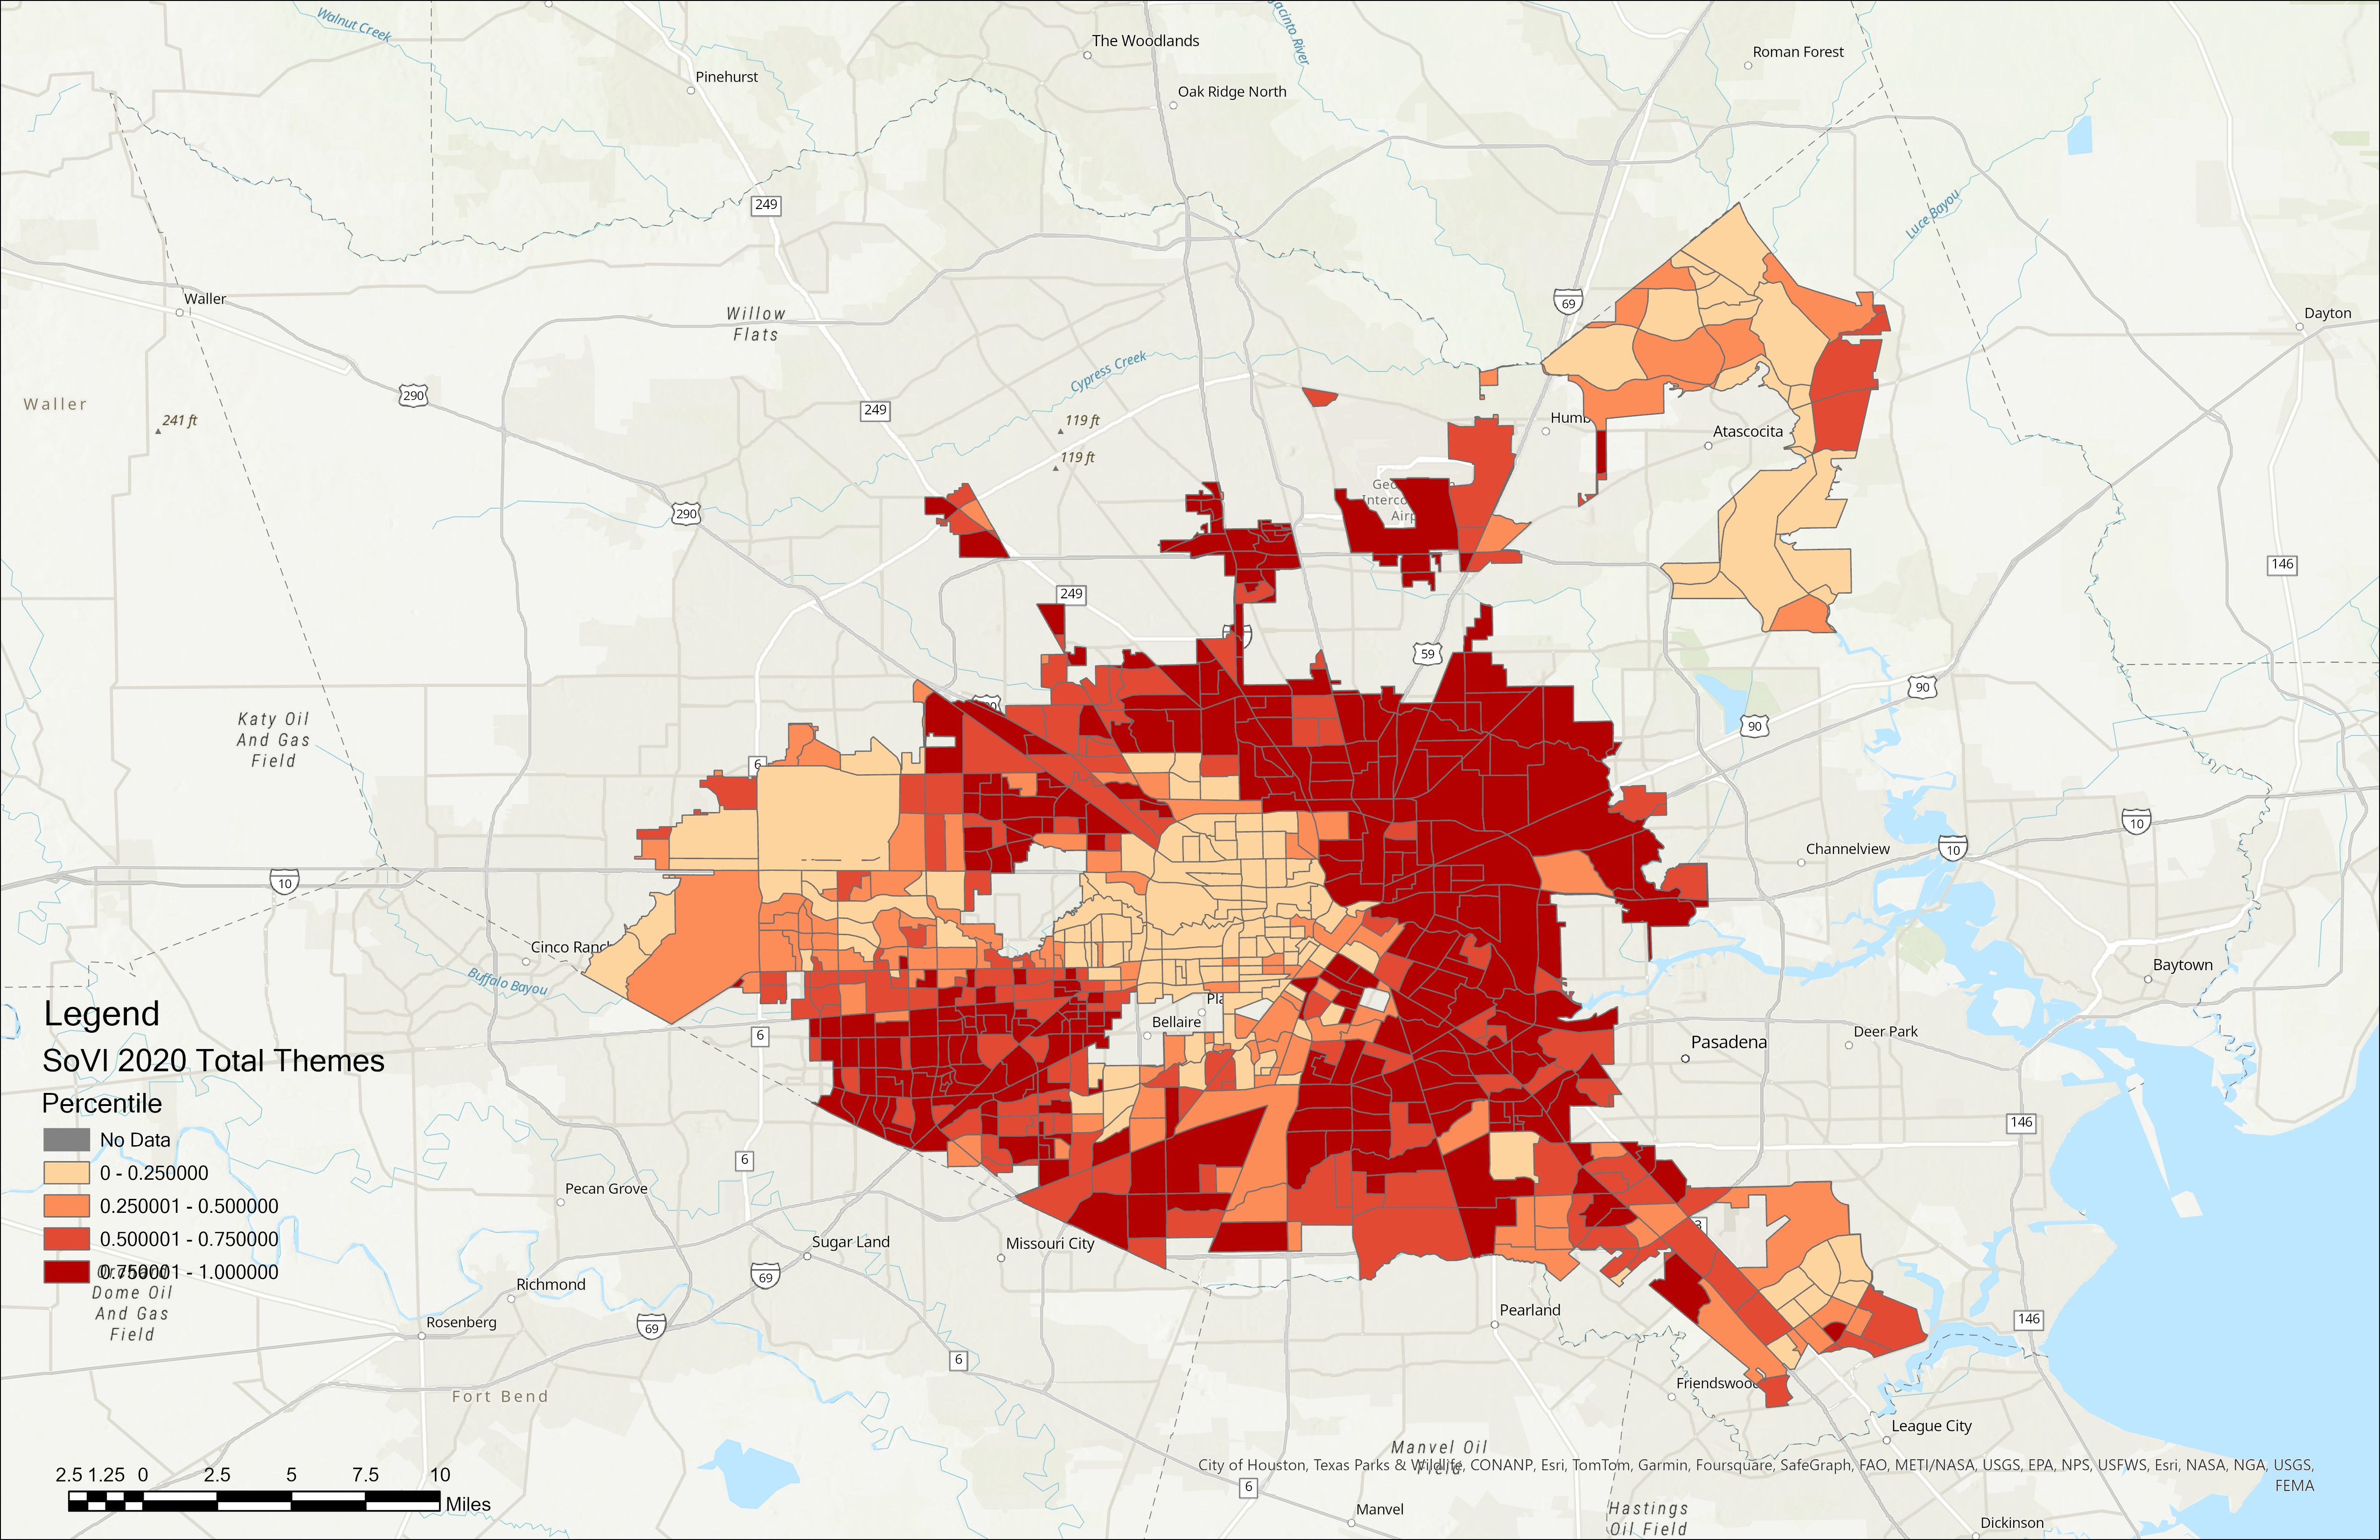
The Social Vulnerability Index integrates various dimensions, such as socioeconomic status, household characteristics, racial and ethnic minority status, and factors related to housing and transportation. Figure 4 displays the spatial distribution of social vulnerability levels, highlighting significant regional disparities. The City of Houston (n.d.-b27) established super neighborhoods to encourage collaboration among residents of neighboring communities, enabling them to collectively identify, prioritize, and address the needs and concerns of the larger community. According to our analysis, the super neighborhoods located on the eastern and southern sides of the city exhibit heightened levels of social vulnerability. The darker the shading of the census blocks, the higher their social vulnerability percentiles.
Figure 4. Total Social Vulnerability Percentiles of Census Tracts in Harris County, Texas
The interviewers identified clusters of newly constructed and recognizable “Harvey homes” in high-risk neighborhoods. However, there was a notable lack of new construction in more affluent areas like Meyerland and Brays Bayou, which also have lower social vulnerability index scores. While some homes in these neighborhoods may have been elevated, they were not torn down and replaced, as seen in lower-income neighborhoods. This disparity suggests that homes are being treated differently based on location and income status, and as a result, no respondents were identified in these more affluent areas. This pattern underscores the geographic clustering of risk factors and points to the need for targeted interventions in these areas to mitigate the adverse effects of social disparities.
Current Status of the Homeowner Assistance Program
As of May 31, 2024, the City of Houston’s HoAP had completed the reconstruction of 158 homes and the GLO’s HAP program had completed 1,608 homes in Houston. As described above, our analysis for this report focuses on HoAP project completion; we will analyze HAP data in the future.
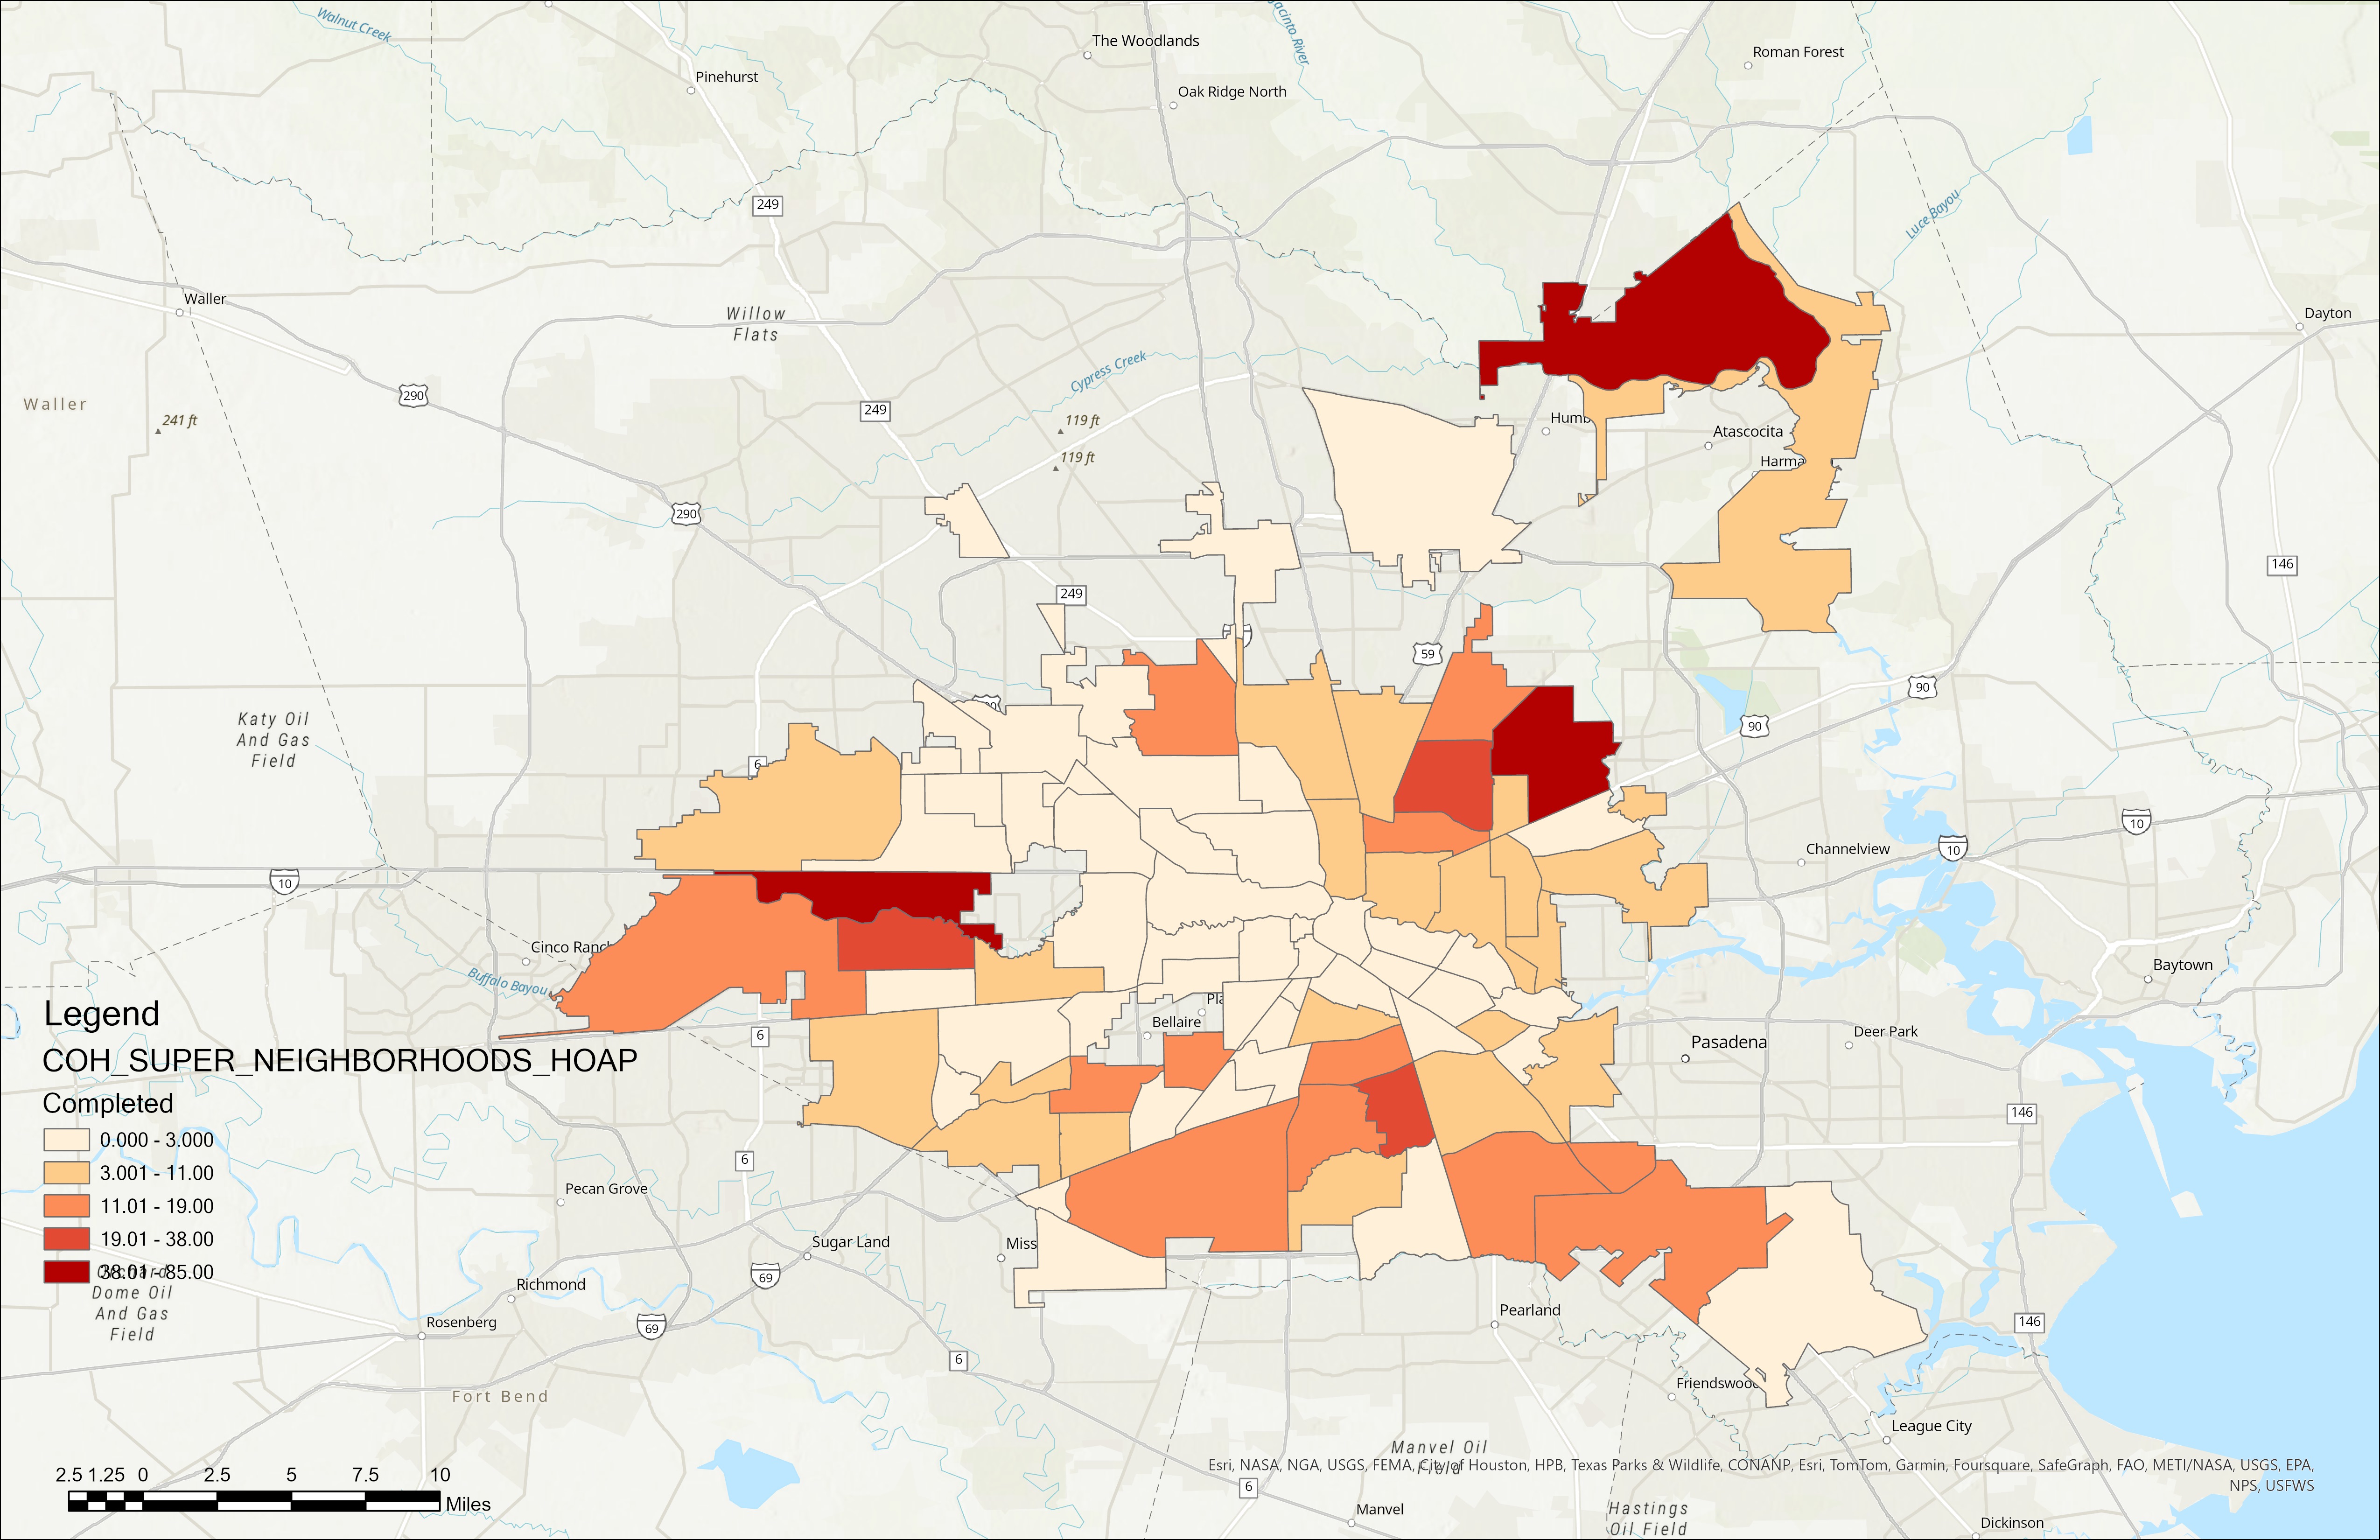
According to our analysis, there is considerable variation in the number of completed HoAP projects across the super neighborhoods. In Figure 5, the darker red color represents a higher completion rate. Notably, the Kingwood, East Houston, and Memorial super neighborhoods have recorded the highest number of completed projects among all regions in Houston, as indicated in Figure 5.
Figure 5. Number of Projects Completed as of March 2024 by the City of Houston’s Homeowner Assistance Program, by Super Neighborhood
Meanwhile, the western and northern areas of Houston have demonstrated the highest rate of completion, which measures how many homes have been completed out of the pool of announced projects. Figure 6 shows the completion rates across the super neighborhoods. On the map, the darker red indicates areas with higher completion rates. The spatial distribution reveals a relatively lower rate of project completion in the southern neighborhoods of Houston, areas that are notably vulnerable due to higher minority populations, poverty levels, and infrastructural deficits.
Figure 6. Rate of Projects Completed by the City of Houston Homeowner Assistance Program, by Super Neighborhood, as of March 2024
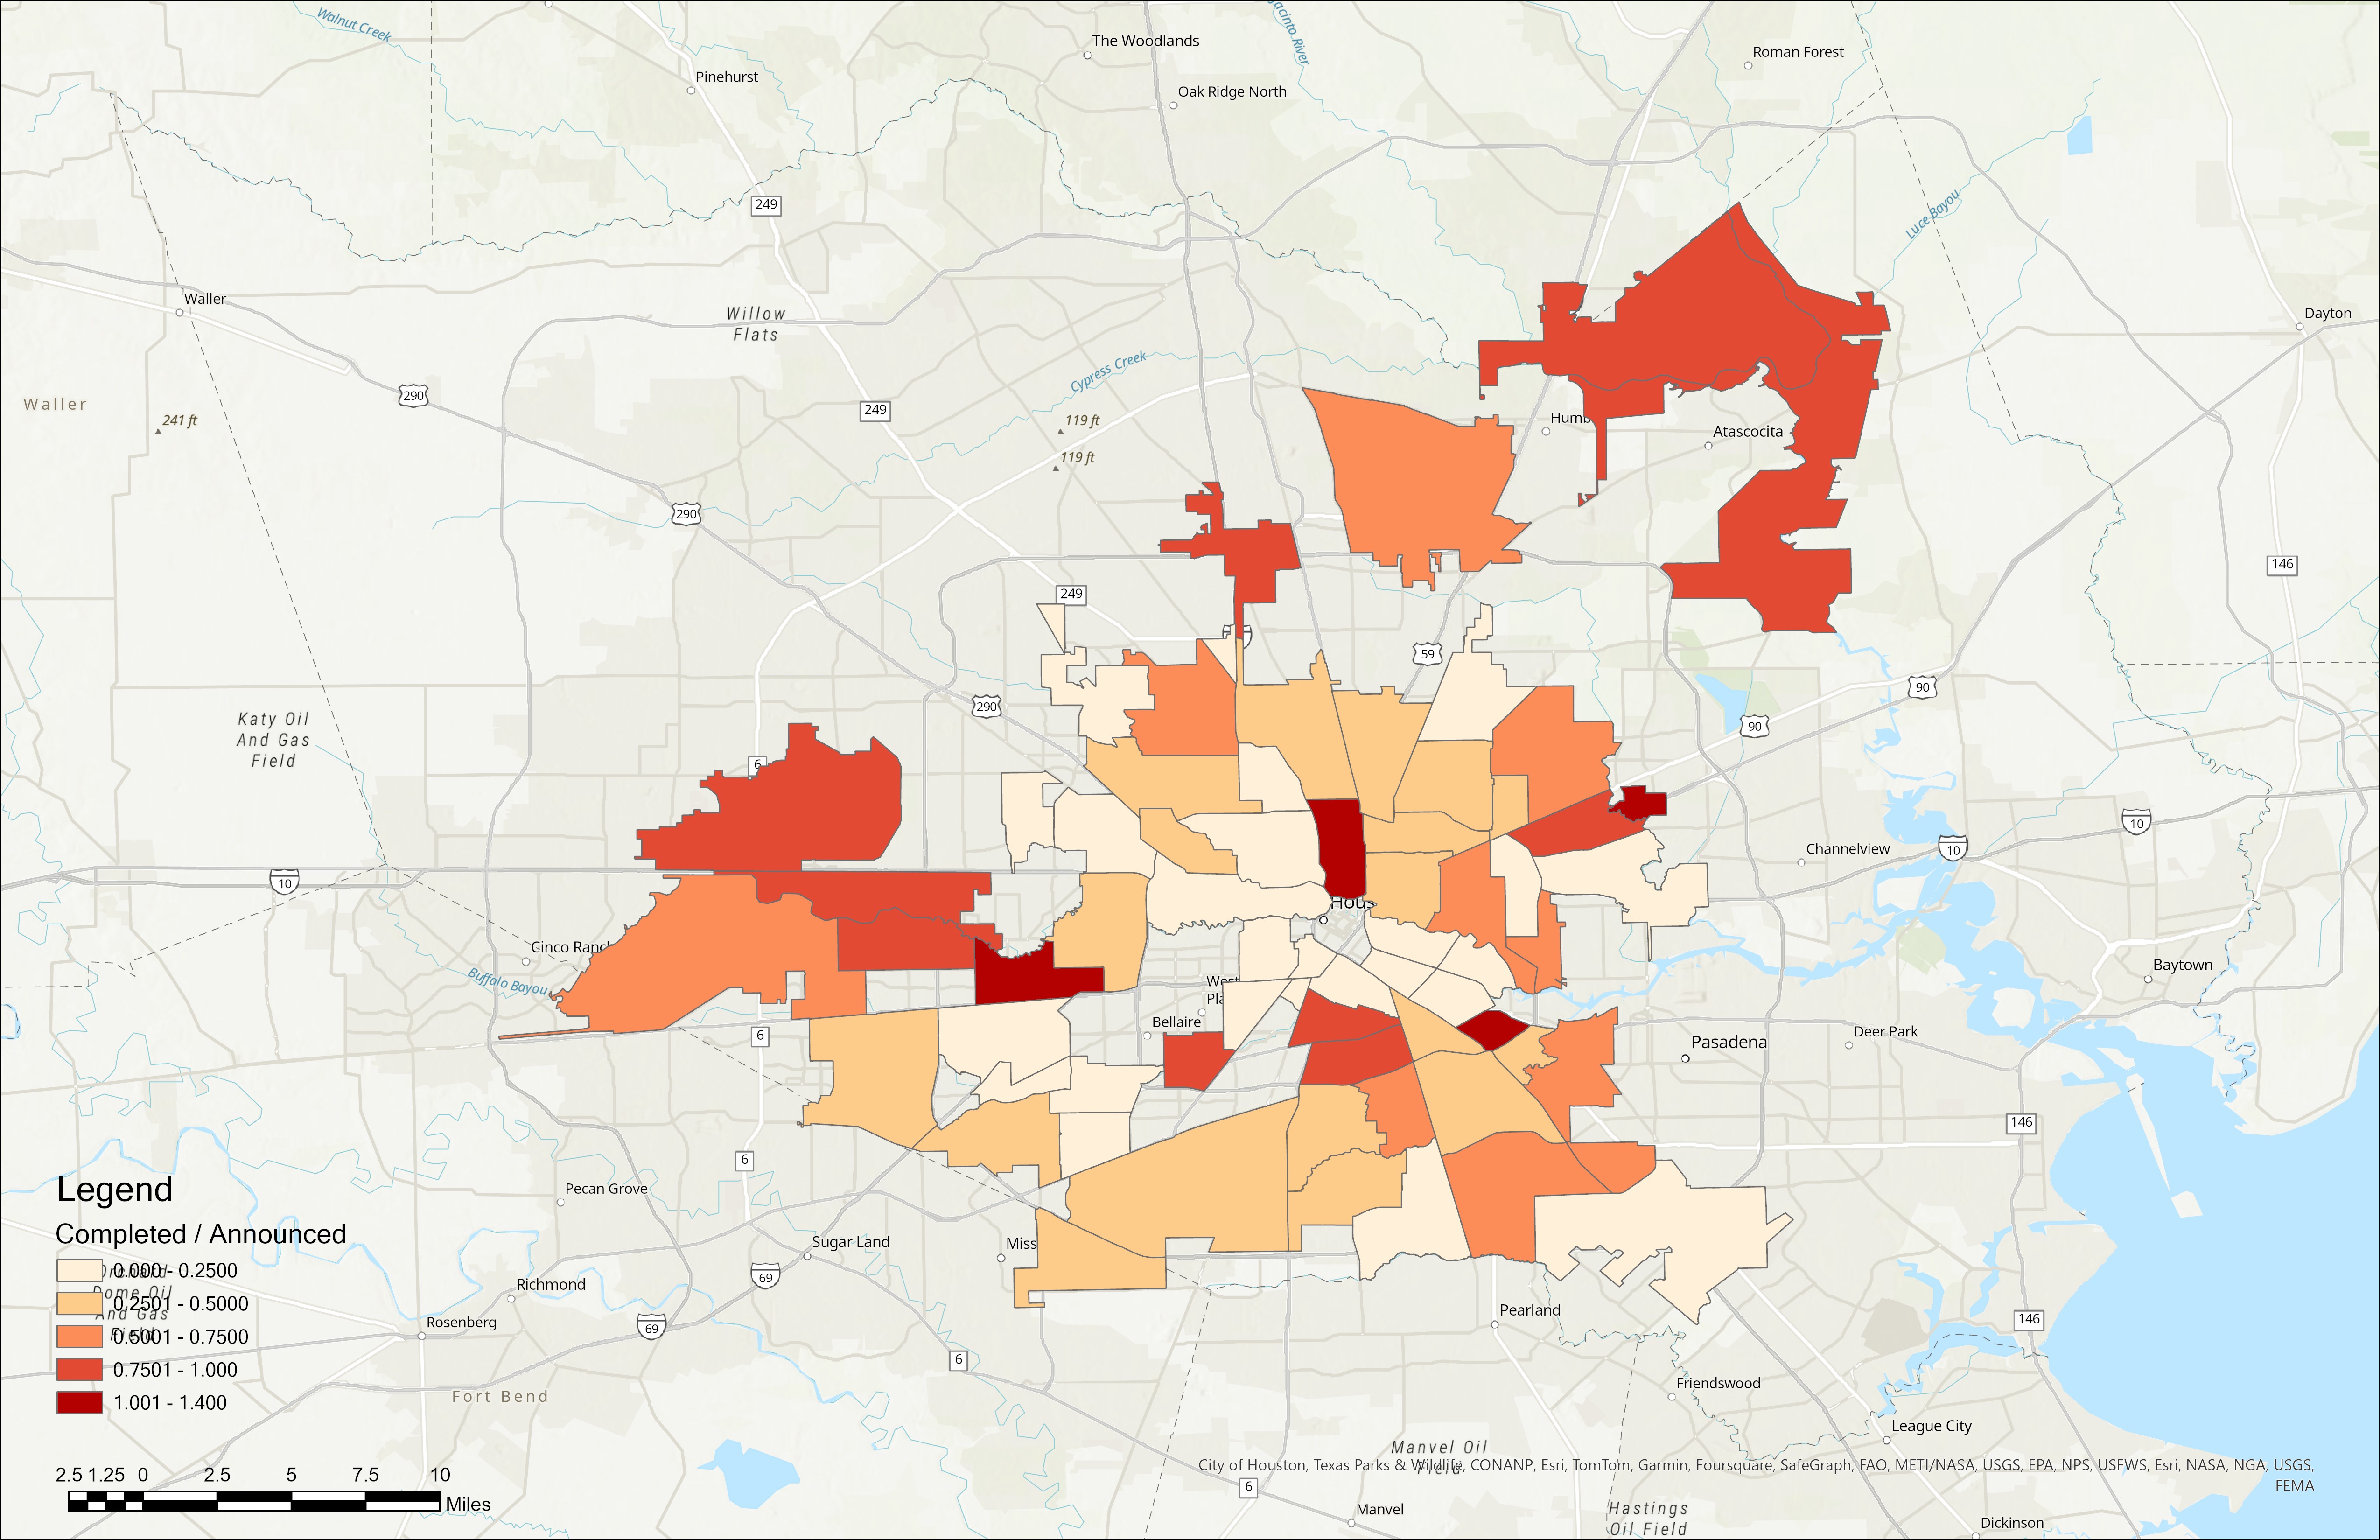
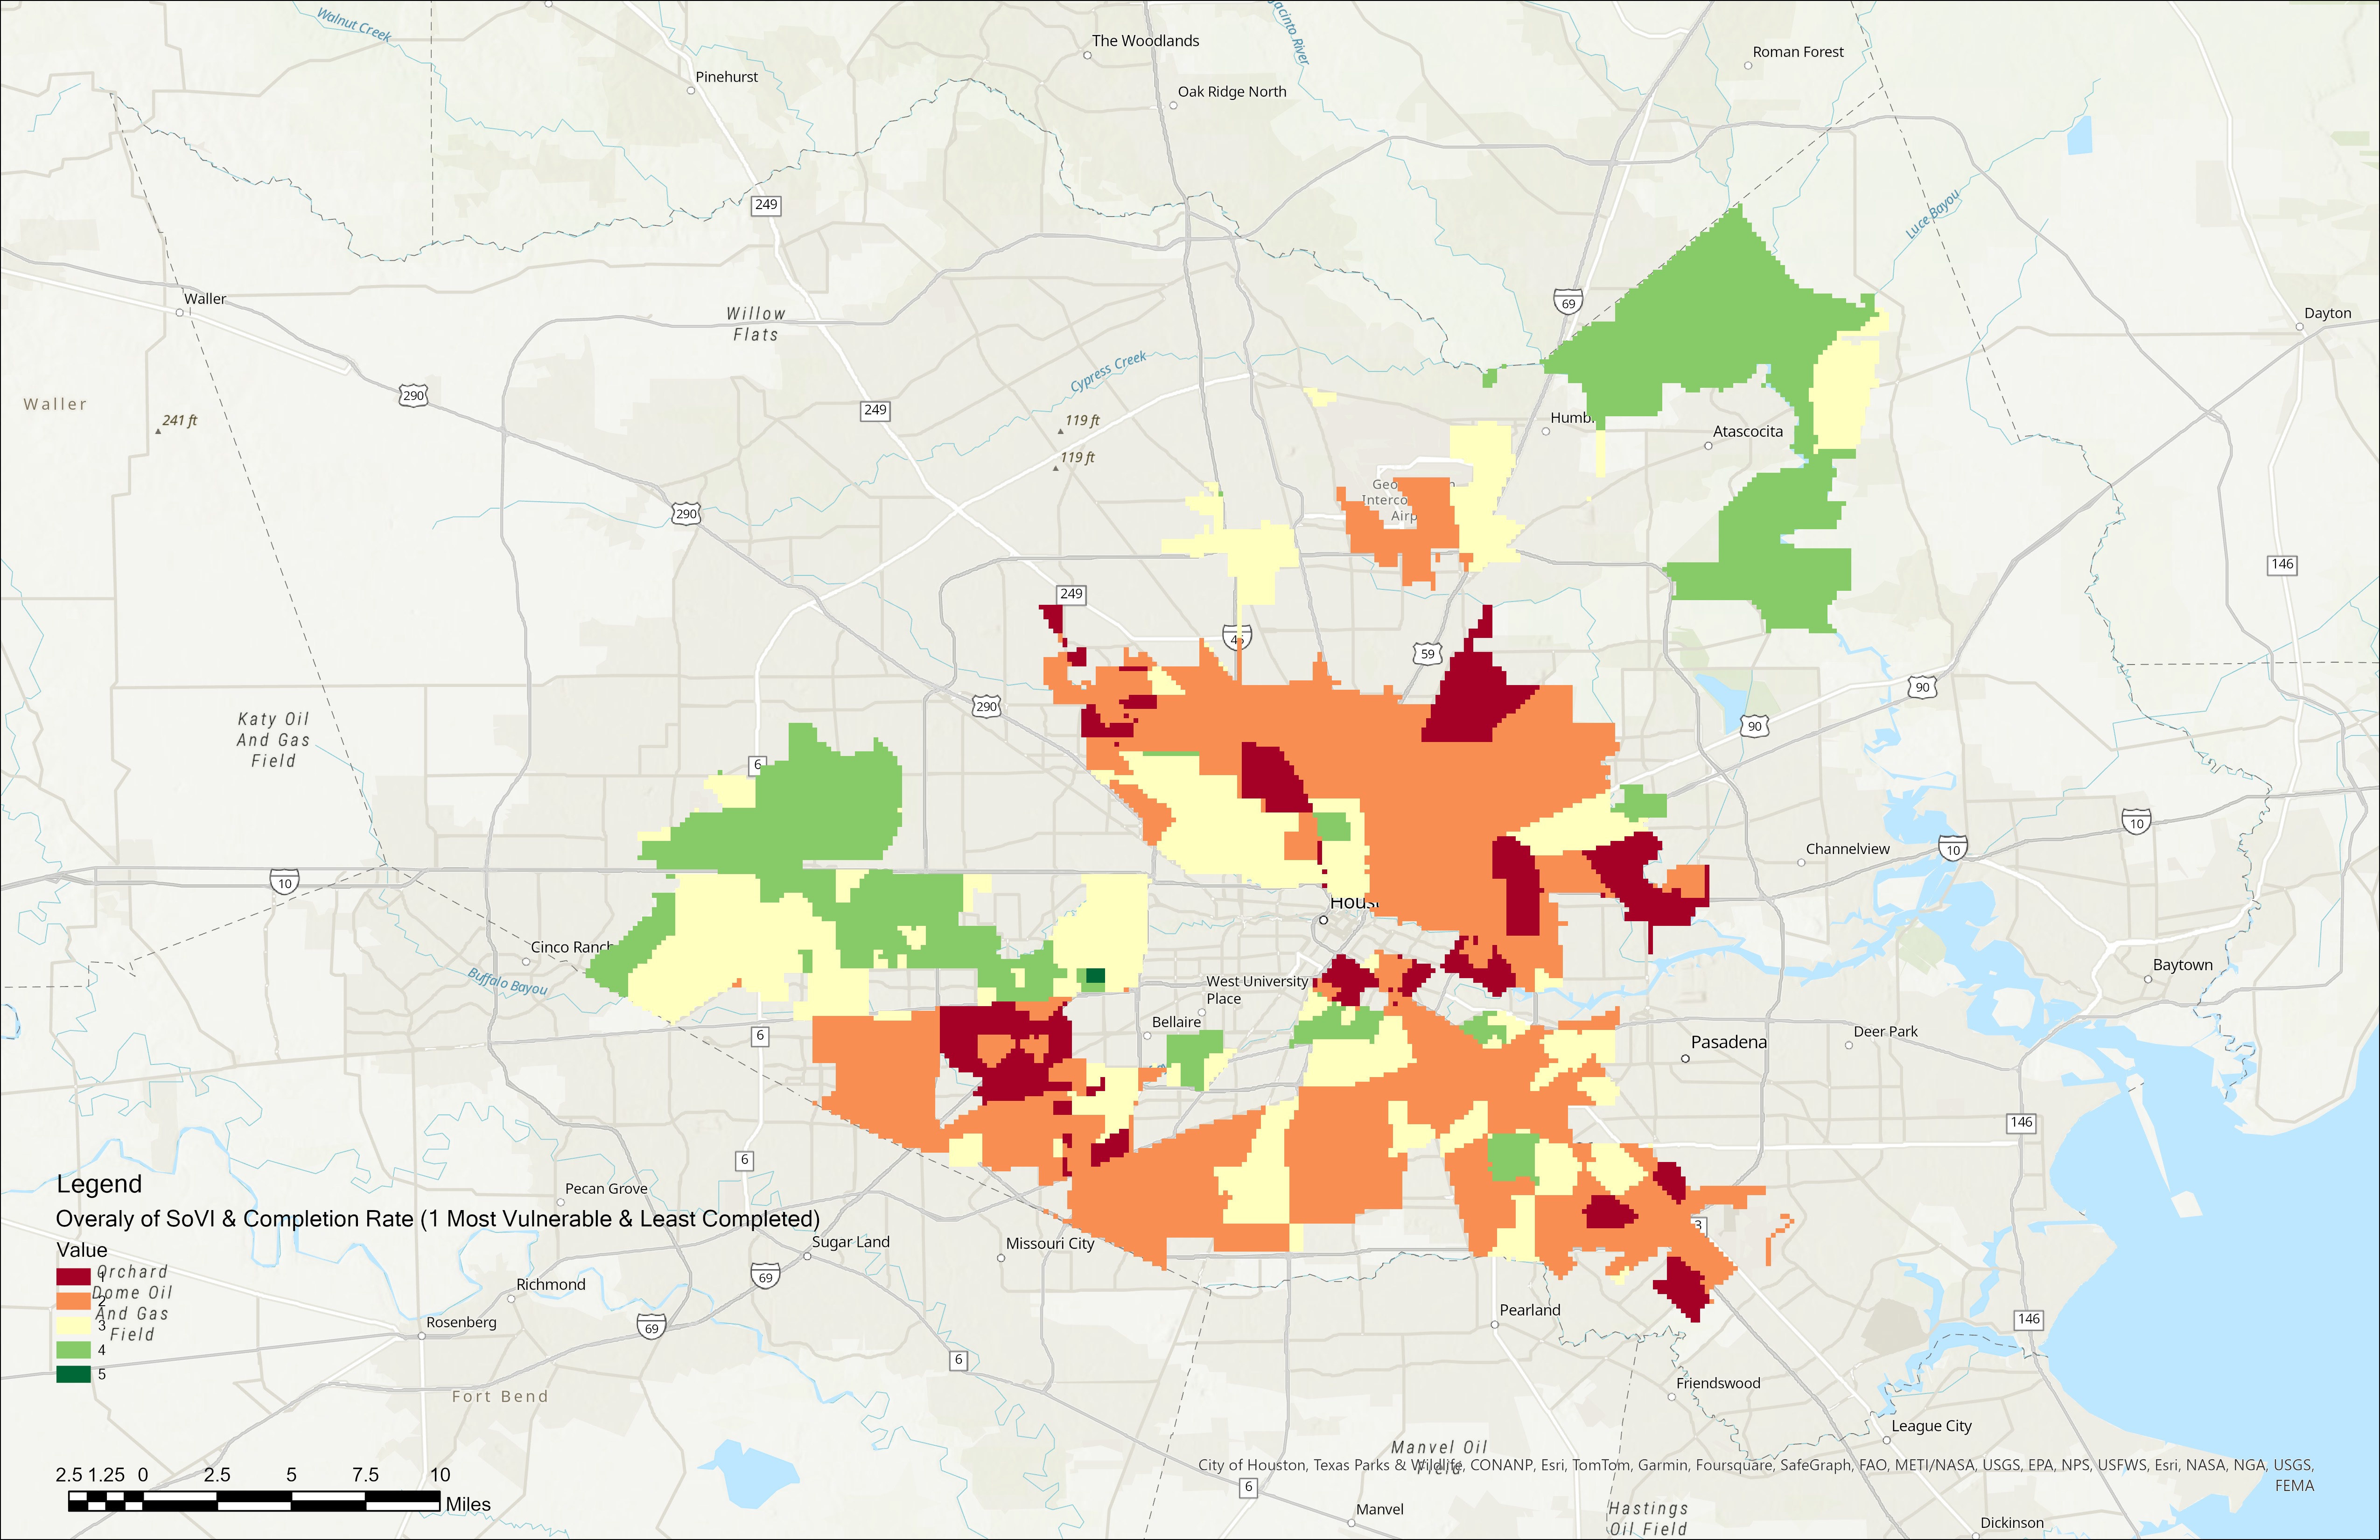
Figure 7 integrates the overall social vulnerability map with the project completion rates, using ArcGIS Pro (version 3.3.0) to overlay the completion ratio and overall vulnerability and pinpoint communities that exhibit high social vulnerability but have received minimal support from HoAP. The red color represents super neighborhoods with high social vulnerability that have nonetheless received minimal support from HoAP. The green color indicates super neighborhoods with lower social vulnerability levels and higher project completion rates. In the map in Figure 7, the scale from 1 to 5 represents the gradient from low vulnerability and high completion rates (5) to high vulnerability and low completion rates (1). Lower numbers indicate communities with greater social vulnerability and lower completion rates, highlighting areas that are most in need of support but currently receiving insufficient assistance.
Figure 7. Weighted Overlay of Super Neighborhood’s Total Social Vulnerability and Rate of Completed Projects by the City of Houston’s Home Assistance Program, as of March 2024
Surveys
Elevation
Initially, our research team initially expected that homes would only be elevated using the pier and beam construction method, which involves raising homes on stilts or pilings. This is a common method in homebuilding used to protect structures against flooding. While conducting fieldwork, however, we discovered that some residents identified two additional ways to elevate homes. Figure 8 displays the three categories of home elevation and one category of non-elevation named by residents in our sample. In the upper left corner of the figure (8a), is a photo of a non-elevated slab home constructed directly on a concrete foundation at ground level. In the upper right corner (8b) is a home elevated with standard pier and beam construction. The bottom two images (8c and 8d) depict slab homes that residents considered elevated due to modifications made by construction companies. The HoAP program did not consider the homes in 8c and 8d to be elevated, but the owner did consider them to be, because they were higher than their previous homes. The bottom left photo (8c) is a slab home elevated by about 4-6 inches. The bottom right photo (8d) shows the elevation involved in raising the home by adding layers of dirt or fill material beneath the existing slab foundation, effectively increasing the home's elevation above the floodplain. The team's observations in the field provided valuable insights into the diverse methods used to elevate homes and protect against flooding. This understanding underscores the importance of considering a variety of elevation techniques in planning and policymaking to support flood resilience in vulnerable communities.
Figure 8. How Residents Categorized Types of Non-Elevated and Elevated Homes
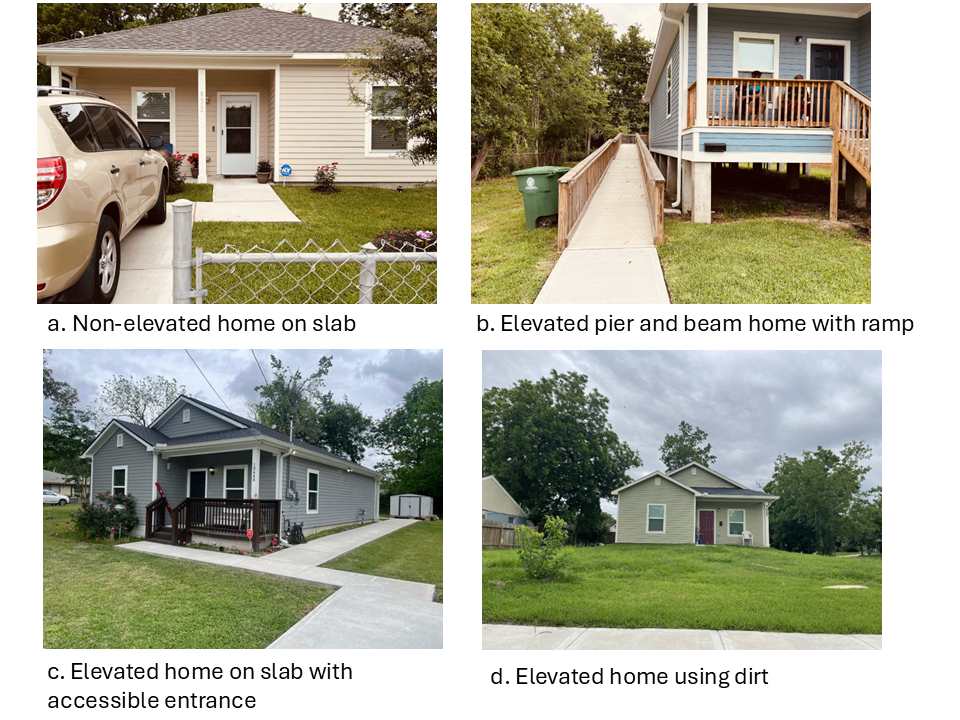
Table 2 provides an overview of key variables related to home elevation among survey respondents. The majority of homeowners submitted their applications between 2019 and 2021. Of the 37 homes that were elevated, 19 were located in flood zones.
Table 2. Survey Responses About Home Elevation and Flooding Frequency
| Application Year | 2017 2018 2019 2020 2021 2022 2023 Not Provided |
8 17 5 8 4 3 3 |
16 34 10 16 8 6 6 |
| Elevation Decision | Yes (Elevated Home) No (Declined Home Elevation) |
13 |
26 |
| Location of Elevated Homesa | In Flood Zone Not in Flood Zone |
26 |
70 |
| Location of Non-Elevated Homesb | In Flood Zone Not in Flood Zone |
12 |
92 |
| Homeowner Knowledge of Home's Location | Certain in Flood Zone Certain were not in Flood Zone Unsure if in Flood Zone Not Provided |
9 20 1 |
18 40 2 |
| Flooding Frequency Group | Frequent Flooding Group Harvey Flooding Group Other Flooding Group Never Flooded Group Not Provided |
29 5 5 2 |
58 10 10 4 |
Additionally, we identified three groups of homeowners in our sample: (a) the “Frequent Flooding Group” who reported experiencing Harvey and other raining events, (b) the “Harvey Flooding Group” who reported experiencing only Harvey as a flooding event, and (c) the “Other Flooding Group” who reported experiencing flooding with other rain events. Table 3 shows the average home elevation height among homeowners was 35 inches. Homeowners in the frequent flooding group raised their homes higher on average (44.2 inches) compared to those affected by Hurricane Harvey (31.7 inches) and other flood events (26.4 inches). This suggests that homeowners who experience frequent flooding are more likely to prefer higher elevations as a mitigation strategy.
Table 3. Average Home Elevation Height by Flooding Frequency Group
| All Groups | ||
| Frequent Flooding Group | ||
| Harvey Flooding Group | ||
| Other Flooding Group |
Relationship Between Respondent Demographic Characteristics and Home Elevation Choices
Our analysis revealed that age was significantly related to the decision to elevate homes. A higher percentage of respondents aged 60 to 79 (approximately 70.27%) elevated their homes compared to other age groups. In contrast, only one respondent under age 40 reported elevating their homes, while around 5.41% of respondents aged 40 to 59 reported elevating their homes and those over 80 had done so by 18.92%. A chi-square test confirms a statistically significant association between age group and home elevation decisions.
Additionally, the chi-square test results showed a statistically significant relationship between disability status and home elevation. Individuals who said neither they nor any of their household members had a disability were more likely to elevate their homes, with 96% having done so, compared to 68% of respondents who said they or at least one household member had a disability. Because this is a small sample, this result is not generalizable to the population. We recommend that future research explore this question with a larger sample.
No other statistically significant relationships were found between home elevation and other factors, such as education level or income. While there was a slight difference in the average number of years respondents had lived in their neighborhoods—38.41 years for those with elevated homes versus 39.08 years for those without—this difference is not statistically significant.
Interviews
Availability of Government Assistance
Discussing the motivation provided by government assistance programs, an elevation specialist noted at the field trip presentation, “There is financial assistance available. It’s not an inexpensive thing to do. Some people do not have the means to do it out of pocket...but there are funds available to assist homeowners in paying for this.” The specialist described the financial assistance landscape:
There are funds available to assist homeowners in paying for this, and a lot of the time financial assistance will cover 100% of the cost. Sometimes homeowners have a cost share, but a lot of the time it can be 100% cost for them.
These quotes reflect the essential role of financial support from government programs in making elevation accessible to a broader segment of the community, particularly those that have experienced a major disaster and were directly affected by it.
Perceptions of the Effectiveness of Elevation
Some community members were skeptical about the effectiveness of elevation in not only preventing flood damage but also creating a sturdy home that would require little maintenance. This lack of trust can stem from a variety of sources, including past experiences, anecdotal evidence, or a lack of visible proof within the community that elevation significantly mitigates flood damage. A homeowner skeptical about the structural integrity of elevated homes shared, “I’ve seen a couple of elevated homes around here that still experienced issues during floods. It makes you wonder how effective this is.” Some participants expressed concerns that the homes were “flaky” and would not last as long as expected. A few specifically worried that during floods, the ground beneath the elevated homes might become wet and unstable. In these cases, the water could pool or be absorbed into the soil, making the foundation less secure over time. These concerns highlight the risk of long-term degradation of the home due to weakened ground stability. Additionally, others raised issues about the potential future costs of maintenance, such as replacing damaged structural elements, like the sails or supports, and whether they would have the necessary funds to make those repairs.
However, contrasting these doubts, a professional involved in elevation processes provided a counterpoint: “Once it gets their house off the ground, they’re not susceptible to flooding anymore. It brings peace of mind.” This professional perspective highlights the benefits of elevation in clear, practical terms, potentially countering residents’ skepticism by outlining the direct outcomes of such projects. Indeed, some residents seemed amenable to changing their views.
Discussing long-term expectations, interviewed homeowners expressed concerns about future flood risks: “With the climate changing and all these weather patterns shifting, I’m not sure what will happen in the next few years. It makes you think if elevation might be a necessity.” This suggests a growing awareness and reconsideration of elevation as a potentially effective response to increasing flood risks due to climate change. Reflecting on past experiences with flooding, another resident mentioned, “Every time it rains hard, I just brace myself because this area is known for flooding. That’s why I considered elevation now.” This quote shows the impact of recurring flood events on changing a resident’s perception of the effectiveness of elevation in mitigating flood risks.
Community Influence and Aesthetic Preferences
Community aesthetics and the desire to maintain neighborhood character can influence homeowners’ decisions if they live in older neighborhoods characterized by brick homes. This stands in contrast to neighborhoods where there is a lot of vacancy and abandonment, many times caused by Hurricane Harvey. Some of the neighborhoods that we visited were characterized by the presence of debris and homes in disrepair.
Some interviewed participants did not like the look of elevated homes. For instance, an interviewed participant stated, “I don’t want my house to stick out like a sore thumb in this neighborhood.” This reflects the deep-seated desire to maintain aesthetic continuity in one’s environment, highlighting how community norms and values can strongly influence individual decisions regarding home modifications.
During a discussion on community aesthetics, another resident remarked, “Most of us moved here because of the character of the houses.” This quote underscores the significance of neighborhood character in shaping residents’ preferences towards maintaining traditional architectural styles, even when considering necessary upgrades like elevation. Similarly, expressing concerns about the impact of elevation on the neighborhood’s appearance, a homeowner mentioned, “I worry that too many elevated homes might change the look.” This sentiment illustrates how aesthetic considerations are not just personal but are shared among community members, influencing collective preferences and decisions regarding structural changes.
An elevation expert also noted the importance of fitting new constructions into existing neighborhood patterns: “We have to make sure that everything we do, especially if it’s visible, fits in with the character of the neighborhood.” This professional insight aligns with residents’ preferences, highlighting a broader community-based approach to maintaining aesthetic integrity while implementing necessary modifications.
Practical and Physical Considerations
Practical considerations, especially regarding accessibility and mobility, are pivotal to decisions regarding home elevation. Discussing the practical aspects of living in an elevated home, one participant remarked, “It’s not just about flood protection; it’s about how we live day-to-day. My concern is accessing my home easily every day without strain.” This quote captures the daily practical concerns associated with elevated homes, particularly the need for easy accessibility. Another homeowner shared concerns about emergency responses like fire or a medical or personal emergency, stating, “What worries me is how quickly we can get out in an emergency with these elevated setups. It’s something we have to think about seriously.” This quote points to additional practical considerations regarding safety and emergency access in elevated homes, which can be a significant concern for residents evaluating such modifications.
Some interview participants elaborated on survey findings indicating a preference to avoid physical strain. This preference highlights the daily challenges that elevated homes can pose, especially for individuals with limited mobility or those who anticipate such issues in the future. A resident emphasized the physical challenges of front porch elevation, stating “Getting up and down the new stairs can be daunting, especially for older folks like us who’ve lived here all our lives.” This quote highlights the practical difficulties that elevated homes can pose for less mobile residents.
Interviews revealed that many respondents felt that ramps on elevated homes are useful either now or in the future. This reflects a general acknowledgment of the need for accessible home modifications to accommodate current or potential mobility limitations. Several residents expressed appreciation for the functionality of the ramps. As one stated, “These ramps have made a difference for my mobility. Without them, I couldn’t imagine accessing my home comfortably.” This comment highlights the practical benefits of ramps, particularly for individuals with mobility challenges. Another participant with no mobility issues who wanted to sell his home in the future noted, “The ramps are not just a convenience; they are a necessity for many of our neighbors who would otherwise struggle with stairs.” Another homeowner explained the utility of ramps, saying, “The ramp to our elevated home has made a huge difference. It’s much safer and easier, especially for my elderly parents who visit often.” Discussing the community response to ramps, another resident mentioned, “Everyone here appreciates the ramps. They make our homes accessible to everyone, regardless of their ability to climb stairs.”
Some homeowners, particularly older adults, found ramps inconvenient due to their length and placement far from driveways. Despite the presence of ramps, which are intended to improve accessibility, the physical strain associated with these designs can deter people from using them. Regarding ramps, participants familiar with them said that they preferred concrete ramps that were elevated a few inches to those elevated more than one foot. They also preferred concrete ramps over wood ramps. To address these concerns, it is essential to conduct more research on the design of ramps, ensuring ramps are not only compliant with accessibility standards but also practical, convenient for the intended users, and aesthetically pleasing.
Conclusions
Implications for Policy and Practice
Our research provides insights into the impacts of vulnerability, housing support programs, and home elevation practices in flood-prone areas of Houston. Our analysis supports research showing that Houston communities with high percentages of minority and immigrant residents and neighborhoods with economical disadvantages are particularly vulnerable to disasters. This underscores the significance of targeted interventions in these communities for disaster management and recovery efforts. In particular, the CDC’s Social Vulnerability Index confirms that Houston neighborhoods with minority populations and lower economic status are more prone to flooding. Our study also showed that there were discrepancies in how home repair assistance distributed across Houston, with certain neighborhoods, including Kingwood, East Houston, and Memorial, showing higher rates of project completion compared to more vulnerable southern neighborhoods. This highlights the necessity for improved resource distribution to assist communities most at risk.
Our survey of 50 residents, who were primarily women and African American, revealed a variety of approaches to home elevation. Contrary to expectations, homes other than pier and beam foundations were considered elevated. These results emphasize the importance of policies accommodating other home elevation techniques. A significant number of homes are in flood zones, indicating that home elevation serves as a common and effective measure for mitigating flood risks. In our results, those respondents aged 60 to 79 years tended to raise their homes more frequently, while respondents with disabilities were less likely to consider elevation. These dynamics need to be further explored in research with a larger sample. Participants generally viewed ramps in raised homes positively, emphasizing the importance of incorporating accessibility features in elevation projects. However, some respondents expressed concerns about the aesthetics and space that ramps take up or felt that they were unnecessary for individuals without mobility issues. This highlights the need for more flexible design options that can accommodate different preferences and needs while still ensuring accessibility for those who require it.
Future Research Directions
In the wake of disasters and the growing risk of floods, it is crucial to understand why some individuals opt against having their new homes elevated. This decision holds significance for the safety and resilience of communities as well as for the effectiveness of government initiatives aimed at mitigating flood risks. By examining the preferences of participants in Houston’s post-Harvey home repair programs, we have begun the process of understanding the factors that influence their choices.
We plan to disseminate our findings through several channels. We will share the results with participants, Harvey Forgotten Survivors Caucus members, and Texas Housers. This will involve a focus group in the fall of 2024 to gather feedback. We will engage stakeholders in government agencies, such as the GLO, the City of Houston, and local government representatives, by providing them with various materials (this report and a presentation). Texas Housers will utilize its blog, podcast (A Little Louder), and other social media outlets to disseminate the information widely. Our dissemination efforts will also include presenting at various conferences, such as those organized by the Association of Collegiate Schools of Planning and the American Planning Association, among others.
Limitations
This study has limitations to consider. First, the 50 households surveyed are not fully representative of the population impacted by flooding in Houston. Second, relying on self-reported information from surveys and interviews could introduce bias since participants’ memories and viewpoints may vary. Moreover, the focus of the study is on individuals involved in HoAP or HAP and thus may be missing important insights from those who did not take part in these programs. This is particularly relevant when considering trends in shifting socioeconomic factors, as individuals’ perceptions of their financial stability, neighborhood conditions, or access to resources may change over time, potentially influencing their responses. Lastly, the evolving environmental and socioeconomic landscape in Houston makes it challenging to apply these findings over time.
In future research, it would be beneficial to include a more varied sample to improve the applicability of findings. Studying changes in home elevation choices and flood preparedness over time could provide insights into the effectiveness of various prevention methods. Delving into how socioeconomic factors and community involvement influence decision-making processes could yield insights for policymakers. Moreover, examining how climate change affects flood risks and mitigation efforts could lead to the creation of more robust and adaptable resilience plans.
References
-
Shao, W. (2018, August 23). A year after Hurricane Harvey, some Texans are using outdated flood risk maps to rebuild. The Conversation. https://theconversation.com/a-year-after-hurricane-harvey-some-texans-are-using-outdated-flood-risk-maps-to-rebuild-99178 ↩
-
Harris County Flood Control District. (n.d.) 2018 Bond Program. Retrieved March 28, 2025, from https://www.hcfcd.org/2018-bond-program ↩
-
Pytel, B. (2022, August 16). 5 lessons from Houston and Harris County 5 years after Harvey. American Flood Coalition. https://floodcoalition.org/5-lessons-houston-and-harris-county-after-hurricane-harvey/ ↩
-
Texas General Land Office. (n.d.). Homeowner assistance program. Retrieved March 5, 2024, from https://www.glo.texas.gov/disaster-recovery/hurricane-harvey/homeowner-assistance ↩
-
Peacock, W. G., Van Zandt, S., Zhang, Y., & Highfield, W. E. (2014). Inequities in long-term housing recovery after disasters. Journal of the American Planning Association, 80(4), 356-371. ↩
-
Lu, Y. (2017). Hurricane flooding and environmental inequality: Do disadvantaged neighborhoods have lower elevations? Socius, 3. https://doi.org/10.1177/2378023117740700 ↩
-
Zahran, S., Brody, S. D., Peacock, W. G., Vedlitz, A., & Grover, H. (2008). Social vulnerability and the natural and built environment: A model of flood casualties in Texas. Disasters, 32(4), 537–560. https://doi.org/10.1111/j.1467-7717.2008.01054.x ↩
-
Botzen, W. J. W., Aerts, J. C. J. H., & van den Bergh, J. C. J. M. (2013). Individual preferences for reducing flood risk to near zero through elevation. Mitigation and Adaptation Strategies for Global Change, 18(2), 229–244. https://doi.org/10.1007/s11027-012-9359-5 ↩
-
Grothmann, T., & Reusswig, F. (2006). People at risk of flooding: Why some residents take precautionary action while others do not. Natural Hazards, 38(1), 101-120. https://doi.org/10.1007/s11069-005-8604-6 ↩
-
Kellens, W., Terpstra, T., & De Maeyer, P. (2013). Perception and communication of flood risks: A systematic review of empirical research. Risk Analysis, 33(1), 24-49. https://doi.org/10.1111/j.1539-6924.2012.01844.x ↩
-
Poussin, J. K., Botzen, W. J. W., & Aerts, J. C. J. H. (2014). Factors of influence on flood damage mitigation behaviour by households. Environmental Science & Policy, 40, 69–77. https://doi.org/10.1016/j.envsci.2014.01.013 ↩
-
Danh, V. T., & Mushtaq, S. (2011). Living with floods: An evaluation of the resettlement program of the Mekong Delta of Vietnam. In M. A. Stewart & P. A. Coclanis (Eds.), Environmental change and agricultural sustainability in the Mekong Delta (pp. 181-204). Springer Netherlands. https://doi.org/10.1007/978-94-007-0934-8_11 ↩
-
Al Assi, A., Mostafiz, R. B., Friedland, C. J., Rohli, R. V., & Rahim, M. A. (2023). Homeowner flood risk and risk reduction from home elevation between the limits of the 100- and 500-year floodplains. Frontiers in Earth Science, 11. https://www.frontiersin.org/articles/10.3389/feart.2023.1051546 ↩
-
Mobley, W., Atoba, K. O., & Highfield, W. E. (2020). Uncertainty in flood mitigation practices: Assessing the economic benefits of property acquisition and elevation in flood-prone communities. Sustainability, 12(5), Article 5. https://doi.org/10.3390/su12052098 ↩
-
Cohen, S., Brakenridge, G. R., Kettner, A., Bates, B., Nelson, J., McDonald, R., Huang, Y., Munasinghe, D., & Zhang, J. (2018). Estimating floodwater depths from flood inundation maps and topography. Journal of the American Water Resources Association, 54(4), 847-858. ↩
-
Zhang, W., Villarini, G., Vecchi, G. A., & Smith, J. A. (2018). Urbanization exacerbated the rainfall and flooding caused by hurricane Harvey in Houston. Nature, 563(7731), 384-388. ↩
-
Texas Division of Emergency Management. (n.d.). Hurricane Harvey DR 4332. Retrieved October 15, 2024, from https://www.tdem.texas.gov/disasters/hurricane-harvey ↩
-
National Hurricane Center. (2018, January 26). Costliest U.S. tropical cyclones tables updated. https://www.nhc.noaa.gov/news/UpdatedCostliest.pdf ↩
-
Malecha, M. L., Woodruff, S. C., & Berke, P. R. (2021). Planning to exacerbate flooding: Evaluating a Houston, Texas, network of plans in place during Hurricane Harvey using a plan integration for resilience scorecard. Natural Hazards Review, 22(4).
https://doi.org/10.1061/(ASCE)NH.1527-6996.0000470 ↩ -
Smiley, K. T. (2020). Social inequalities in flooding inside and outside of floodplains during Hurricane Harvey. Environmental Research Letters, 15(9), 0940b3. ↩
-
Federal Emergency Management Agency. (n.d.). Flood Data Viewers and Geospatial Data: The National Flood Hazard Layer (NFHL) [Data set]. Retrieved October 1, 2024, from https://www.fema.gov/flood-maps/national-flood-hazard-layer ↩
-
Texas Natural Resources Information System and Texas Geographic Information Office. (2023). Texas Basemap—Lidar Elevation Data (DEM) [Data set]. Hydroshare. https://www.hydroshare.org/resource/af6ae321e2ad40a1bc6d0b695370fbfc/ ↩
-
Centers for Disease Control and Prevention. (2020). CDC/ATSDR Social Vulnerability Index [Data set for Harris County, TX]. Agency for Toxic Substances and Disease Registry; Geospatial Research, Analysis, and Services Program. Retrieved October 1, 2024, from https://www.atsdr.cdc.gov/placeandhealth/svi/data_documentation_download.html ↩
-
City of Houston. (n.d.-a). Disaster recovery 2017 (DR17) hub [Database]. Retrieved October 1, 2024, from https://recovery.houstontx.gov/dr17/index.html ↩
-
Flanagan, B.E., Gregory, E.W., Hallisey, E.J., Heitgerd, J.L., & Lewis, B. (2011). A Social Vulnerability Index for Disaster Management. Journal of Homeland Security and Emergency Management, 8(1). ↩
-
Ramesh, B., Jagger, M. A., Zaitchik, B., Kolivras, K. N., Swarup, S., Deanes, L., & Gohlke, J. M. (2022). Flooding and emergency department visits: Effect modification by the CDC/ATSDR Social Vulnerability Index. International Journal of Disaster Risk Reduction, 76, 102986. ↩
-
City of Houston. (n.d.-b). Super Neighborhoods. Retrieved October 1, 2024, from https://www.houstontx.gov/superneighborhoods/index.html ↩
Garcia, I., Tao, Z., Orduña, J., Martínez-Román, L., & Welideniya, W. (2025). Mitigating Homeowner Flood Risk After Harvey: An Assessment of Houston’s Home Repair and Elevation Programs. (Natural Hazards Center Mitigation Matters Research Report Series, Report 25). Natural Hazards Center, University of Colorado Boulder. https://hazards.colorado.edu/mitigation-matters-report/mitigating-homeowner-flood-risk-after-harvey