Public Health Computer Simulation Tool to Support Disaster Preparedness in Rural Communities
Publication Date: 2023
Abstract
When natural hazards occur in rural communities, where resources are often scarce, local public health agencies, hospitals, healthcare providers, and emergency responders are quickly overwhelmed. Mitigating the adverse impacts of natural hazards in under-resourced rural communities requires effective planning that takes into consideration their unique characteristics and needs. Model-based systems engineering (MBSE) methods can assist decision makers by considering disasters from a systems perspective and examining how the system behaves under different scenarios. MSBE is particularly well-suited for exploring how different approaches to preparedness and levels of resources (e.g., amount of stockpiles, emergency responders, and community volunteers) affect outcomes. The purpose of our research was to develop a computer simulation tool that provides rural communities with an in-depth understanding of how rural disaster preparedness systems interact and improves response capabilities of their healthcare systems to natural hazard events. We defined an effective and efficient public health emergency response as one that is well-coordinated, timely, and minimizes losses. We then explored the independent, system-dependent, and critical factors that help produce successful responses in rural communities. We incorporated stakeholder engagement workshops in two case study sites in Nebraska and Tennessee where flood events had recently occurred with MBSE computer simulation methods, including system dynamics and agent-based modeling. We aimed to design a computer simulation model that accurately tracks key public health response outputs such as the number of individuals in need of rescue or medical care, patient wait times, surge, and resource management. Our results demonstrate that a hybrid model approach is an appropriate tool to achieve this objective.
Introduction
Natural hazards have serious and complicated impacts on human systems, including healthcare and public health systems. Effective planning and preparedness can improve disaster response, recovery, and related outcomes. Despite the importance of disaster preparedness, rural communities may be unable to plan for such events due to limited resources or a lack of tools available to help preparedness personnel determine the most effective use of the limited resources. Model-based systems engineering (MBSE) is the application of modeling and simulation to systems (Ramos et al., 20121). MBSE methods have been successfully used to describe system behavior in healthcare (Chaffee & McNeill, 20072), public health (Homer & Hirsch, 20063; Moore et al., 20114), and specific disaster management applications (Coetzee et al., 20165; Kapucu, 20096). Applying MBSE methods to rural disaster preparedness and planning has the potential to provide insight into how best to prepare for natural hazards.
The healthcare system is essential in disaster response and is involved in activities that include search and rescue, triage, patient evacuations, victim tracking, managing medical donations, and communication, among other activities (Auf der Heide & Scanlon, 20077). Rural and remote communities have fewer resources available to meet emergent (and emerging) needs during a natural hazard (Office of Rural Health Policy, 20028). Consequently, these communities may rely more heavily on the local healthcare systems to assist with disaster response (Office of Rural Health Policy, 2002; Schur, 20049). Further, many tools that have been developed for disaster preparedness and planning, including MBSE-based tools, have not been adapted for use in rural communities, and do not consider important differences in rural contexts, such as the lack of resources, staff, and specialty training.
To address this gap in public health disaster preparedness tools, we sought to develop a multi-method computer simulation tool for rural communities. Our approach applies complex systems theory and MBSE methods, focusing on specific tool features and functionality so that model developers and stakeholders are able to assess its potential applications, benefits, and technical challenges. Ultimately, our goal is to develop a simulation tool that rural communities can use to improve the capability of their healthcare systems to respond to an unexpected natural hazard event.
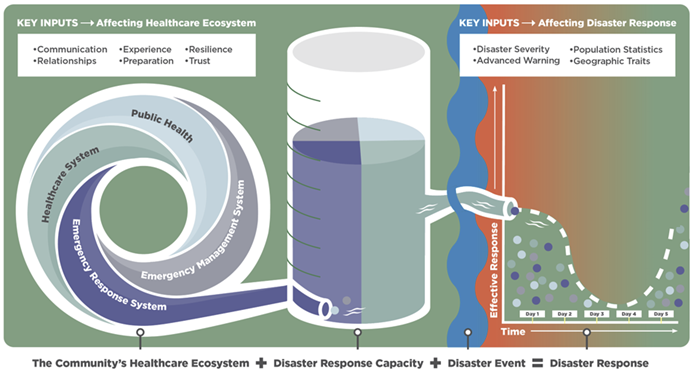
Figure 1 provides an illustration of the integrated model design with the factor and variable inputs. It demonstrates how our research integrates the following: (a) the different components of natural hazard preparedness and response systems including public health, healthcare, emergency response, and emergency management; (b) their important key inputs that affect disaster response capacity in a given community, such as communications, experience, and trust; (c) community characteristics such as population demographics or geographic features, and (d) variables related to the natural hazard itself.
Figure 1. Integrated Rural Healthcare Disaster Preparedness Inputs and Outputs
Literature Review
The State of Rural Public Health Preparedness and Response in the United States
Rural Social Vulnerability to Natural Hazards
Rural communities are often socially vulnerable due to their geographic isolation, limited transportation resources, low socioeconomic status, high prevalence of chronic illness, limited employment, reduced educational opportunities, and inadequate housing (Centers for Disease Control and Prevention, n.d.-a10; Rural Health Information Hub, n.d.-a11; Tate et al., 202112). Understanding how this social vulnerability intersects with the geographic flooding susceptibility in the U.S. South (Tate et al., 2021), may allow emergency planners and healthcare administrators to better mitigate negative flood impacts and improve the recovery following an event (Tate et al., 2021; Wilson et al., 202113).
Rural Socioeconomic Characteristics and Declining Healthcare Access
Rural U.S. residents made up approximately 14% of the nation’s population in 2020, a percentage that has declined over time (Dobis et al., 202114). For example, between 2010 and 2020, the rural population fell by 0.6%, while urban population increased by approximately 8.8%. Poverty has played a significant role in the rural population decline, with persistently poor rural communities (defined as those with 20% or more of their population at or below the federal poverty line for four or more Censuses since 1980) losing around 5.7% of their population over the decade. By comparison, non-persistently poor rural counties had relative population stability (Dobis et al., 2021). Rural population decline is largely driven by greater economic opportunities in urban areas (Marre, 202015). The exodus of people from these and other socially vulnerable rural areas has left them with even fewer resources and less resilience to stressors, such as natural hazards.
Socioeconomic challenges and other sea changes in healthcare conveyance (e.g., increased reliance on outpatient services and the closure of rural hospitals and related services) have left many rural areas struggling to provide adequate healthcare for their residents (Chartis Center for Rural Health, 202016). Meanwhile, rural-urban health disparities continue to grow (Cross et al., 202117). Overall, rural communities have lower life expectancies and suffer greater levels of chronic disease than their urban counterparts (Rural Health Information Hub, n.d.-b18). These disparities can often be traced to declining access to care in rural areas, particularly for Medicaid patients and racial minorities (Gujral & Basu, 201919) and other patients who often experience socioeconomic challenges (U.S. Department of Health & Human Services [DHS], n.d.-a20; Economic Research Service, 2022a21, 2022b22).
Rural Disaster Preparedness Context
Advances in hazard prediction and warning systems, enhanced infrastructure, emergency readiness, and organized responses have contributed to large reductions in disaster-associated loss of life in recent decades (Ritchie et al., 202223). Yet, rural communities have not benefitted from these advances to the same degree as urban areas because of their higher rates of poverty and other social vulnerabilities and fewer resources (Centers for Disease Control and Prevention, n.d.-b24; Jessee, 202025). Furthermore, climate change is fueling an increase in the frequency and severity of natural hazards, putting more individuals and communities at risk (World Meteorological Organization, 202126). The threat that climate change poses in rural areas is heightened even further by a recent policy context which demands that local communities take on a larger percentage of the recovery burden despite often declining resources (Jerolleman, 202027).
Even as increasing numbers of rural hospitals and their emergency departments are closed, those that remain open are still expected to play an essential role in disaster preparedness and response (Auf der Heide, 200628; Centers for Medicare & Medicaid Services, n.d.29). Moreover, because rural healthcare providers often assume emergency response roles, these parts of the rural healthcare system must be ready to respond to complex, rapidly evolving disaster scenarios. Yet, these conditions, which are common in rural healthcare systems, are not included in existing disaster preparedness simulation tools. Rural community leaders, policymakers, and emergency response coordinators need planning tools that can help them prepare for nonlinear complex events to like natural hazards. Without such tools, disaster responses may be disorganized and ineffective (Auf der Heide, 2006).
Model-Based Systems Engineering for Public Health Disaster Preparedness and Response
Complex Systems Theory and Models
The use of complex systems theory, modeling, and computer simulation to describe systems behavior is useful for healthcare, public health, and disaster research and planning (Hoard et al., 200530; Kaplan et al., 201331; Mostafavi & Ganapati, 201932). Simulation is an ideal solution to advance disaster research because it can consider natural hazards from a systems perspective, address uncertainties in model inputs by examining how the system behaves under different scenarios and provide support in decision-making. A systems approach can integrate both qualitative and quantitative data, assimilating empirical data with existing interdisciplinary theories. This type of approach can explain interactions of agents or elements at multiple scales and define their contribution to the emergent behaviors of the system across different levels (e.g., individual, community) or dimensions (e.g., preparedness, recovery) (Mostafavi & Ganapati, 2019). The resulting computer simulation tool can be used to assess policies, interventions, and mitigation activities, determining what system changes will have the biggest impacts on rural health outcomes during disaster events.
Multi-Method Applications, Benefits, and Challenges
The use of multiple or hybrid methodologies in a modeling and simulation application is not new. Hybrid simulations combine the methodological strengths of different modeling approaches and techniques. For example, combining system dynamics, which considers time as continuous, with discrete-event simulation, which considers time as discrete, might allow us to examine a system from both a strategic and operational viewpoint. In other words, using a multi-method simulation attempts to resemble a system as close to reality as possible, thus allowing the stakeholders to get answers to specific questions that might not be possible in a general model. However, this approach is not without its limitations. For example, the specificity of the hybrid simulation comes at the expense of generalizability. Further, a higher level of detail requires more model components, which results in more complex simulation structures, potentially limiting the ability to traceback results or validate the dynamics of the simulation (Mustafee et al., 201533). With these tradeoffs in mind, it is necessary to strategically incorporate only the necessary methods that allow us to answer our research questions, while still trusting the models and the results produced.
Using Simulation to Improve Rural Disaster Preparedness
Disaster management uses simulation modeling broadly. A recent systematic review identified the following simulation modeling methods, in order of frequency, as common in this field: system dynamics, Monte Carlo simulation, agent-based, and discrete-event (Mishra et al., 201934). Disaster risk identification and assessment, disaster prevention and recovery activities, and vulnerability assessments of health care facilities used system dynamics models (SDM) commonly. Disaster rescue and evacuation contexts, modeling healthcare during natural hazards, and disaster management situations used agent-based modeling (ABM) as a modeling tool.
We recently conducted a scoping review to determine the number of studies using MBSE methods in rural disaster contexts (Berg, Marino, et al., 202335). Only six studies met our inclusion criteria, which were commonly used MBSE methods, any rural healthcare setting, any type of disaster, and English language publications. These varied by methods used (Monte Carlo methods were the most common, followed by discrete event simulation), the settings employed (hospital settings were common or specific hospital units), and disaster type and application (most applied to biological disasters, e.g., COVID-19, with simulation applications being split across preparedness and response applications). While simulations and models applied in non-rural settings may be applicable in rural disaster contexts, these models often are not built to consider the differences between rural and urban healthcare systems. Rural systems frequently lack the resources, staff, and specialty training found in urban healthcare settings. Simulation models which account for these rural differences are vital to the successful application of MBSE methods to improving disaster response in rural communities. Therefore, there is a clear need to expand applications of MBSE in rural and remote contexts and to expand the definition of healthcare system beyond the hospital setting to develop more relevant and useful tools for rural disaster preparedness.
Research Questions
The two main research questions for this report are:
- How do the rural healthcare system components interact with other related systems during an acute natural hazard response?
- Can these interactions be modeled in a multi-method computer simulation?
We plan to use this simulation in partnership with our stakeholders in the future to answer a third question:
- Can the resulting computer simulation be applied to improve rural healthcare system efficiency and, therefore, overall public health outcomes after a natural hazard?
Research Design
Our research design involved three principal activities:
- First, we identified specific “use cases” (or case studies) to serve as representative examples of actual natural hazard events to support model construction.
- Second, we developed and conducted stakeholder workshops with representatives from the case study sites to gather specific insight on the event and how a tool like a computer simulation might have helped planning for disaster response. Stakeholders included emergency managers, public health and hospital preparedness program staff, law enforcement, and government representatives.
- Third, we used information gathered during the workshops as a foundation for constructing an MBSE computational simulation.
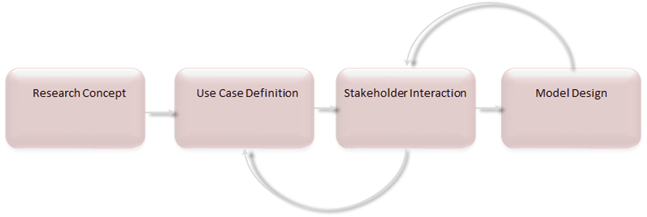
Figure 2 highlights our iterative research design. This approach took advantage of the various disciplinary backgrounds of our research team members and the input from stakeholders from the use cases we used as templates for developing the model.
Figure 2. Iterative Approach for Developing Research Design
Definitions
Healthcare Systems
Any disaster preparedness effort requires coordination among multiple subunits within the broad healthcare delivery system of responders and caregivers. Therefore, we have followed the World Health Organization (World Health Organization, 201036) and defined healthcare systems holistically as “the organizations, institutions, resources, and people whose primary purpose is to improve health” (p. vi). Furthermore, given the unique challenges and disparities that rural communities encounter (Rural Health Information Hub, n.d.-b), we incorporate social determinants or drivers of health in our working paradigm, recognizing that socioeconomic status, transportation resources, and healthcare access play essential roles within the healthcare system (DHS, n.d.-b37; World Health Organization, 2010).
Natural Hazard Definition and Justification
To build a successful simulation, we needed to narrow the broad set of hazard events and focus on a subset of disasters that met these three criteria: (1) acute onset (e.g., tornado or flood rather than gradual onset like drought); (2) short duration of impact (e.g., minutes to days rather than weeks to months); and (3) the result of natural processes (e.g., hydrological or meteorological rather than industrial or technological). We placed no limitations on the size, scope, or intensity of the natural hazard. Further, we focused on how people or systems are immediately impacted by the natural hazard within the few days following the onset of the event.
Since 2000, the most frequent disaster in the United States is flooding, ranked third for fatalities and second in population affected (Centre for Research on the Epidemiology of Disasters, 202038). Approximately 41 million people in the contiguous United States live within a 100-year flood zone (Wing et al., 201839). Floods can occur within tropical/connective storms, alongside tornadoes (complex emergencies), after a winter storm (cascading disasters), or concurrently with other disasters like a pandemic or earthquake (simultaneous disasters). Flooding has direct and indirect impacts on human-environment systems; therefore, we use flooding as a starting point for our simulation and case studies.
Disaster Severity Scale
Given that much of the early disaster preparedness and response research has employed qualitative data (Auf der Heide, 2006), our team used the disaster severity scale (DSS)— developed by de Boer (1990) and tested by Ferro (2005)—to inform and quantify our model inputs, which are described in detail below. The DSS is used to assess major and minor disasters along its classification and scoring system that accounts for the disaster’s effect on infrastructure, impact time, impact radius, numbers of dead and injured, average severity of sustained injuries, and rescue time. Given that the typical U.S. rural county has about 10% of the population of a typical U.S. urban county (Dobis et al., 2021), we adapted our DSS so that our numbers of dead and injured represent 10% of de Boer’s (2000) original DSS classification figures. Our model variables comprise these data in addition to local spatial and aspatial (i.e., attribute) data.
Definition of Rural
In defining rural for this study, we adopted the Health Resources and Services Administration (Health Resources & Services Administration, n.d.40) approach, which combines definitions from the U.S. Census Bureau, the Office of Management and Budget, and Rural-Urban Commuting Areas (RUCA) codes. This approach defines rural areas as a non-metropolitan area, a metropolitan area with RUCA Codes 4-10, or metropolitan census tracts of at least 400 square miles with RUCA codes 2-3 and population density of 35 or less per square mile (Health Resources & Services Administration, n.d.). Similarly, we follow the Cecil G. Sheps Center for Health Services Research (n.d.41) and define rural hospitals as non-federal, short-term, general acute care hospitals. These facilities may be operated as critical access hospitals or in counties classified as non-metropolitan or with RUCA Codes of 4 or higher.
Case Study Selection
We selected two study sites based on the following criteria: (a) the site had experienced recent flood events, (b) was in a rural setting with existing healthcare infrastructure, and (c) had local individuals with deep knowledge of the event who were willing to cooperate with us.
We chose the following use cases and study sites based on the above criteria. The first use case was a flood event that occurred in Waverly, Tennessee; the Waverly flood was an acute event, geographically isolated, occurred with little warning, and had a high fatality rate. The second use case was a flood event that occurred in Nebraska; the Nebraska flood was an acute event, geographically widespread, occurred with more warning, and resulted in extensive damage but a low fatality rate. Details about each disaster are described below and in Table 1.
Table 1. Characteristics of Use Case Flood Events
| Characteristic | Tennessee | Nebraska |
| Date | August 2021 | March 2019 |
| Counties Impacted Directly | 1 | 85 |
| Advanced Notive | Little to no warning (minutes) | Extended warning (days) |
| Fatalities | 20 | 1 |
| FEMA Disaster Declared | Yes | Yes |
| Infrastructure Effects | Extensive damage: Bridges (26) and roadways were blocked or washed away, blocking emergency and other response vehicles. Electric power was lost. Water treatment facilities were destroyed. Communications were offline, including cell towers. All public works vehicles were damaged or destroyed. Three schools were either destroyed or severely damaged. | Extensive damage: Approximately 3.300 miles of roads and 27 state-owned bridges were severely damaged or lost (the bridge count did not include the municipally owned bridges). The rural areas were hit the hardest and experienced delayed funds, equipment, and repairs. Some damaged structures remained more than three years after the floods. Many communities faced problems with animal carcass removal, mold, damaged buildings, and supply chain shortages. |
| Hospital Effects | Delayed care: Patients were unable to reach the hospital due to damage roadways and flood waters. Healthcare coalitions filled gaps in care, especially in chronic disease management. | Delayed care: Hospital employees and supplies were either airlifted or boated to their needed locations. Healthcare coalitions provided essential services, especially for those with chronic illness. |
| Level of Preparedess | High levels of community-level planning and response coordination/communications were essential. Private citizens played a vital response role. | Earlier mitigation proved effective; high levels of community-level planning and coordination/communications were vital. Private citizens played a vital response role. |
| Complicating Factors | The Covid-19 pandemic impacted response; some essential responders were ill (or had died) with the virus, and supply chains were interrupted. Long-term recovery has been hindered by the local economic impact of lost businesses and declining tax-revenues. | Multiple sequential disasters complicated response efforts. Many communities were completely isolated by the flood waters, resulting in long-term essential supply shortages. The pandemic complicated long-term recovery. Economic impact – “costliest inland flood in U.S. history.” |
Waverly, Tennessee
Waverly, TN, the county seat of Humphreys County, has just over 4,000 residents. Less than 15% of its population is nonwhite, and 19% has incomes below the poverty line. Waverly is in Trace Creek Valley, surrounded by low ridges from the Highlight Rim that essentially wall it in.
Waverly experienced a large-scale flash flood in August 2021 that became one of the deadliest flood events in Tennessee’s recent history. The complexity of this flood scenario and its community preparedness and response all factored into our decision to include the 2021 Waverly Flood in our model testing.
Nebraska
The population of the state of Nebraska approached 2 million in 2020. Approximately 12% of the state’s population is nonwhite and 11% live in poverty. Nebraska is part of the Great Plains, and much of the state is till plains and lowlands, with an extensive river and stream network, providing rich farmland for the state’s primary industry.
In 2019, Nebraska experienced an inland flooding event, that caused an estimated $10.9 billion in economic losses—the costliest inland flooding event in U.S. history (Bell et al., 202042). The disaster officially began on March 13, 2019, but significant weather events in the months leading up to that date contributed to the historic flood. In early 2019, between the months of January and March, Nebraska experienced record snowfall, with low temperatures in February keeping rivers and lakes frozen. In early March, rapid temperature increase led to significant ice- and snowmelt. On March 13, Winter Storm Ulmer moved into Nebraska, bringing wind gusts of up to 100 mph and widespread rainfall of up to 3 inches. Combined with the snowmelt, streams and rivers reached record levels quickly, with the flooding being further exacerbated by frozen ground that stopped rainfall infiltration (Nebraska Department of Natural Resources, 202343).
Reciprocity
Our team will continue to engage with the stakeholders involved in this process as we develop final, public-facing tools for rural disaster preparedness staff to apply to improve rural healthcare system efficiency and, therefore, overall public health outcomes after a disaster. Our team also plans to share our project with the newly formed Water Education and Training Center in Tennessee and the University of Nebraska Medical Center’s Water, Climate, and Health Program. Our collaborations with these centers aim to aid flood-prone areas in each respective state in improving their disaster preparedness and response.
Stakeholder Workshops
Stakeholder engagement is increasingly considered a key factor in the success of translational research (Goodman & Sanders Thompson, 201744). For our project, stakeholder engagement has been vital to ensuring that our work results in relevant and actionable recommendations tailored for rural populations. Our research design incorporated collaborative, engaged participation (Goodman & Sanders Thompson, 2017) by including rural community preparedness stakeholders in the design, development, and testing of the computer simulation and in the interpretation of findings. We reached out to previously established contacts from each study site (both of whom were emergency management staff) and requested their suggestions for additional stakeholders.
We scheduled four workshops, two in each case study site, for this project. Workshop 1 was designed to inform the model conceptual design (Task 1). It began with an overview of the simulation project, including history, goals, and a demonstration of a previously developed proof-of-concept model that was a precursor to this work. Then, we asked our stakeholders to describe the flood events and responses in detail. We concluded by brainstorming with participants the model components and variables that they recommended including in the model. For the Waverly case study, we held Workshop 1 on January 24, 2023, with the Emergency Management Agency (EMA) director, the local EMA Flood Plane Administrator, the Waverly police chief, and the city mayor. For the Nebraska case study, we held Workshop 1 on January 31, 2023, with emergency managers from several rural Nebraska counties impacted by the flood (Dodge, Hall, Platte), department of health preparedness staff, and other state EMA staff. Both workshops were held over Zoom and were recorded for clarity and accuracy. Moderators used a semi-structured interview guide to conduct workshops.
The purpose of Workshop 2 was to demonstrate the computer simulation tool that we developed to our stakeholder participants and get their feedback on its representativeness and outputs. We also used Workshop 2 to discuss possible applications of the model and other tools that would be useful for our rural preparedness stakeholders. Again, we used a semi-structured interview guide to conduct the workshop over Zoom, recording the meeting for clarity and accuracy. For the Waverly case study, we held Workshop 2 on May 18, 2023; all the original participants were able to attend, except the city mayor. Due to scheduling conflicts with Nebraska statewide preparedness meetings at the end of May, Workshop 2 for Nebraska was scheduled for June 8, after this report was submitted.
Model-Based Systems Engineering Methods and Computer Simulation
This project focuses on the application of a multi-method simulation to address rural healthcare disaster preparedness and related outcomes. We categorize multi-method models by the integration of different methodologies to overcome the limitations of individual approaches and to create the most representative simulation of the real-world system(s) under consideration. Below, we provide basic descriptions of the distinct methodologies we employed, along with more detail about the applications, benefits, and challenges of multi-method simulations.
Agent-Based Models
Agent-based modeling (ABM) simulates the interactions of individual elements within a complex system. Elements are referred to as “agents” and can include people, things, places, or time, among others. This method uses a unification, or “bottom-up,” approach which is very granular. Each agent can have a set of unique attributes. ABM is useful when emergent behaviors might be a result of the system. It is also an ideal approach when a fine level of model granularity is important, agents need to have unique characteristics and behaviors, or agents need to interact. The strengths of this approach include determining how the system behaves when individual agents interact with other agents and the environment, defining interactions and communications between agents, and bridging gaps between microlevel behavior and macrolevel phenomena. However, there are some limitations, including ignoring feedback loops that agents might experience from external factors, being too detailed to simulate over long periods, and being sensitive to small variations in inputs (Ding et al., 201845; Mostafavi & Ganapati, 2019; Sumari et al., 201346). Healthcare, public health, ecological systems, and other application settings apply ABM where the modeler is interested in the detailed stochastic interaction of the objects within the model (Mostafavi & Ganapati, 2019).
System Dynamics Models
System dynamics models (SDM) are a subset of equation-based modeling using ordinary differential equations and the concept of quantities and rates of change (i.e., stocks and flows) to understand the non-linear behavior of dynamic complex systems. SDM uses a reductionist philosophy, or a “top-down” approach, and focuses on the aggregate of the system. SDM considers the general, long-term behavior of a system, rather than its minute details. SDM employs the concept of stocks, flows, and causal mapping to represent the elements and interactions of a system. (See Table 2 for definitions of these terms.) Some strengths of SDM include understanding complex system behaviors, describing interrelationships in systems, demonstrating how the system changes given different scenarios, and visualizing and analyzing dynamic feedback structures. Some limitations of this approach include ignoring relationship between the macro and micro behaviors, failing to incorporate spatial interactions, lacking interpretation of how microlevel behaviors affect macrolevel phenomena, and failing to incorporate temporal changes in agent behavior (Ding et al., 2018; Hoard et al., 2005; Homer & Hirsch, 2006; Mostafavi & Ganapati, 2019; Sumari et al., 2013). SDM is useful in strategic applications, for example, considering the impact of policies, strategy, and general operating interactions. Applications of SDM include public health, business systems, climate, and healthcare (Mostafavi & Ganapati, 2019).
Table 2. Definition of Modeling Terms
| Term | Description |
| Stock | A stock is a resource including things like supplies, stockpiles, capabilities, or staff. Stocks are built up and/or used over time. |
| Flow | Flows refer to the rates at which quantities or variables move or change within a system. They represent the flow of resources, materials, or information between different components or stocks of a system. Flows can be physical, such as the movement of water through pipes, or abstract, such as the transfer of knowledge between individuals. |
| Casual map | This refers to a graphical representation of the causal relationships between variables in a system. It visually depicts the cause-and-effect relationships among the various elements of a system and helps to illustrate how changes in one variable can influence others. |
| Agent | An agent represents an individual object in a model. It can be a person, a collection of items, or an organization. Individuals can have different attributes (e.g., age, gender, location). |
We followed a standard three-task approach to systems engineering to develop the model: Task 1: Model conceptual design, Task 2: Model development, and Task 3: Verification and validation.
Task 1: Model Conceptual Design
In the conceptual development stage, we defined the areas the model would cover, identified key factors and variables for incorporation, and established the systems considerations (e.g., requirements definition, inputs, desired outputs, interactions of variables and factors). Elements of the model included the following:
- Healthcare System
- Emergency Response
- Emergency Management Agency
- Public Health
- Geographic Information Systems (GIS) interface function
- A function that simulates the population affected by the event (Public)
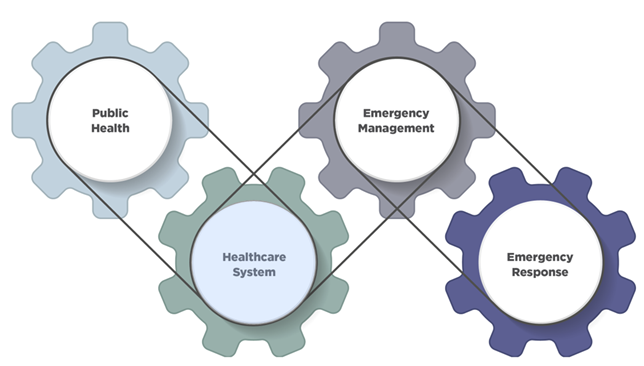
The dependent variable in the model was the effect of the event on the healthcare system. Output variables illustrate the resultant effects. Similarly, input variables are based on the other model elements. The supporting data, provided via the GIS interface, includes demographic, topographic, hazard, structures, and infrastructure data. Appendix A provides a list of the modeling guidelines that we used. Figure 3 Illustrates the system of systems model design approach.
Figure 3. Rural Disaster Planning and Response as a “System of Systems”
Model output variables were designed to represent how a rural healthcare system would respond during and after a natural hazard event. These performance indicators were based, in part, on conventional healthcare system performance indicators tailored to a rural healthcare system. No specific rural healthcare system performance parameters were identified in the literature; the output variables for this model are presented as an initial representation of rural healthcare system performance.
Task 2: Model Development
The development phase focuses on constructing the model based on the features and factors identified in Task 1. We integrated the two modeling approaches described above—agent-based and system dynamics modeling—to provide an optimum computer modeling approach. We evaluated other modeling approaches, such as Bayesian networks, Markov chains, and Monte Carlo, and discrete event simulation, but we decided to use the two selected because they best represented the model features that best captured the general nature of the systems’ operations and the specificity of population dynamics. We limited the simulation to two model types to minimize the overall model complexity. We constructed the model as individual functional elements (i.e., the healthcare system, emergency response, emergency management agency, public health, and the population) that interact through key variables. Using an iterative approach, we built the model and used surrogate data to evaluate model operability, while the actual data for the operation of the model was identified and collected. Figure 4 highlights the general structure of the model with the systems elements, key factors, and variables. Information on the supporting data used for model input with examples is provided in Appendix B.
Figure 4. The Functional Elements, Key Factors, and Variables of the Model
Task 3: Model Calibration
We performed model calibration to evaluate the model outputs to see if they align with expected values. Model outputs included characteristics of the population impacted by the natural hazard, number of people by location and treatment status (e.g., stranded, sheltered, being treated or not), number of deaths by location, number of preventable deaths, and number of arrivals and individuals being treated at a given healthcare facility. Ensuring the model represents the functioning of the actual system poses a greater challenge. We broke the model into subsystem elements to assess its logical operation and compare it to expected outcomes based on historical information. These subsystems were integrated into the “system of systems,” and performance assessment evaluated system effects including interaction effects, emergent phenomenon, learning, and adaptation. Given the limited amount of data from the literature and other sources, we used a heuristic approach to modify model structure to obtain the expected results.
Model Details
Timeline for Simulated Hazard
The model of the flood event simulates the first five days of the event, with the event occurring after 30 minutes of the start of the simulation to allow for stabilization of the model. The time unit used in the model is one hour. Once the event occurs, the initial settings for the population size, percent of the population that are affected, and all the adjustable key parameters and variables drive the rate of healthcare and emergency response. The model simulates, at the hourly level, the healthcare and emergency response, as well as the behavior of the civilian agents, which are discussed in the following section, around components of the model.
Emergency Response Factors and Modeling Methods
To model the influence of various factors on the capability of the healthcare system to respond to an unexpected natural hazard event, the model uses a set of variables and key factors. Appendix C contains tables describing the key variables and parameters of the model. The variables, or “hard factors,” relate to things that are actual quantities, including the amount of healthcare resources, emergency response capacity, or the location of healthcare centers. In addition, the variables include the hazard-related variables such as the areas affected and the level of inundation. Variables capture population-related factors, such as the age, race, gender, and other social determinants of health of those affected along with the expected arrival rates of the patients to the healthcare system in a normal scenario.
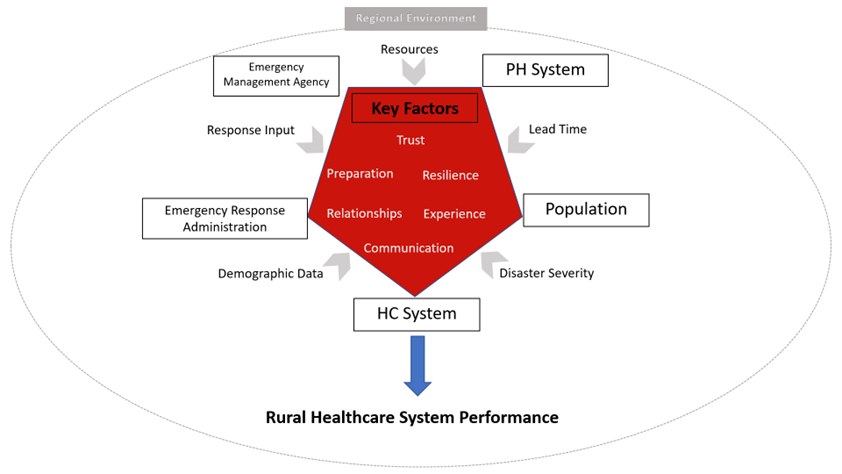
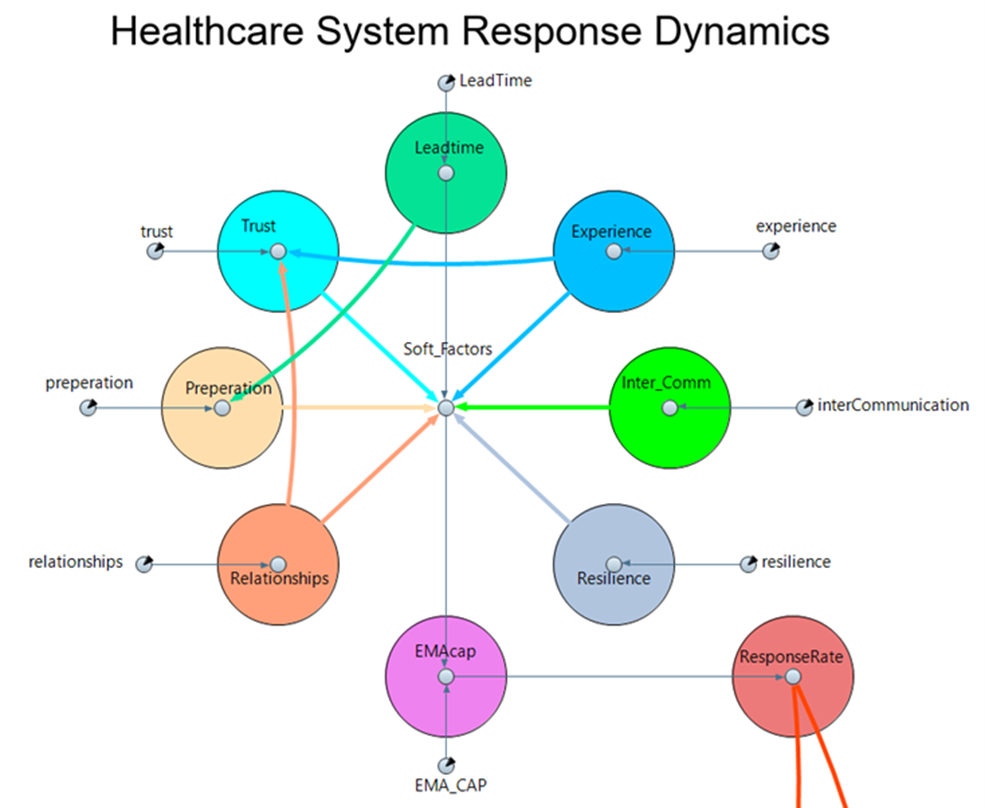
“Soft” key factors represent difficult to quantify variables that drive the ability of the system to respond to the event. These include the interagency trust of the healthcare and emergency resource organizations involved, the level of interagency preparation for the event, the strength of the relationships between these organizations, the experience of the organizations with the event, the communication levels with potential outside organizations that can provide support, and the resilience of the area. Along with the level of lead time for the event, these factors shape the ability of the health care and emergency response systems to handle the event. As seen in Figure 5, trust is influenced by experience and the strength of the relationships between the organizations. The factors are weighted based on previous regression analysis (Krogh & Lo, 202347) that describes the relationship between these, and other non-statistically significant factors, in terms of trust. Similarly, the level of preparation is augmented by the lead time or advance warning before the event. These “soft” key factors drive the response level and rate of response to the event.
Figure 5. Key Factors of Event Response
The model consists of three main components, with two being the system dynamics of the healthcare and emergency response components. The third main component of the model consists of the population in the area affected by the flood event. The system dynamic components intend to model the dynamics of the variables and key factors that drive the healthcare and emergency response. The inclusion of the healthcare system focuses on the effects and influences of the healthcare system during a flood event. The emergency response includes first responders that help drive up the patient load to the healthcare system as they perform their rescue tasks. The speed and efficiency of the emergency response portion will directly affect the rate and condition of the patients that need medical attention due to being injured during the initiation of the event or the ancillary potential situations that can lead to injury. The faster the responders can get to those in need, the better the condition of those that need medical attention at a healthcare center, and the faster the influx of patients into it. These components are driven by the soft and hard parameters set by the user.
Geographic Information System-Based Loss Estimation
We overlay Hazus flood depth grid and polygons onto other layers, e.g., structures, transportation, etc., to determine which structures/facilities/roads, etc. were inundated by the flood. Further spatial analyses determine which residential areas, e.g., census blocks, were cut off from various normal services, e.g., ambulance, hospitals, etc.
Ethical Considerations and Researcher Positionality
We obtained a waiver of exemption from the University of Tennessee’s, Knoxville (UTK) Institutional Review Board (IRB), since our proposed research activities did not include identifiable data on individuals. Regardless, all investigators completed the required IRB training related to human subjects research and Natural Hazards Center training modules on public health and broader ethical considerations in disaster research. Our interdisciplinary team included expertise from multiple fields: health policy, nursing, engineering, public health, geography, and disaster epidemiology. We have worked as a team on previous projects and through these experiences learned to integrate information, methods, and theories across our individual disciplines (Berg, Kintziger, et al., 202348; Berg, Marino, et al., 2023).
Results
Stakeholder Workshops
Waverly, Tennessee Workshop
During our January 24, 2023, workshop with Waverly stakeholders, we learned that this part of Tennessee has a history of natural hazards, including several significant flood events since 1984, most of which caused few injuries. However, the 2021 flood involved a broad area and occurred with little warning. The watershed received almost 21 in (53 cm) of rain in 12 hours. With Over 250 persons missing at one point, the flood ultimately caused 20 deaths and multiple injuries.
Effects on Infrastructure and Communications. Buildings and other structures quickly succumbed to rising flood water, and the community’s infrastructure was severely damaged, blunting response effort. All public works vehicles were either severely damaged or destroyed, and twenty-six bridges and multiple roadways were blocked or washed away, blocking emergency and other response vehicles. Furthermore, water treatment facilities were destroyed, requiring months to restore. Communications were forced offline because the main fiber optic cable and cell phone towers were damaged. Consequently, many initial 911 calls did not reach dispatchers. Temporary cell towers had to be erected, a rapid stop-gap measure coordinated by the county executive and the Tennessee Emergency Management Agency. During and following the storm, there was a short lag in GPS updates to account for missing routes and detours, which slowed emergency responses initially. Still, local 911 operators (who were very familiar with the local terrain and geography) quickly became aware of the required routing changes, which improved response times somewhat soon thereafter.
Effects on Healthcare Facilities and Schools. The Humphreys County Health Department, the main building which normally provides clinical care and vital records, was damaged and had to operate from an old clinic for several months following the Waverly flood. Effects on other health facilities varied. Notably, injured and ill residents could not access the hospital due to the loss of surrounding infrastructure such as washed-out roads and bridges. In fact, the hospital played a lesser role as most injuries were treated onsite. Remarkably, no bedridden patients died in the flood waters. Eventually, the Highland Rim Healthcare Coalition (comprised of nurses and nurse practitioners) provided medications for residents with chronic conditions, immunizations, bathrooms, shower trailers, and other essential resources. Furthermore, two schools were destroyed, and another was significantly damaged, displacing 1,100 students. Most of these students were still not back at their regular schools nearly two years after the flood, resulting in anxiety and mental health crises among students, teachers, and staff for many months following the disaster.
Effects on Housing. Rapidly rising flood waters destroyed many homes in Waverly and surrounding Humphreys County. Most of the community’s public housing was destroyed, exacerbating an existing housing shortage. As a result of the growing housing shortage, many affected residents left the community, which caused many businesses to shutter and further damaged the local economy and reduced the tax base.
Responders: Volunteers, Agencies, and Non-profit Groups. Response efforts relied heavily on the community’s cohesive team-oriented response units. Given the severity of the situation, outside assistance was essential. Private citizens were the first to assist, followed by a second wave of trained responders, including the Tennessee Highway Patrol, swift water rescue teams, and members of the local police and fire departments who could reach the disaster site. Early in the disaster, the state provided a mobile morgue with DNA identification capabilities. Furthermore, in addition to the Highland Rim Healthcare Coalition, many other organizations assisted in relief efforts. These groups included church-affiliated response organizations (which brought food, water, clothing, etc.) and outside public works groups that assisted with debris removal (it took nine months to clear most of the debris). In total, several thousand people arrived to help throughout the recovery, and some remained to assist as of January 2023.
Waverly Disaster Preparedness. The Waverly stakeholders revealed that prior disasters provided a myriad of preparation opportunities. They felt that routine debriefings following previous emergencies and disasters offered valuable lessons. Also, the community continued to prepare by building on one another’s strengths (rather than operating in silos) and engaging in preparedness drills. These drills include annual full-scale multi-agency exercises, tabletop exercises throughout the year (involving healthcare providers), and monthly EMA committee meetings (with multiple agencies and volunteers). Also essential were law enforcement multi-agency training sessions and debriefings and prepping lower-level employees to lead their departments if department heads were unavailable or injured. When asked how they would score on a scale of 0 to 5 (with 5 being the highest score) these preparedness activities in importance to their 2021 flood disaster response success, these Waverly stakeholders scored their preparedness activities as a 4 out of 5 in importance.
Nebraska Workshop
During the January 31, 2023, workshop with Nebraska stakeholders, we learned more details about this widespread flood event that affected 84 of the state’s 90 counties.
Effects on Infrastructure, Health Care, and Public Health. The damage to the transportation network was extensive. As mentioned in Table 1 above, approximately 3,300 miles of roads and 27 state-owned bridges were severely damaged or lost. Additionally, an unreported number of municipal bridges were also damaged. This loss of roadways led to isolation of communities, which quickly ran out of critical supplies, including gas and fuel, blood supplies, lab specimens, medications, etc. Hospital employees and supplies had to be airlifted or boated to their needed locations. Many individuals who lost their homes to their flood or who were unable to access them stayed in area shelters which were heavily utilized during the event. Only one fatality was reported, and rescues were widespread; Columbus, NE, alone had 81 rescues.
The rural areas of the state were hit the hardest and experienced delays in funding, equipment, and repairs. Some damaged structures remain to this day, more than three years after the flood. Many communities faced problems with animal carcass removal, mold, damaged buildings, and supply chain shortages; the mental health toll was profound.
Nebraska Department of Health and Human Services representatives noted that a lack of local housing regulations resulted in the faulty condemnation of structures, housing shortages, and related public health fallout. The fallout included water and food insecurity, shelter safety and supply concerns, hospital isolation (with limited staff, supplies, and testing), and special populations’ safety/health worries. The healthcare coalition nurses and the pharmacy committees obtained and delivered needed medications and supplies to chronically ill patients. The healthcare coalitions are currently expanding their relationships with local EMAs to bolster their response capabilities.
Nebraska Disaster Response. At the state level, the response was challenged by multiple sequential disaster events over four months, including wind, snow, and flood events, all necessitating sophisticated coordination of resources. Representatives from the Nebraska Emergency Management Association (NEMA) stated that this response required a scaled approach, moving from local to state and federal and then scaled back down through state to local (local >> state >> federal >> state >> local) and is expected to last at least eight years and involve over 500 employees. The pandemic further complicated recovery efforts.
At the local level, private citizens, the National Guard (including vehicles and aircraft), the Forestry Services, the Department of Agriculture, and non-governmental organizations all played a role in response and recovery. Donation management was an issue, and stakeholders noted that many communities would have benefited from coordinated management of volunteers and supplies.
Nebraska Pre-Disaster Mitigation and Preparedness. Stakeholders stressed that earlier mitigation efforts prevented even more significant losses. These efforts included creek/river diversion, levee construction, drainage improvements, floodplain structure removal and elevations, and limited waterfront development. Real-time inundation flood mapping, which will be essential to future mitigation, is currently being developed by NEMA in conjunction with the University of Nebraska.
Stakeholders highlighted the benefits of networking at the local and regional levels as crucial to successful preparation and response efforts. Participants praised the City of Wood River (population 1,500) for their close-knit knowledge of one another and its consequent robust response. For example, the fire department’s spouse auxiliary unit was beneficial, as were the fire departments’ mutual aid agreements. Other beneficial approaches included regular response debriefings at the local level, monthly regional preparation meetings, and local leaders willing to make tough decisions when required.
Computer Simulation Results
Example Outputs From Waverly Scenarios
The following section focuses on the results for a worst-case Waverly, Tennessee flood scenario. To demonstrate the simulation function and outputs, we highlight only this event in our results for brevity and because of the sudden, acute nature of onset and compressed timeline of events and to demonstrate how the event severity and key factors of the emergency response system influence outcomes. The Nebraska scenario simulation included inputs relevant to that flood event and produced outputs that aligned with the actual event.
Figures 6-10 display examples of the results the simulation produces for each of the healthcare system output variables. In each instance, time is the amount of time between the onset of the event and the end of the occurrence. The simulation induces the event thirty minutes after the simulation starts and is based on the GIS-model of how the flood event would inundate specific proportions of the census tracts.
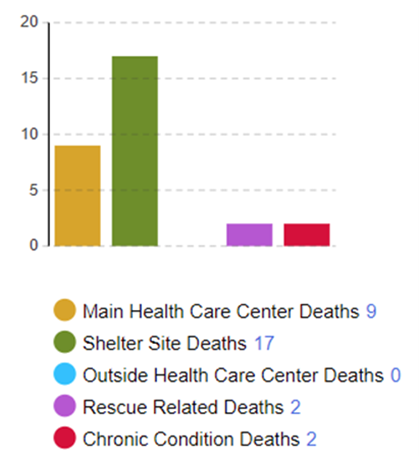
Figure 6 demonstrates how the model predicts preventable deaths, or people who lost their lives due to the inability of emergency responders to arrive on site, the lack of staff or supplies to respond to health-related needs at healthcare centers or shelters, or the inability of chronically ill patients to access needed medicines or care. For this iteration of the model, the main healthcare center, a site in the shelter area that can provide medical aid and treatment, and an optional outside healthcare center are tracked. The deaths are those that were due to an inability to rescue or treat the persons in an efficient manner and do not include those that occur due to the onset of the event itself. The number of deaths at the main healthcare center are those that occur at the main healthcare site due to patients being untreated due to the influx of patients and inability to effectively respond to the demands. Similarly, shelter site deaths and outside healthcare center deaths are those that occur at those locations due to lack of treatment for a prolonged period for severely injured patients. The number of severely injured patients is directly proportional to the severity of the event. Rescue related deaths indicate the number of persons during the simulation that were severely injured and died before they could be rescued. Finally, chronic condition deaths are those due to persons with chronic conditions requiring regular treatment being unable to attain it due to the event that could have been prevented if the emergency response system could have given it to them in a timelier manner. The numbers in the graph are the number of deaths that occurred at each site based on this worse case simulation in the Waverly flood scenario.
Figure 6. Example of Model Output Showing Preventable Deaths
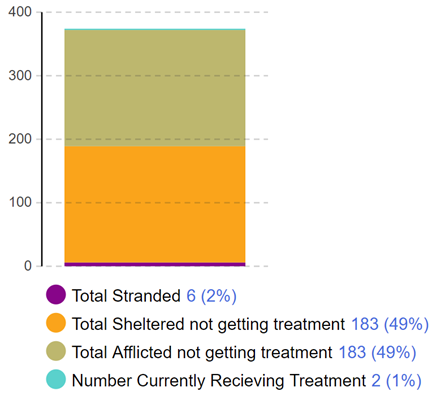
The GIS function reveals the proportion of the census tract that will be flooded in an event and the percentage of the population that will be affected in some way. Figure 7 shows various categories of affected and afflicted individuals. Affected individuals are those in areas inundated by the flood. Afflicted individuals are those in need of emergency or other medical care during the event. First, Figure 7 shows the number of individuals in the affected area who are stranded and in need of some emergency response rescue. Some individuals will also be afflicted because the event has reduced their ability to receive or access emergency care or treatment for chronic medical conditions. In non-stranded affected areas, affected individuals will be able to move to the shelter site. Some of these individuals will not need treatment and some will but will be unable to receive it while resources are limited (i.e., total sheltered not getting treatment). Afflicted individuals in this group may need to seek medical care at either the main healthcare center or the shelter site healthcare center, with some being able to receive treatment at a given time interval (i.e., number currently receiving treatment) and others unable (i.e., total afflicted not getting treatment). As those who are currently receiving treatment receive the care they need, others in the “not getting treatment” categories will be moved into the “currently receiving treatment” designation at a rate proportional to available staff and resources.
Figure 7. Example of Model Output Showing the Number of Affected and Afflicted Individuals During Event by Their Location
A proportion of each of the afflicted or affected groups will be injured or killed (Figure 8). The simulation depicts the worst-case scenario where the key factors and system components efficiency are at a minimum and the event severity is at a maximum. The low levels of key factors and system response lead to higher numbers of people being untreated and without rescued persons, which, in turn, caused more deaths, while the high severity increases the proportion of the population affected by the event. These deaths can further be classified for planning purposes by location of death (healthcare center, shelter, or while stranded) and cause (event related injury death vs. death due to untreated or unmanaged chronic condition because of inability to get care after the disaster). A more effective response to the event will reduce the number of deaths.
Figure 8. Example Model Output for Casualties Over Time Across Different Healthcare Sites
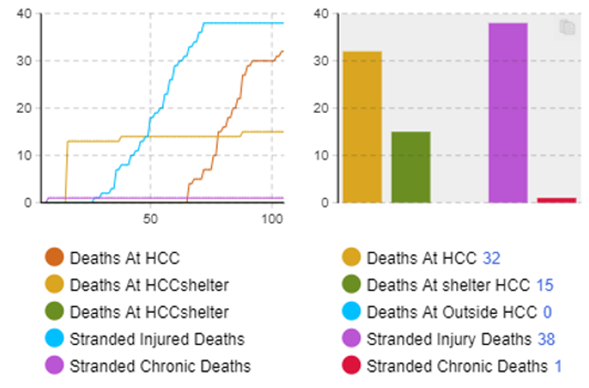
Figure 9 depicts an example of how the model also tracks the arrivals, treatments, and departures of persons within the healthcare system. The current model does not track long-term stays and only focuses on the system's ability to treat the patients as they arrive, but future models can have this ability included. This allows for an analysis of how well the healthcare system can respond to the needs of the public due to the increased load brought on by the event. Similarly, the ratio of arrivals to treated patients are displayed for a quick overview of what proportion of those persons who went into the healthcare system can be treated within the first five simulated days. The overall ratios of distinct types of effects (stranded/isolation, sheltered, afflicted) is tracked to allow for an analysis of the numerous ways the population is affected and what proportion of each in the affected areas.
Figure 9. Example Model Output of Healthcare Center Arrivals and Treatments Over Time During Flood Event
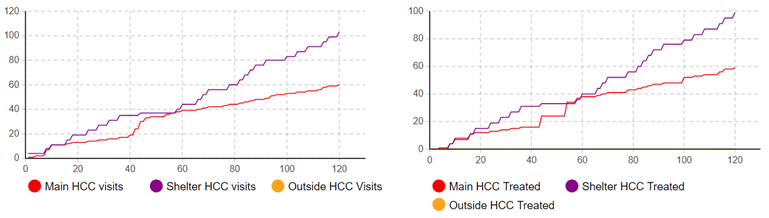
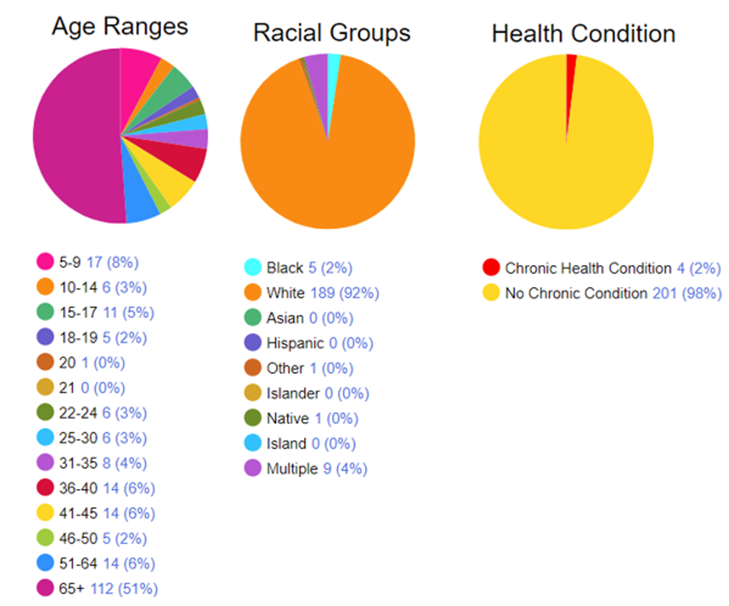
Figure 10 depicts examples of demographic outputs that the model can track in addition to the healthcare and emergency response system outcomes. These demographic outputs include the age, race, and chronic health conditions of those in inundated areas based on the GIS modeling of the event and census data. From this information, stakeholders can gain insights into what types of people will be affected and understand what needs the affected population may have. For instance, in this Waverly-based simulation, the most affected populations are older than 65 (known vulnerable population) and White, non-Hispanic (based on baseline community population). Around two percent of the affect population have chronic health conditions. These data are based on U.S. Census estimates by Census block for the underlying baseline Waverly population and the flood-inundated Census blocks in the area. Such information could prove useful for preparation efforts and allow for an understanding of what types of needs those affected by the event will have.
Figure 10. Example Model Output of the Age, Race, and Chronic Condition Status of Those Affected by Flood Event
Modifiable Inputs for Comparison Scenarios
The model inputs are controlled via a virtual "cockpit" which serves as the user interface to the model. The user has a set of sliders that modifies each of the factors or variables at the start of the model. Each key variable is an index that can be within the range of one to five indicating the level of that variable in the simulation scenario. Each of the key factors represents distinct characteristics of the emergency response system and how they interact and relate to one another. These key factors, as indicated through the stakeholder workshops, influence the emergency response systems capability to respond to the event. Some of the key factors indicate the different system components (emergency response, healthcare response, public health, emergency management) ability to work together to meet the needs of the population (trust, communication, relationships) while others indicate the different preparatory tasks performed to fortify the system to handle the event (preparation, resilience, lead time). When the simulation is set to have maximum values for each key factor, the event response is expected to be able to respond to the needs of the population quickly and efficiently during the event. When at a minimum, the system is expected to respond with much less capability to the resulting requirements of the people affected. A description of these user-controlled factors, variables, and values is provided in Table 3.
Table 3. List of User-Modifiable Input Values
| Name | Type | Value* | Operational definition |
| Trust | Factor | 1-5 | Interorganizational trust |
| Resilience | Factor | 1-5 | Community resilience |
| Communication | Factor | 1-5 | Effectiveness of communication among organizations |
| Preparation | Factor | 1-5 | Degree of disaster planning and activities prior to an event |
| Relationships | Factor | 1-5 | Formal and informal relationships among organizations |
| Experience | Factor | 1-5 | Prior experience with similar events |
| Demographic Data | Variable | 1-5 | Population data including socioeconomics and location information |
| Response Input | Variable | 1-5 | Ability to respond to an event |
| Resources | Variable | 1-5 | Availability of resources |
| Disaster Severity | Variable | 1-5 | Relative impact of event on the community |
| Lead Time | Variable | 1-5 | Amount of advanced notice for event |
The healthcare subsystem output showed that the relative performance of the subsystem declined at the start of the event, this lower overall performance sustained through the event and began recovering as the event impact diminished. Similarly, the output of the public health system function, that is, the public health performance index indicating the system's ability to respond to the needs of the population, decreased shortly after the onset of the event and went through a series of oscillations with the rate of change demonstrating a lag in response. This phenomenon is the system attempting to catch up, but it tends to overshoot or undershoot until it reaches a more nominal level. The emergency management subsystem provides a graph like the public health subsystem, with more moderated diversions.
We compared simulations with the model settings at the lowest value (all key factors set at 1) and the highest value (all key factors set at 5). Preliminary results show marked improvements in outcomes under the latter configuration. The key factors are used to determine the response rate as a percentage of required needs (emergency response, healthcare) to what the system can provide. For this comparison, the event severity is left at a moderate (1) level, but the model will allow the severity to be increased to explore the effect of various levels of event. When trust, training, and other controllable settings were set to their most ideal settings, preventable deaths decreased by 89%, average emergency response times went down by 77%, average patient treatment wait times decreased by 38%, and the average condition of patients improved by 8%.
The responses induced by the changes of the inputs align with relationships indicated in the literature and through workshop discussions, indicating that our model includes the correct factors and relationships and that the model interactions have been calibrated correctly. Figure 11 demonstrates the effect of more optimal healthcare response on the overall healthcare system needs. The green area represents the level of emergency response needed by the population whereas the red area represents the number of persons that have arrived in the healthcare system seeking treatment. The graph on the left of Figure 11 shows the outcomes when the key factors from Table 3 are set at the minimum, while the graph on the right depicts the outcomes when those factors set at the maximum. Both graphs in Figure 11 show the effect on the emergency response (rescue, on location medical aid) and healthcare (injuries, chronic condition treatment) needs over time. The green area indicates the emergency response needs of individuals in the flooded area, including individuals needing aid to evacuate the area or some other form of assistance that they cannot provide for themselves. The red area plots the healthcare needs, with the vertical axis indicating the number of persons who have arrived at one of the simulated healthcare centers (main or temporary shelters) in search of medical treatment. At the start of the event, there was an increase in the number of people needing a response from the emergency response system. The model treats patients based on the level of injury—here, treated as an index between one (low level) to five (extreme medical need) with the most extreme cases being treated first. As the patients are treated using the available healthcare resources, the patients leave the healthcare system. The Waverly area simulation (Figure 11) has an average of four people arriving for health care per day. This is the baseline level of arrivals, or the capacity to treat people at a given time, for the main healthcare center.
Figure 11. Comparing Healthcare and Emergency Response Needs Over Time in Best- and Worst-Case Scenarios
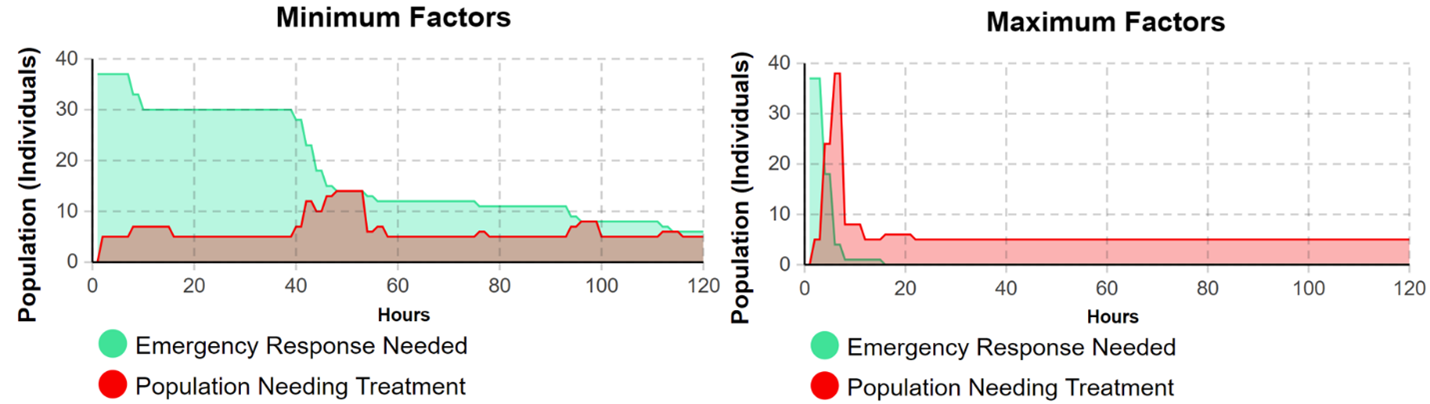
According to the simulation of a Waverly-like event, when the Table 3 factors that determine response capability are at their peak, the emergency response function, which includes first responders that can handle low-level medical or rescue needs, and healthcare system resources that handle more dire medical needs and chronic health treatments, can service all required needs within the first 24 hours of the simulation. In the worst-case scenario, however, the simulation indicated that the emergency response function was only able to service 84% of those needing first responder aid before the end of the 5-day period. The graph in Figure 11 depicting the worst-case scenario simulation shows that when the systems emergency response capability is lower, more persons are left in need for a longer duration of time, and that the increase in patient load during the first five days is spread out over the course of the event. This leads to longer rescue wait times and higher average injury rates. The best-case scenario graph on the right shows that when the emergency response capability is high, rescue speed is much faster leading to a sharper decrease in remaining emergency response needs (green area). There is an accompanying short-term spike in the healthcare needs (red area) by the population as some are delivered into the health care system. In this scenario, there are sufficient healthcare system resources (e.g., personnel, equipment, etc.) to meet the emergency care needs of the individuals arriving at healthcare centers. The affected population is able to enter and be treated by the healthcare system quickly, which allows it to return to their expected baseline hospital population of around four persons a day.
Follow-Up Stakeholder Workshop
Our research team met with stakeholders from Waverly, Tennessee, on May 18, 2023, and from Nebraska on June 8, 2023, for a second time. Our team presented a high-level overview of the results of the simulation model that we had developed. The demonstration included a GIS data visualization of how a 100-year flood scenario would impact the region’s healthcare facilities, infrastructure, and population. The modelers explained that the GIS data and map layers help tune the model to better simulate healthcare system performance during the flood event. The model demonstration also included worst- and best-case scenarios for a 5-day acute response phase to the 100-year flood event.
Stakeholders provided their impressions of the model, which we will use to inform our future research and model iterations. The stakeholders felt the current model (which primarily focuses on healthcare effects) was informative, but they wanted to see a greater emphasis on the emergency response outputs, such as response times. They also wanted the model to account for water flow rates/inundation (e.g., an x-inch rain event), water recession and the conclusion of the flooding, varying disaster types (e.g., school shootings, tornadoes, etc.), and “plot twists” (i.e., unexpected complications). The Waverly and Nebraska stakeholders committed to working with our team in the future.
Discussion
The project was able to address each of our research questions and effectively demonstrated that a computer simulation can represent the disaster management processes during an event and serve as a resource for process improvement. Our first research question was focused on how rural healthcare system components interact with other related systems during an acute natural hazard response. Our iterative approach to the model design helped to define the system components and their interactions. As detailed above, the system components, which included Emergency Management, Public Health, Health Care, Emergency Response, and Population were defined, and their interactions were outlined.
Our second research question considered whether these interactions could be modeled in a multi-method computer simulation. Our results demonstrated that we were able to accurately represent the interactions of these system elements using a systems dynamics modeling approach showing the respective interactions and relationships. An agent-based modeling approach was used to simulate each individual in the designated population. GIS was used to determine the physical impact of the natural hazard event and what elements of the community and population were affected and to visualize the area of inundation. Further, we were able to determine the demographic and other characteristics of the affected population, which will be useful to understand the underlying vulnerabilities in a community for disaster planning.
Our third research question focused on how the resulting computer simulation could be applied to improve rural healthcare system efficiency and, therefore, overall public health outcomes after a natural hazard. We have set the stage to use this computer simulation to help rural healthcare systems understand the effects of natural hazard events on their community. The model is still in its early stages of development and will benefit from additional efforts to enhance its utility to planners and community leaders through continued stakeholder engagement.
Conclusions
Public Health Implications
This effort has resulted in five important contributions to the fields of rural healthcare systems and disaster preparedness and planning: (1) we have demonstrated that a hybrid computer simulation model approach is an appropriate tool to represent the operation of rural healthcare systems and disaster preparedness and planning; (2) we created a model that represents the major subsystems and their respective interactions, which has been reduced to a computational model; (3) the model has provided initial results demonstrating the effects of planning changes in the public health and emergency planning subsystems on performance of the healthcare system; (4) an MBSE approach is an effective tool for combining the subsystem components of healthcare and disaster preparedness; and (5) incorporation of GIS data is a significant advancement as it effectively integrates multiple disparate data sources and aids in data visualization.
The hybrid modeling approach defined in this effort aligns with the public health field’s desire to increase the use of modeling and simulation to accelerate innovation (Maglio et al., 201449). This model provides a quantitative output of the behaviors of the system's elements. It accomplishes this by providing an output in the form of an index for healthcare system performance that indicates the causal relationship between the changes in the subsystem factors and the effect on the healthcare system. The model accurately represents the effects of communication, planning interactions, availability of funding community resilience, and the role of initial preparedness.
Our project also revealed a potential weakness in coordinating the responses to a hazard event in rural areas. Local hospitals may be either inaccessible (to patients and employees) or overwhelmed by a surge, depending on the location, nature, and severity of any given disaster. In either scenario, patients with chronic diseases and routine care needs (such as chronic obstructive pulmonary disease and end-stage renal failure) may be left unattended and untreated. This situation could result in a surge in indirect casualties (Auf der Heide, 2006), which often go unrecognized, and that data may not include. Furthermore, patients with acute treatment needs resulting from direct effects (e.g., near drownings, crush injuries, etc.) may encounter costly treatment delays, leading to an uptick in direct casualties. These anticipated delays in care and increased direct and indirect morbidity and mortality affect the quality of life and community recovery (Links et al., 201850).
The overall public health implication derived from our project is that communities should identify and prepare for alternative care delivery routes prior to natural hazard events. Additionally, area hospitals and emergency preparedness organizations should prepare well before a disaster to shift their care coordination when an event transpires. Recently the Centers for Medicare & Medicaid Services (n.d.) implemented its Emergency Preparedness Rule in 2017, requiring multiple CMS-participating organizations (including rural/critical access hospitals) to provide routine risk assessment and planning, policies and procedures, communications plans, and training and testing. Moreover, the Administration for Strategic Preparedness and Response (n.d.51) at the U.S. Department of Health and Human Services coordinates multisectoral responses, including local, regional, state, and national healthcare and public health entities, to enhance preparedness and response. Our stakeholder workshops, particularly in Waverly, TN, revealed that these coordinated preparations paid off, as the Highland Rim Healthcare Coalition played an essential role in treating and managing the area’s patients with chronic and acute care needs.
Public Health Tool Development
Our application of hybrid MBSE methods advances disaster research and rural communities’ preparedness by delivering a useful decision-making tool that can be applied by multiple rural preparedness audiences (e.g., healthcare, public health, emergency management). Further, our simulation provides an understanding of how the rural healthcare system interacts with the other system elements defined in this model in response to a natural hazard. Rural healthcare officials, public health practitioners, and emergency managers can use the final computer simulation to test their existing policies and procedures, determine how to use existing resources most effectively, and identify where additional resources are needed. We will continue to work with our stakeholders to develop a final tool that can be shared via an online interactive platform for widespread dissemination and use. We will provide on-demand training videos and instruction manual for the publicly available tool once complete. This data-driven simulation will be useful for assessing and predicting healthcare impacts and public health outcomes and supporting disaster management activities. Advancing the development of this model allows rural healthcare and disaster preparedness practitioners to better understand the interaction of the components making up this system and to do “what if” scenarios to gage the effects of changes in approach to the operation or planning of the healthcare system and disaster planning.
Limitations
Our project has several limitations to note. Using the case study approach was a significant benefit in developing the computational model. Limiting our number of case studies to two case studies constrained our perspective on natural hazard type and the breadth of hazard information we included in the model. The literature and data sources on disaster event response preparedness is expansive. However, finding quantitative data specific to the variables used in the model was a challenge and will be a continuing effort. This model attempts to balance parsimony with providing an accurate representation of the complex systems involved in disaster response. We are engaged in ongoing efforts to evaluate the model’s performance and to validate its behavior, its structure, and outputs.
Future Research Directions
This effort resulted in significant improvement in our previous proof-of-concept model. Elements of GIS and ABM enhanced the model performance. Strides were also made in acquiring the data that underpins the model. Future efforts will focus on enhancing the depth and breadth of the data supporting the model calculations. Effort will be put into refining the healthcare system metrics to support improved decision-making. In addition, we will expand the model to multiple counties, and additional agent-based interactions will be included.
Future iterations will also allow the populations directly affected to directly communicate with other agents for low-level medical and emergency response needs during the event. The agent's behavior before the event will be modeled in a system dynamics manner with factors such as trust in governmental agencies, experience with the event, and level of community bonds. For instance, agents in areas with high levels of organizational trust will respond in more risk averse manners based on the level of advance warning allowing for reductions in the affected populations. The populations in areas with stronger community bonds will have higher probabilities of being able to have their emergency and medical needs met by other associated agents.
As part of this project, we developed a conceptual approach to include other natural hazard types without significant changes in the model structure. This will be considered as a near-term next step. Lastly, we are exploring new applications examining the long-term impacts of natural hazards on rural healthcare systems, expanding beyond our existing focus on immediate outcomes.
References
-
Ramos, A. L., Ferreira, J. V., & Barceló, J. (2012). Model-Based Systems Engineering: An Emerging Approach for Modern Systems. IEEE Transactions on Systems, Man, and Cybernetics—Part C: Applications and Reviews, 42(1), 101-111. https://doi.org/10.1109/TSMCC.2011.2106495 ↩
-
Chaffee, M. W., & McNeill, M. M. (2007). A model of nursing as a complex adaptive system. Nursing Outlook, 55(5), 232-241. https://doi.org/10.1016/j.outlook.2007.04.003 ↩
-
Homer, J. B., & Hirsch, G. B. (2006). System dynamics modeling for public health: background and opportunities. American Journal of Public Health, 96(3), 452-458. https://doi.org/10.2105/AJPH.2005.062059 ↩
-
Moore, T. W., Finley, P. D., Linebarger, J. M., Beyeler, W. E., Davey, V. J., & Glass, R. J. (2011, June 26-July 1). Public Health Care as a Complex Adaptive System of Systems [Conference presentation]. Eighth International Conference on Complex Systems, Quincy, MA. ↩
-
Coetzee, C., Van Niekerk, D., & Raju, E. (2016). Disaster resilience and complex adaptive systems theory. Disaster Prevention and Management, 25(2), 196-211. https://doi.org/10.1108/dpm-07-2015-0153 ↩
-
Kapucu, N. (2009). Interorganizational Coordination in Complex Environments of Disasters: The Evolution of Intergovernmental Disaster Response Systems. Journal of Homeland Security and Emergency Management, 6(1), 47. https://doi.org/10.2202/1547-7355.1498 ↩
-
Auf der Heide, E., & Scanlon, J. (2007). The role of the health sector in planning and response. In W. L. Waugh, Jr. & K. Tierney (Eds.), Emergency Management Principles and Practice for Local Government (2nd ed., pp. 183-206). ICMA Press. http://bookstore.icma.org/NEW_P1766.cfm ↩
-
Office of Rural Health Policy. (2002). Rural Communities and Emergency Preparedness. Health Resources and Services Administration U.S. Department of Health and Human Services. https://www.ruralhealthinfo.org/assets/198-319/rural-communities-and-emergency-preparedness.pdf ↩
-
Schur, C. (2004). Understanding the Role of the Rural Hospital Emergency Department in Responding to Bioterrorist Attacks and Other Emergencies: A Review of the Literature and Guide to the Issues. Walsh Center for Rural Health Analysis. University of Chicago. https://www.norc.org/content/dam/norc-org/pdfs/WalshCtr2004_LitRev_final.pdf ↩
-
Centers for Disease Control and Prevention. (n.d.-a). At A Glance: CDC/ATSDR Social Vulnerability Index. Retrieved May 25, 2023, from https://www.atsdr.cdc.gov/placeandhealth/svi/at-a-glance_svi.html ↩
-
Rural Health Information Hub. (n.d.-a). Chronic Disease in Rural America. Retrieved May 25, 2023, from https://www.ruralhealthinfo.org/topics/chronic-disease ↩
-
Tate, E., Rahman, M. A., Emrich, C. T., & Sampson, C. C. (2021). Flood exposure and social vulnerability in the United States. Natural Hazards, 106(1), 435-457. https://doi.org/10.1007/s11069-020-04470-2 ↩
-
Wilson, B., Tate, E., & Emrich, C. T. (2021). Flood recovery outcomes and disaster assistance barriers for vulnerable populations. Frontiers in Water, 3, 1-15. ↩
-
Dobis, E. A., Krumel, T. P., Jr., Cromartie, J., Conley, K. L., Sanders, A., & Ortiz, R. (2021). Rural America at a Glance. Economic Information Bulletin Number 230. Economic Research Service. U.S. Department of Agriculture.https://www.ers.usda.gov/webdocs/publications/102576/eib-230.pdf ↩
-
Marre, A. (2020, First Quarter). Rural Population Loss and Strategies for Recovery. District Digest. Federal Reserve Bank of Richmond. https://www.richmondfed.org/publications/research/econ_focus/2020/q1/district_digest ↩
-
Chartis Center for Rural Health. (2020). Rural Hospital Vulnerability. https://www.ivantageindex.com/wpcontent/uploads/2020/02/CCRH_Vulnerability-Research_FiNAL-02.14.20.pdf ↩
-
Cross, S. H., Califf, R. M., & Warraich, H. J. (2021). Rural-Urban Disparity in Mortality in the US From 1999 to 2019. Journal of American Medical Association, 325(22), 2312-2314. https://doi.org/10.1001/jama.2021.5334 ↩
-
Rural Health Information Hub. (n.d.-b). Rural Health Disparities. Retrieved March 30, 2023, from https://www.ruralhealthinfo.org/topics/rural-health-disparities ↩
-
Gujral, K., & Basu, A. (2019). Impact of Rural and Urban Hospital Closures on Inpatient Mortality. NBER Working Paper Series. National Bureau of Economic Research. https://www.nber.org/system/files/working_papers/w26182/w26182.pdf ↩
-
U.S. Department of Health & Human Services. (n.d.-a). Social Determinants of Health. Office of Disease Prevention and Health Promotion. Retrieved March 30, 2023, from https://health.gov/healthypeople/objectives-and-data/social-determinants-health ↩
-
Economic Research Service. (2022a, May 10). Labor force participation decreased less in rural areas than in urban areas at the onset of COVID-19 pandemic. U.S. Department of Agriculture. https://www.ers.usda.gov/data-products/chart-gallery/gallery/chart-detail/?chartId=103862 ↩
-
Economic Research Service. (2022b, November 29). Rural Poverty and Well-Being. U.S. Department of Agriculture. https://www.ers.usda.gov/topics/rural-economy-population/rural-poverty-well-being/ ↩
-
Ritchie, H., Rosado, P., & Roser, M. (2022). Natural Disasters. Our World In Data. https://ourworldindata.org/natural-disasters ↩
-
Centers for Disease Control and Prevention. (n.d.-b). CDC/ATSDR SVI Frequently Asked Questions (FAQ). Centers for Disease Control and Prevention/Agency for Toxic Substances and Disease Registry. Retrieved 03/30/2023 from https://www.atsdr.cdc.gov/placeandhealth/svi/faq_svi.html ↩
-
Jessee, N. (2020). Community Resettlement in Louisiana: Learning from Histories of Horror and Hope. In S. Laska (Ed.), Louisiana's Response to Extreme Weather: A Coastal State's Adaptation Challenges and Successes (pp. 147-184). Springer. https://link.springer.com/chapter/10.1007/978-3-030-27205-0_6 ↩
-
World Meteorological Organization. (2021). WMO Atlas of Mortality and Economic Losses from Weather, Climate, and Water Extremes: 1970-2019. https://library.wmo.int/doc_num.php?explnum_id=10989 ↩
-
Jerolleman, A. (2020). Challenges of post-disaster recovery in rural areas. In S. Laska (Ed.), Louisiana's Response to Extreme Weather Events: A Coastal State's Adaptation Challenges and Success (pp. 285-310). Springer. https://link.springer.com/chapter/10.1007/978-3-030-27205-0_11 ↩
-
Auf der Heide, E. (2006). The importance of evidence-based disaster planning. Annals of Emergency Medicine, 47(1), 34-49. https://doi.org/10.1016/j.annemergmed.2005.05.009 ↩
-
Centers for Medicare & Medicaid Services. (n.d.). Emergency Preparedness Rule. Retrieved March 30, 2023, from https://www.cms.gov/Medicare/Provider-Enrollment-and-Certification/SurveyCertEmergPrep/Emergency-Prep-Rule ↩
-
Hoard, M., Homer, J., Manley, W., Furbee, P., Haque, A., & Helmkamp, J. (2005). Systems modeling in support of evidence-based disaster planning for rural areas. International Journal of Hygiene and Environmental Health, 208(1), 117-125. https://doi.org/10.1016/j.ijheh.2005.01.011 ↩
-
Kaplan, G., Bo-Linn, G., Carayon, P., Pronovost, P., Rouse, W., Reid, P., & Saunders, R. (2013). Bringing a Systems Approach to Health. Discussion Paper. National Academy of Medicine. https://nam.edu/perspectives-2013-bringing-a-systems-approach-to-health/ ↩
-
Mostafavi, A., & Ganapati, N. E. (2019). Toward Convergence Disaster Research: Building Integrative Theories Using Simulation. Risk Analysis, 41(7). https://doi.org/10.1111/risa.13303 ↩
-
Mustafee, N., Powell, J., Brailsford, S. C., Diallo, S., Padilla, J., & Tolk, A.(2015, December 6-9). Hybrid simulation studies and hybrid simulation systems: definitions, challenges, and benefits [Conference presentation]. Winter Simulation Conference, Huntington Beach, CA. ↩
-
Mishra, D., Kumar, S., & Hassini, E. (2019). Current trends in disaster management simulation modelling research. Annals of Operations Research, 283(1-2), 1387-1411. https://doi.org/10.1007/s10479-018-2985-x ↩
-
Berg, T. A., Marino, K. N., & Kintziger, K. W. (2023). The Application of Model-Based Systems Engineering to Rural Healthcare System Disaster Planning: A Scoping Review. International Journal of Disaster Risk Science, 14, 357–368. https://doi.org/10.1007/s13753-023-00492-z ↩
-
World Health Organization. (2010). Monitoring the Building Blocks of Health Systems: A Handbook of Indicators and Their Measurement Strategies. https://apps.who.int/iris/bitstream/handle/10665/258734/9789241564052-eng.pdf ↩
-
U.S. Department of Health & Human Services. (n.d.-b). Social Drivers of Health. Retrieved May 25, 2023, from https://aspe.hhs.gov/topics/health-health-care/social-drivers-health ↩
-
Centre for Research on the Epidemiology of Disasters. (2020). The EM-DAT Atlas. Centre for Research on the Epidemiology of Disasters. https://www.emdat.be/emdat_atlas/index.html#one ↩
-
Wing, O. E. J., Bates, P. D., Smith, A. M., Sampson, C. C., Johnson, K. A., Fargione, J., & Morefield, P. (2018). Estimates of present and future flood risk in the conterminous United States. Environmental Research Letters, 13(3), 034023. https://doi.org/10.1088/1748-9326/aaac65 ↩
-
Health Resources & Services Administration. (n.d.). Defining Rural Population. Health Resources & Services Administration. Retrieved March 30, 2023, from https://www.hrsa.gov/rural-health/about-us/what-is-rural ↩
-
Cecil G. Sheps Center for Health Services Research. (n.d.). Rural Hospital Closures. University of North Carolina. Retrieved March 30, 2023, from https://www.shepscenter.unc.edu/programs-projects/rural-health/rural-hospital-closures/ ↩
-
Bell, J. E., Lookadoo, R., Wheeler, S., & Dethlefs, C. (2020). Case Study–The 2019 Floods in the Central U.S. Lessons for Improving Health, Health Equity, and Resiliency. 2020 Lancet Countdown on Health and Climate Change Policy Brief for the United States of America. https://www.lancetcountdownus.org/2020-case-study-2/ ↩
-
Nebraska Department of Natural Resources. (2023, May 17). Nebraska Flooding: March 2019. https://storymaps.arcgis.com/stories/9ce70c78f5a44813a326d20035cab95a ↩
-
Goodman, M. S., & Sanders Thompson, V. L. (2017). The science of stakeholder engagement in research: classification, implementation, and evaluation. Translational Behavioral Medicine, 7(3), 486-491. https://doi.org/10.1007/s13142-017-0495-z ↩
-
Ding, Z., Gong, W., Li, S., & Wu, Z. (2018). System Dynamics versus Agent-Based Modeling: A Review of Complexity Simulation in Construction Waste Management. Sustainability, 10(7), 2484. https://doi.org/10.3390/su10072484 ↩
-
Sumari, S., Ibrahim, R. B., Zakaria, N. H., & Hamid, A. H. A. (2013). Comparing Three Simulation Model Using Taxonomy: System Dynamic Simulation, Discrete Event Simulation and Agent Based Simulation. International Journal of Management Excellence, 1, 54-59. ↩
-
Krogh, A. H., & Lo, C. (2023). Robust emergency management: The role of institutional trust in organized volunteers. Public Administration, 101(1), 142-157. https://doi.org/https://doi.org/10.1111/padm.12894 ↩
-
Berg, T., Kintziger, K. W., Crumly, J., Lawson, S., Myers, C., & Stansberry, T. (2023). Development of a proof-of-concept multi-method computer simulation to support disaster planning [Manuscript submitted for publication]. University of Tennessee, Knoxville. ↩
-
Maglio, P. P., Sepulveda, M. J., & Mabry, P. L. (2014). Mainstreaming modeling and simulation to accelerate public health innovation. American Journal of Public Health, 104(7), 1181-1186. https://doi.org/10.2105/ajph.2014.301873 ↩
-
Links, J. M., Schwartz, B. S., Lin, S., Kanarek, N., Mitrani-Reiser, J., Sell, T. K., Watson, C. R., Ward, D., Slemp, C., Burhans, R., Gill, K., Igusa, T., Zhao, X., Aguirre, B., Trainor, J., Nigg, J., Inglesby, T., Carbone, E., & Kendra, J. M. (2018). COPEWELL: A Conceptual Framework and System Dynamics Model for Predicting Community Functioning and Resilience After Disasters. Disaster Medicine and Public Health Preparedness, 12(1), 127-137. https://doi.org/10.1017/dmp.2017.39 ↩
-
Administration for Strategic Preparedness & Response. (n.d.). ASPR Health Care Readiness Programs Portfolio. U.S. Department of Health and Human Services. https://aspr.hhs.gov/_catalogs/masterpage/ASPR/Documents ↩
Kintziger, K., Berg, T, Stansberry, T., Lawson, S, Jones, G., & Tran, L. 2023. Public Health Computer Simulation Tool to Support Disaster Preparedness in Rural Communities (Natural Hazards Center Public Health Disaster Research Report Series, Report 27). Natural Hazards Center, University of Colorado Boulder. https://hazards.colorado.edu/public-health-disaster-research/public-health-computer-simulation-tool-to-support-disaster-preparedness-in-rural-communities