Exploring Post-Disaster Transportation Barriers to Health Care for Socially Vulnerable Puerto Rican Communities
Publication Date: 2022
Executive Summary
Overview
This research explores transportation barriers to healthcare facilities and services and how these affected socially vulnerable communities in Puerto Rico following a disaster. The study employed a statistical analysis of publicly available data complemented by the findings gathered from interviews with stakeholders and focus groups with members of the community. We identified key transportation and health care access variables that impact social vulnerability. Altogether, this research provides public health and policy recommendations that help address the urgent medical and healthcare needs in post-disaster environments.
Research Questions
We explored two primary research questions:
- What transportation barriers prevented residents in socially vulnerable communities from accessing timely health care in the aftermath of Hurricanes Irma and Maria?
- How can public agencies, service providers, and community members address the post-disaster transportation barriers to healthcare?
Research Design
We employed a mixed-methods approach divided into two main components. First, we used the Centers for Disease Control and Prevention Social Vulnerability Index1 and conducted a multivariate regression analysis to understand the transportation variables that influence socially vulnerable groups. Second, we collected data through 17 in-depth interviews with key stakeholders (e.g., emergency responders, ambulance drivers, doctors, hospital staff, private companies, health insurance brokers, and non-profit organizations) and four focus groups composed of 18 participants from different communities (Caguas, Naguabo, Toa Baja, Rio Piedras, Humacao, and Luquillo). This fieldwork aimed to identify the challenges related to transportation access for the most vulnerable groups after a catastrophic event (i.e., 2017 Hurricanes Irma and Maria). Altogether, we were able to triangulate our findings and understand the current transportation vulnerabilities that affect healthcare access in Puerto Rico.
Findings
Through the preliminary findings from the regression analysis, we were able to identify transportation access variables associated with social vulnerability. Counties with less access to roads were more likely to have a higher vulnerability. Having greater lengths of streams or rivers, which depict flood-prone areas, was also associated with increased social vulnerability. The proximity to critical medical facilities, like the distance to the only trauma center on the island, Centro Medico, was positively correlated with the census variables that influenced social vulnerability.
The in-depth interviews with representatives within the healthcare system or emergency response helped us understand the inherent challenges in providing healthcare access to communities after a disaster and the strategies that could be implemented. Our focus group discussions with community members provided the study with valuable strategies that the communities are undergoing to improve their healthcare access. Also, the participants discussed the approach that they consider most relevant in terms of transportation access after a hurricane.
By understanding the transportation-related factors that correlate with social vulnerability and identifying the transportation barriers experienced by residents after Hurricane Maria, this study identified a set of recommendations and public health implications that could help communities in Puerto Rico have better access to health care after a disaster.
Public Health Implications
This study has several public health implications. Our preliminary findings improve our understanding of the transportation-related variables that influence social vulnerability and the identification of vulnerable groups. Such information can help evaluate disaster-related health policies that ensure the well-being of these communities. In addition, the Social Vulnerability Index can be used by local governments, emergency management, clinicians, public health practitioners, and other relevant parties to inform decision-making. Updating the Social Vulnerability Index to include more transportation access variables can help practitioners identify vulnerable communities.
Furthermore, health policies and strategies can help resolve the issues that Puerto Rican communities currently face regarding their healthcare access. The specific strategies identified in this research include: (a) identifying vulnerable populations demonstrated by our quantitative study findings, (b) have a centralized database that includes public health statistics for Puerto Rico that help to accurately estimate health indices of vulnerable counties, and (c) prepare medical teams to visit communities that experience transportation barriers to health facilities.
From our research findings, we have developed a set of policy recommendations that can help improve transportation access to the most vulnerable populations in preparation and response to a hurricane-related emergency. Some of these strategies at the government level include having the transportation sector coordinate with disaster responders to prioritize road clearance for the most vulnerable communities. In addition, having alternative modes of transportation in place in designated areas can improve healthcare access in the aftermath of a disaster. This includes having open spaces as heliports to receive helicopter ambulances. Other important strategies include having a census of the population’s health conditions and mapping flood-prone areas, access routes after an emergency, and shelters in place. In preparation for isolation, community members could also be trained in first response activities, such as cardiopulmonary resuscitation, to address immediate healthcare needs.
Introduction
Every year during hurricane season, Puerto Rico is at risk of another catastrophic event. The low-lying geography and hydrological landscape of Puerto Rico make it highly vulnerable to hurricanes. These vulnerabilities have worsened as climate change contributes to coastal erosion, rising sea levels, and frequent and intense storms (The Stormwater Report, 20212). In 2017, the island experienced the deadliest disaster in the United States in 100 years when Hurricane Maria, a Category 5 storm, slammed into its shores. The latest study estimated that 4,600 lost their lives, and approximately two-thirds of these deaths were attributed to delays or interrupted access to medical care (Kishore et al., 20183). That was primarily because the hurricane “caused lasting interruptions to essential services and severe damage to housing and infrastructure” (Mitigation Assessment Team [MAT], p. 1-114).
Hurricane Maria posed serious transportation barriers to health care that cost thousands of lives. For the most remote communities, 17% of households did not have healthcare access because of road damage, 12% experienced closed health facilities, and five percent had no means of transport. Regarding specific health needs in these remote communities, 17% reported no access to medications, 12% said their respiratory machines failed, and 0.7% needed dialysis (Kishore et al., 2018). For more than a year, dialysis patients from Vieques had to travel to the main island three times a week to get their treatment (Mazzei, 20195). Five out of fifteen dialysis patients who flew from Vieques to Puerto Rico’s capital, San Juan, during the first months after the hurricane died before they were ever treated (Coto, 20186). Like the Vieques cases, multiple chronic diseases were the cause of the excess deaths after Hurricane Maria. Cruz-Cano and Mead (2017)7 identified 253 dead from heart disease (21%), 195 from diabetes (16%), 122 from Alzheimer’s disease (10%), and 81 from septicemia (6.7%).
Puerto Rico’s challenging transportation system further limits access to health care. As depicted in Figure 1, Puerto Rico has only two main highways; these highways are also the principal links to the only trauma center on the island, which is located in San Juan and commonly referred to as Centro Medico. In normal conditions, these highways remain congested during peak hours. Branching out from these highways are multiple state roads, city streets, and other roads that transverse the island. Residents in communities like Buenos Aires, Caguas, located in the southeastern part of the island, take 45 minutes to drive up mountainous terrain from the main highway. These communities have difficult access to medical services because they live in remote locations, far from state roads.
Figure 1. Puerto Rico Transportation Network
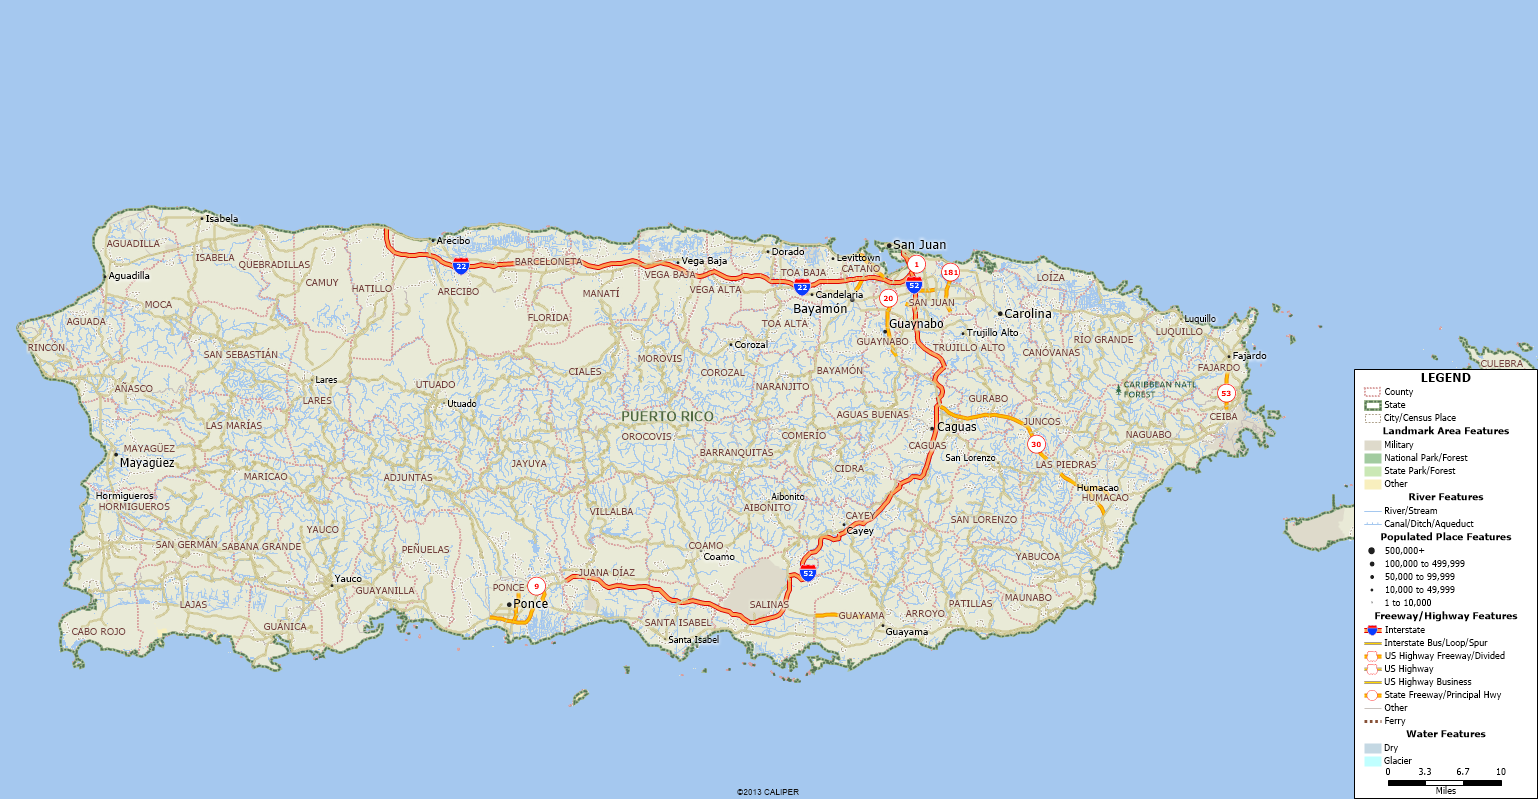
Note. Map of Puerto Rico produced by the authors using TransCAD Software (Caliper, 20228).
A month after Maria, less than eight percent of roads in Puerto Rico were open and functional (Martinez-Sanchez, 20189). According to the Federal Emergency Management Agency (FEMA), response teams only opened 392 miles out of 5,073 miles of roads after 12 weeks of the hurricane (Chapell, 201710). Niles and Contreras (2019)11, who interviewed healthcare workers across Puerto Rico one year after Hurricane Maria, indicated “that barriers such as lack of transportation to clinics and economic constraints contributed to difficulties accessing medication” (Poverty and Health Inequality section, para. 6). In addition to the transportation issue, the lack of appropriate infrastructure and medical resources to support local and basic healthcare needs is likely to be affected by a disaster. After Hurricane Maria, the Mitigation Assessment Team reported that “hospitals in Puerto Rico experienced high levels of roof membrane failures, building envelope failures, wind-driven water intrusion, rooftop equipment damage, and wind-borne debris failure. Much of this affected the usage of space and systems, prompting temporary closures and operational workarounds” (MAT, p. 5-3). Other issues included water scarcity, isolation of some residents with no means of transportation, slow distribution of aid, and lack of communication, causing the healthcare system to collapse (Zorrilla, 201712). This, combined with a flawed health system decaying over time because of the limited access to federal funds, compounded the situation. When compared to the poorest U.S. State (Mississippi)—which is reimbursed for 83% of their total health expenses (Portela & Sommers, 201513)—Puerto Ricans will not get more than 50% in federal fund matching because of their condition as a U.S. Territory even though the regional poverty rate in Puerto Rico is double the rate in Mississippi (Behling-Hess, 202114).
When it comes to a disaster or catastrophic event, the socially vulnerable are the most at risk. Social vulnerability refers to the “characteristics of a person or group and their situation that influence their capacity to anticipate, cope with, resist and recover from the impact of a natural hazard” (Wisner et al., 1994, p. 1115). For instance, during the immediate response after a disaster occurs, these individuals “are least likely to have access to emergency services” (Centers for Disease Control and Prevention [CDC], 201516, p. 4). Combined with a vulnerable transportation network, the chances of getting primary health care after a disaster drastically diminishes. Therefore, identifying the transportation-related vulnerabilities within communities is essential to meeting their healthcare needs in disaster contexts.
This research employed a mixed-method approach to study the transportation barriers to health care in Puerto Rico after a disaster. Through a quantitative analysis of publicly available data, this study sought to understand how the lack of access to transportation and healthcare compounds social vulnerability in Puerto Rico. In addition, fieldwork data collected from in-depth interviews with key stakeholders and focus groups with members of the community enabled the research team to propose potential public health strategies that tackle the most urgent needs of socially vulnerable groups in response to a disaster. Through this research, we seek to provide recommendations to public health officials, private health organizations, transportation agencies, and emergency response agencies to better meet the healthcare needs of communities in Puerto Rico and improve their overall health and wellbeing.
Literature Review
A person’s access to health care does not just depend on adequate supply. Instead, as Gulliford et al. (2002)17 outlined, it consists of affordability, physical accessibility, and acceptability of services. Prior research has studied the physical access of socio-economically disadvantaged populations (Dixon-Woods, et al., 200618; Field & Briggs, 200119; Littenberg, et al., 200620; Nicholl, et al., 200721; Shipman, et al., 200122). Like Nicholl et al.’s (2007) observational study with English ambulance services, empirical studies have found that a poor transportation network (i.e., increased distance to the hospital) is associated with higher mortality rates after an emergency.
Research on transportation networks—the physical infrastructure that provides a means of transportation (road networks, railways, air routes, pipelines, aqueducts, and power grids)—has been linked to vulnerability and resilience. On the one hand, the network’s vulnerability is the physical, economic, and social susceptibility of the community to be affected by its disruption (Cardona, 200123) or the degree to which a system is susceptible to harm (Seeliger & Turok, 201324). For example, a link disruption suddenly triggers a change to the entire road network’s performance, affecting the community’s transportation access (Modica & Regani, 201425). Studies have frequently used indicators to assess the transportation network’s vulnerability. These typically consider the network’s logistic operation and topological characteristics, such as traffic flows, distance, and travel time (Cantillo, et al., 201826).
On the other hand, resilience relates to the capacity of a system to return to its original state or continue to serve after being impacted by a disruption (Berdica, 200227; Darayi et al. 201728; Lee et al., 201429; Rodriguez-Nunez & Garcia-Palomares, 201430; Schreiner, 201331). Most studies investigate resilience empirically, using various methods and indicators. Indicators fall within six main categories: socio-economic characteristics, institutional capacity, infrastructure, community capacity, innovation and technology, and the natural environment (Modica & Regani, 2014). Most of the research on transportation resilience has focused on the disruption of network segments rather than the failure of multiple systems (Murray-Tuite, 200932). Amdal and Swigart (2010)33 considered both community and transportation resilience and its connection with evacuation planning after Hurricane Katrina in 2005.
When assessing a community’s resilience to natural hazards and extreme events, a term commonly used is social vulnerability. Kelly and Adger (2000)34 argued the concept of vulnerability provides “a policy-relevant framework within which the value of specific interventions aimed at improving the capacity of people to respond to stress can be judged” (p. 327). Domingue and Emrich (2019)35 explained that vulnerable communities are usually located in high-risk areas, where unequal allocation of resources most likely exacerbates their vulnerability. There are two main subcategories within social vulnerability: SeVi and BeVi. The SeVi or “Socioeconomic Vulnerability Index” category includes variables such ethnicity, economic status, customs, and infrastructure (Cutter & Emrich, 200636; Fothergill & Peek, 200437; Morrow, 199938; Reid, 201339; Fordham et al., 201340). The Bevi or “Built Environmental Index” is based on the environment of the location. The Bevi factors include variables such as distances to hospitals and population density (Singh et al., 201441). According to Steven Kroll-Smith (2018)42, another facet of social vulnerability is how historically an area has recovered from past disasters.
Humanitarian aid and public health have made progress in tracing the most vulnerable populations in the different hazard events. Singh et al. (2014) explained that using a social vulnerability index is one of the ways to get a closer look into which areas need more help in any given situation. The Centers for Disease Control and Prevention’s (CDC) Social Vulnerability Index (SVI), which uses U.S. Census Bureau databases, is employed by disaster responders and other public agencies to inform their decisions. Following Cutter et al.’s (2003)43 inductive approach to SVI, Eroglu and others developed an index for counties in Puerto Rico and identified striking differences “stemming from demographics, geographies, and building conditions” after Hurricane Maria (Eroglu, et al., 2020, p. 39444).
Although not the opposite, resilience is often viewed as reducing vulnerability. A more resilient system consists of less vulnerable sub-systems (Pendall et al., 201245). A study of the impact of the 2017 Hurricanes Irma, Maria, and Harvey on supply chain resilience identified that most of Puerto Rico’s critical infrastructure was highly vulnerable, making it less resilient post-Maria. The study highlighted the Port of San Juan as essential for access to emergency response and goods delivery (National Academy of Sciences, Engineering, & Medicine, 202046). Using five resilience components, another study evaluated Hurricane Maria’s effect on Puerto Rico’s health system. The study identified the lack of capacity of backup generators, the self-regulation challenges when triaging the provision of Hurricane-related emergency services, and the integration of patient care coordination between hospitals and state government as components of resilience (Rios et al., 202147). A study on health care in Puerto Rico highlighted that the increasing age of the population, environmental hazards, and lack of funding created a complex environment for healthcare access (Chandra et al., 202148). Another study’s findings reported that 11% of health centers closed, with many not reopening due to damages by Hurricane Maria (Michaud, 201749). To the best of our knowledge, previous studies have not explored social vulnerability concerning the transportation infrastructure flaws nor the accessibility aspects that hinder a community’s ability to provide immediate medical attention to its residents. This research aimed to fill this gap.
Research Questions
This research intended to capture the transportation-related challenges that impeded healthcare access after a disaster and the potential strategies to improve access among the most vulnerable populations. Our study focused on two main research questions:
- What transportation barriers prevented residents in socially vulnerable communities from accessing timely health care in the aftermath of Hurricanes Irma and Maria?
- How can public agencies, service providers, and community members address the post-disaster transportation barriers to health care?
Data and Methods
This study used a mixed-methods approach that included: (a) a quantitative analysis to understand the transportation variables that influence socially vulnerable groups and (b) a qualitative study to capture transportation-related challenges about healthcare access after a disaster and the potential strategies to improve access for the most vulnerable populations.
Quantitative Methods
This section uses multivariate and regression analysis to understand the transportation variables that influence socially vulnerable groups. We analyzed how these transportation variables correlated with the Social Vulnerability Index (SVI) for all counties in Puerto Rico.
Data Collection Procedures
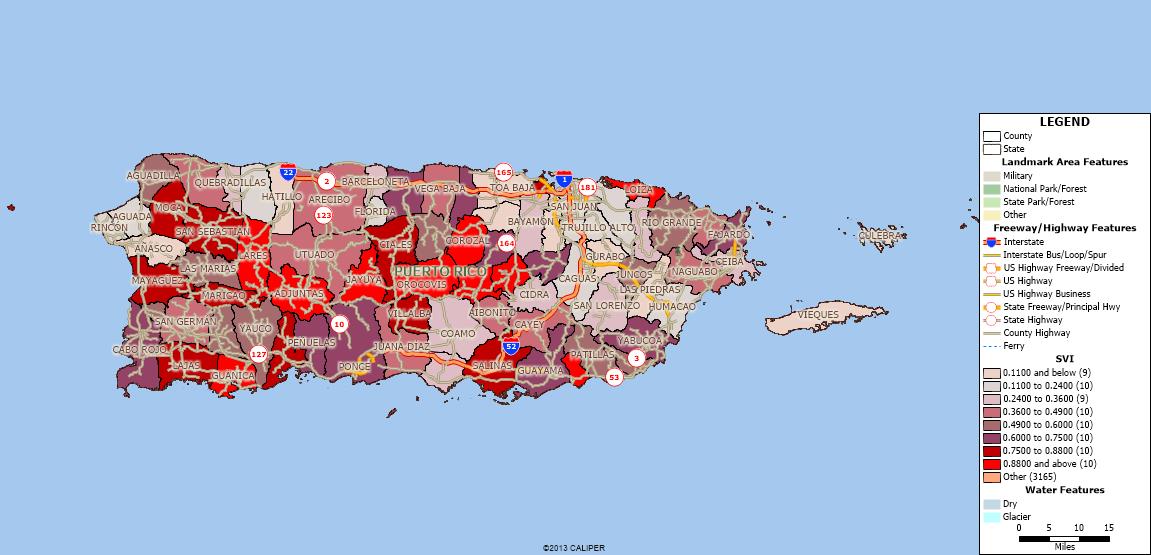
We analyzed publicly available data at the county level throughout Puerto Rico to establish correlations between physical access to health care. These data included CDC’s SVI (CDC, 2018), socioeconomic and demographic data from the U.S. Census Bureau (2021a)50, 2013-2019 healthcare data projections from Puerto Rico’s Department of Health (Alameda Lozada, 201351), other population health and socioeconomic data from the Puerto Rican Institute of Statistics, other national health datasets (i.e., Health Resources and Services Administration, 202252; Free Clinic Directory, 202253), transportation networks data from the Maptitude Geographical Information System datasets (Caliper, 2022), and the Spatial Hazard Events and Losses Database for the United States (Center for Emergency Management and Homeland Security, 202254). SVI is a percentile rank-based variable that uses 15 social factors within four themes: socioeconomic, household composition and disability, minority status and language, and housing type and transportation variables. Figure 2 shows the map of SVI for all counties in Puerto Rico. Counties with a bright red color are the most socially vulnerable or those with the highest SVI (SVI >0.88). Most of these counties are located in the center of the Island (e.g., Adjuntas, Jayuya, Orocovis, Corozal, Barranquillitas, Comerio). The least vulnerable counties (SVI < 0.11), with a lighter shading, are located around the San Juan metropolitan area (e.g., San Juan, Trujillo Alto, Carolina).
Figure 2. Puerto Rico’s Social Vulnerability Index by Counties
We constructed a dataset with variables such as distances from municipalities to critical facilities (hospitals, ports, police stations, fire stations, pharmacies, schools, parks, religious sites, etc.), network capacities (length of highways, roads, and rivers), medical workforce, health insurance coverage (i.e., Medicaid, State insurance, Children’s Health Insurance Program), average income, demographics, vehicles per household, poverty levels, and hurricane-based hazard impacts. We used geospatial analysis to identify missing data in existing datasets (e.g., medical centers and new hospitals or destroyed hospitals). Other variables that we considered critical to the study did not have any data available for the entire island. These included the number of ambulance drivers, ambulance services, and disaster emergency response teams within the different counties. We did not include the latter variables in the analysis.
Quantitative Data Analysis
Our database initially consisted of 52 variables. Through Principal Component Analysis (PCA), we reduced the candidate variables to 27. We reduced the number of variables analyzed while maintaining a sizeable explanatory power (98.5%). We made additional transformations for the remaining variables, expressing them as proportions per county (e.g., the proportion of the Hispanic population) and density variables (e.g., number of fire stations per area). Appendix A shows the list of variables with descriptive statistics (Table A1) and the heat map with the significant variables using PCA (Figure A1).
We analyzed the correlation of transportation variables with SVI using multiple linear regression. One model only included transportation network variables, a second model included household data variables, and a third model included all variables. We analyzed 18 different model combinations and selected the top three models with variables statistically significant at the five percent level. Table A2 in Appendix A shows the top linear regression models.
Qualitative Methods
Study Site Description
This portion of the study focused on socially vulnerable communities in Puerto Rico. Our discussion focused on hurricane hazards, specifically Hurricane Maria, at the forefront of our conversation. We selected locations from highly vulnerable counties that were severely impacted by Hurricane Maria for the focus group discussions. These counties were Caguas, Naguabo, Toa Baja, Rio Piedras, Humacao, and Luquillo.
Recruitment and Sample
The sampling method used for the in-depth interviews was purposeful sampling, where the team contacted and interviewed individuals with specific expertise or knowledge. We collected 17 in-depth interviews from people within the healthcare system or emergency response, including three doctors, two emergency responders, three hospital staff, one insurance broker, two private companies, two non-profit organizations, one architect, one journalist, and two community leaders.
We used a snowball sampling method for the focus group studies. The organizations in close contact with community leaders were primarily in charge of spreading the word. Four focus groups were conducted with three to five participants each, and each group represented a different region in Puerto Rico. Table 1 shows the number of the focus group participants and some demographic characteristics.
Table 1. Focus Group Locations and Participant Characteristics
| Participant Location | Number of Participants | Ratio of Men to Women | Age Range |
| Buenos Aires, Caguas | 5 | 2 : 3 | 39-61 |
| Rio Blanco, Naguabo | 5 | 1 : 4 | 22-64 |
| Toa Baja (Ingenio, Puebla) | 3 | 2 : 1 | 38-45 |
| Rio Piedras, Humacao, Luquillo | 5 | 0 : 5 | 33-61 |
Interview Procedures and Questions
The in-depth interviews sought to understand what roles key stakeholders played after disasters like Hurricane Maria and what were the main challenges that communities faced in accessing medical aid. We discussed the person’s role and organization, experience before and after Hurricane Maria, difficulties in transportation to healthcare facilities, and lessons learned from Hurricane Maria. The interviews were one hour long and followed a detailed script found in Appendix B1.
The purpose of these focus groups was to explore the diverse perspectives of healthcare access within the community in the context of a disaster. After discussing their experiences after Hurricanes Irma and Maria, and the health challenges that followed, the participants were presented with different transportation-related strategies to access health care in their community. We opened the discussion to new strategies that the community considered relevant in transportation access after these types of hazards. The focus groups lasted approximately two hours. Appendix B2 includes the detailed focus group script.
After designing our protocols (complete documentation of our methods and scripts), we requested authorization through Rensselaer Polytechnic Institute’s Institutional Research Board (IRB) in English and Spanish. Once protocols were approved, we contacted the potential interviewees and scheduled the in-depth interviews and focus groups. We traveled to Puerto Rico to establish initial contact with key stakeholders and communities but did not interview people directly on-site due to COVID-19 restrictions. We conducted the interviews via phone or video call. We included the IRB approval letters in Appendices B3 and B4.
Ethical Considerations, Researcher Positionality, Reciprocity, and Other Considerations
This research involved collecting data from interviews and focus group discussions with community members who voluntarily decided to participate in our study. We designed the protocols for in-depth interviews and focus groups, which IRB approved from December 6, 2021 through December 6, 2022. Data collected was shared among the research team following IRB guidelines. We ensured data was securely stored and de-identified following the participants’ decisions regarding their confidentiality from their verbal or written consent forms. Since our study focused on vulnerable communities, we selected participants from these communities. Calls for participation were made without distinguishing social status, income, gender, ethnicity, etc. Our study ensured that the participants’ time, budget, and other resources were used wisely. Our research’s outcomes do not harm the research participants or the public domain. Quite the contrary, the study promised to lead to practices that will benefit the health and wellbeing of communities in Puerto Rico. We engaged the community members to discuss their current challenges and solutions aligned with their cultural and social contexts.
Preliminary Findings
Quantitative Analysis
Table 2 shows the transportation and health-related variables that were statistically significant at the five percent level based on the linear regression model results found in Appendix A.
Table 2. Variables Significantly Correlated with Social Vulnerability Index
| Positive Correlation | Negative Correlation |
| • Length of streams • Distance to closest hospital • Distance to Centro Medico • Number of medical facilities • Proportion of households with no vehicles |
• Length of streets • Distance to closest college • Distance to closest school • Distance to closest religious site • Number of households with child health care • Proportion of households with two or more vehicles |
The variables identified in Table 2 are associated with SVI. The positively correlated variables are those whose higher values are associated with highly vulnerable counties. For instance, the positively correlated variable of the length of streams indicates that counties with higher social vulnerability most likely have more rivers/streams. The negatively correlated, like the length of streets, suggests that those counties with more roads are associated with a lower vulnerability. These findings were confirmed by focus group participants who voiced that some of their communities are surrounded by rivers that get flooded easily, blocking their roads and impeding access.
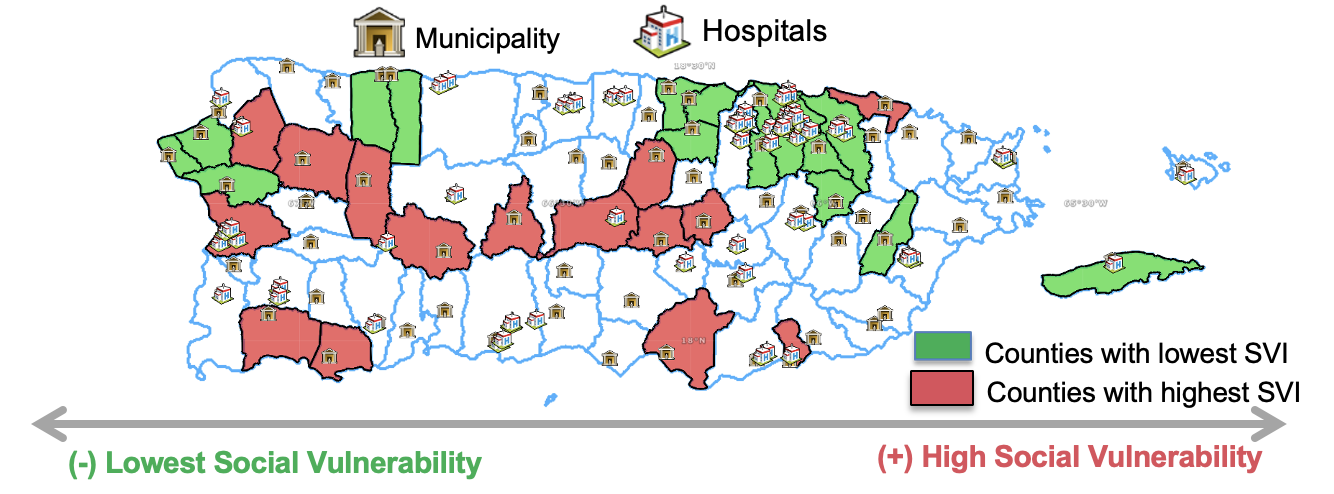
Distance to critical facilities is also correlated with social vulnerability. Distance to the closest hospital was positively correlated, implying that the highly vulnerable communities do not have rapid access to a health facility. The counties farther away from the only trauma center on the island, Centro Medico, were associated with a higher social vulnerability. The map of the main hospitals in Puerto Rico support these results, showing an uneven distribution of hospitals across the island, with fewer hospitals located near areas with higher social vulnerability.
Figure 3. Puerto Rican Counties With the Highest and Lowest Social Vulnerability Percentiles
Distance to other facilities like schools, colleges, and religious sites was negatively correlated with social vulnerability. This finding suggests that the most vulnerable communities have these facilities nearby and thus present promising policy implications. These facilities can quickly turn into shelters post-hurricane and serve to meet the community’s immediate needs.
Although this study analyzed county-level data in Puerto Rico, the findings could be generalized to other U.S. territories, where data on social vulnerability is publicly available, and conditions might be similar in terms of transportation access and healthcare capacities. Thus, the methodology applied could be transferable to other counties in the United States.
Qualitative Analysis: Transportation Challenges in Socially Vulnerable Communities
The focus group discussions on socially vulnerable communities helped us identify the inherent transportation challenges these communities face. They also helped us determine the factors that make them at risk and limit their access to health care.
The roads leading to the community of Buenos Aires, Caguas, are highly complex because of their mountainous terrain. Their altitudes allow them to directly view the second tallest elevation peak on the island (i.e., El Yunque). Unlike other communities, they do not flood because of their altitudes, yet they are subject to extreme winds that typically cause significant damage to their road network. One of the participants works in emergency management in their area, and she mentioned they do not get rescuers to clear the roads immediately.
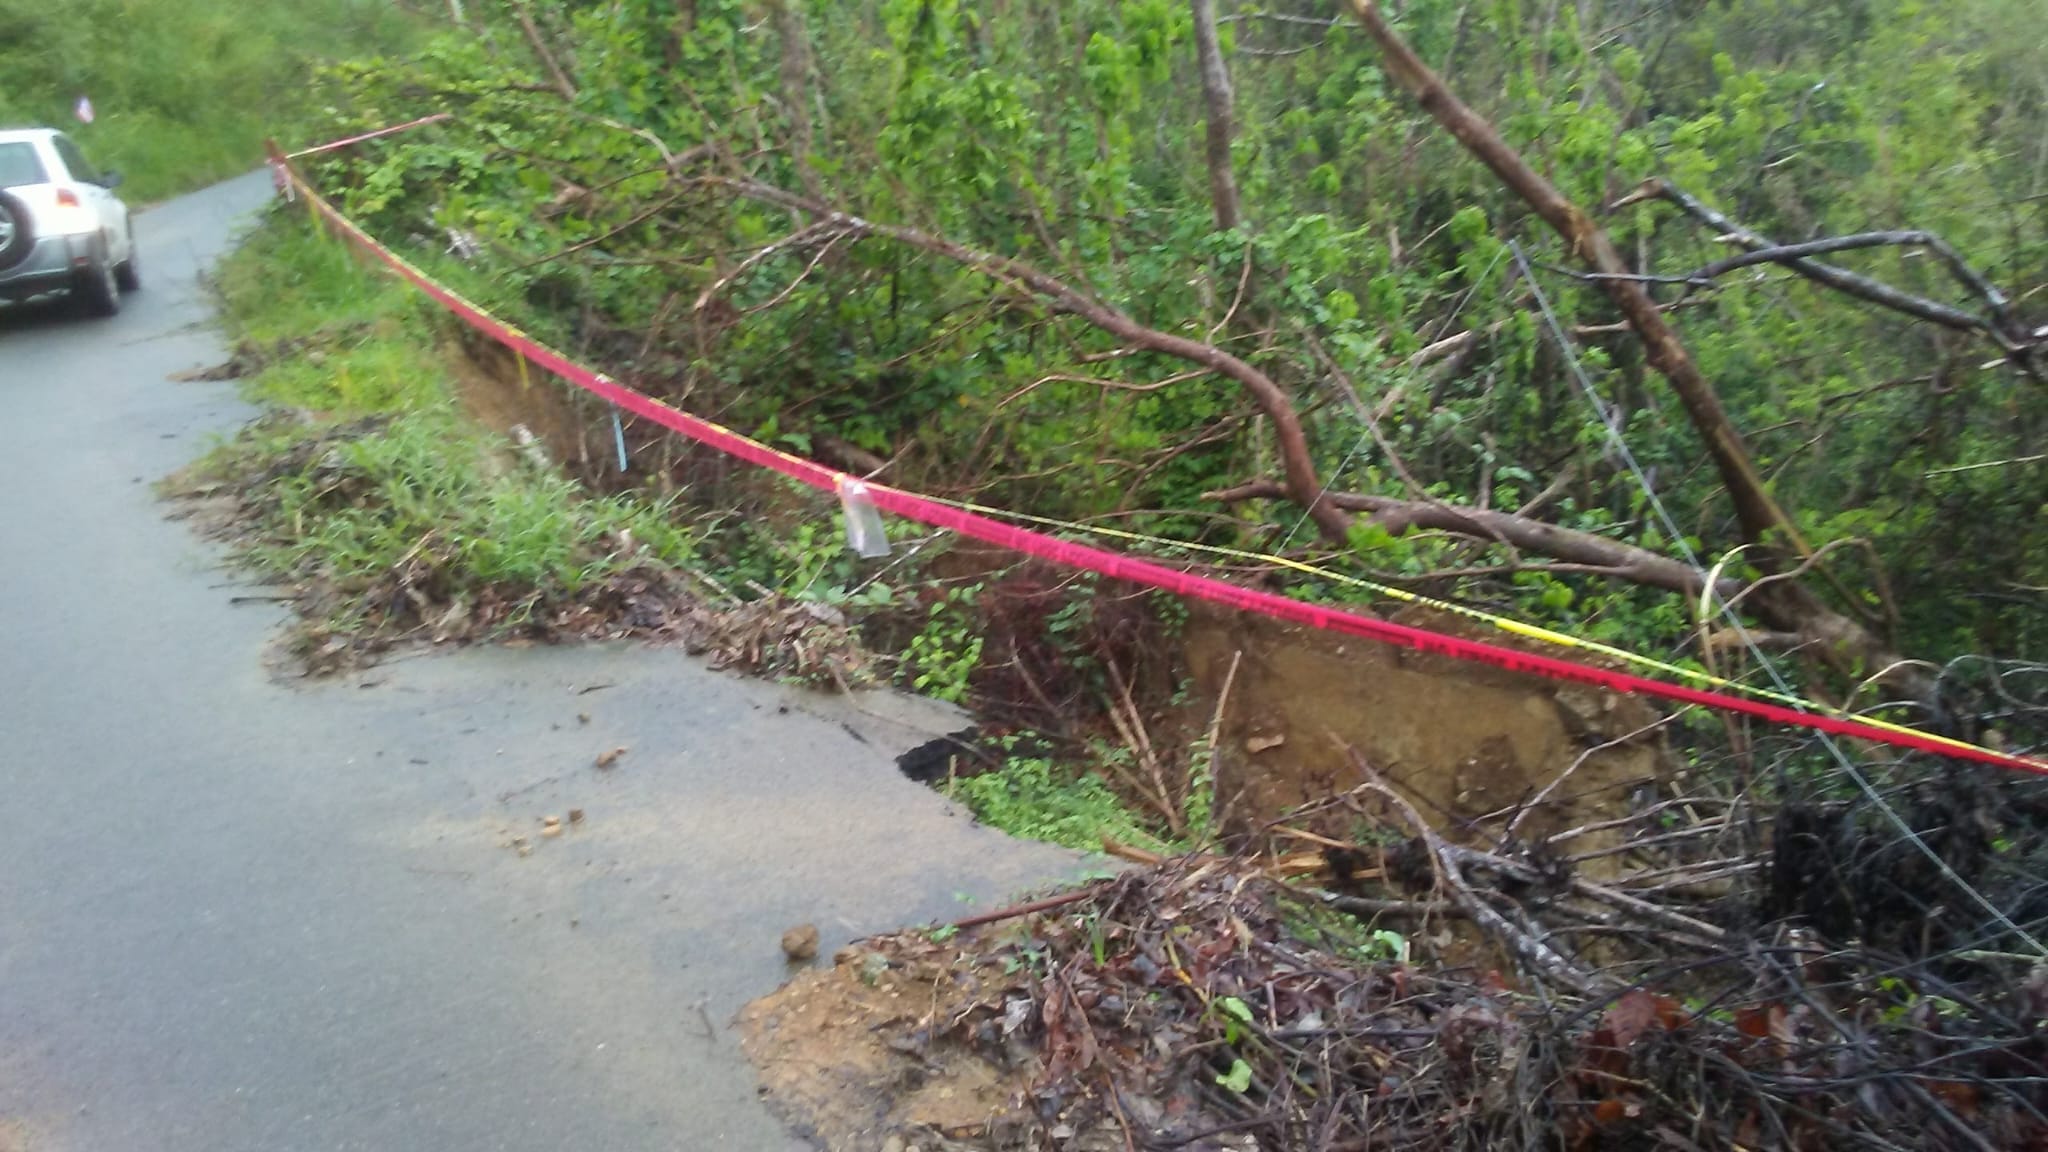
This happened after hurricanes Irma and Maria. Caguas was on the hurricane path; thus, they experienced both tornadoes and hurricane winds. Two community members presented severe health challenges during and after Hurricane Maria, one of the participants suffered a heart attack. He was able to get to the hospital and be stabilized. Since they were in mountainous areas, they did not suffer flooding, but they were isolated due to landslides and debris that damaged and blocked roads to the community, as depicted in this photo.
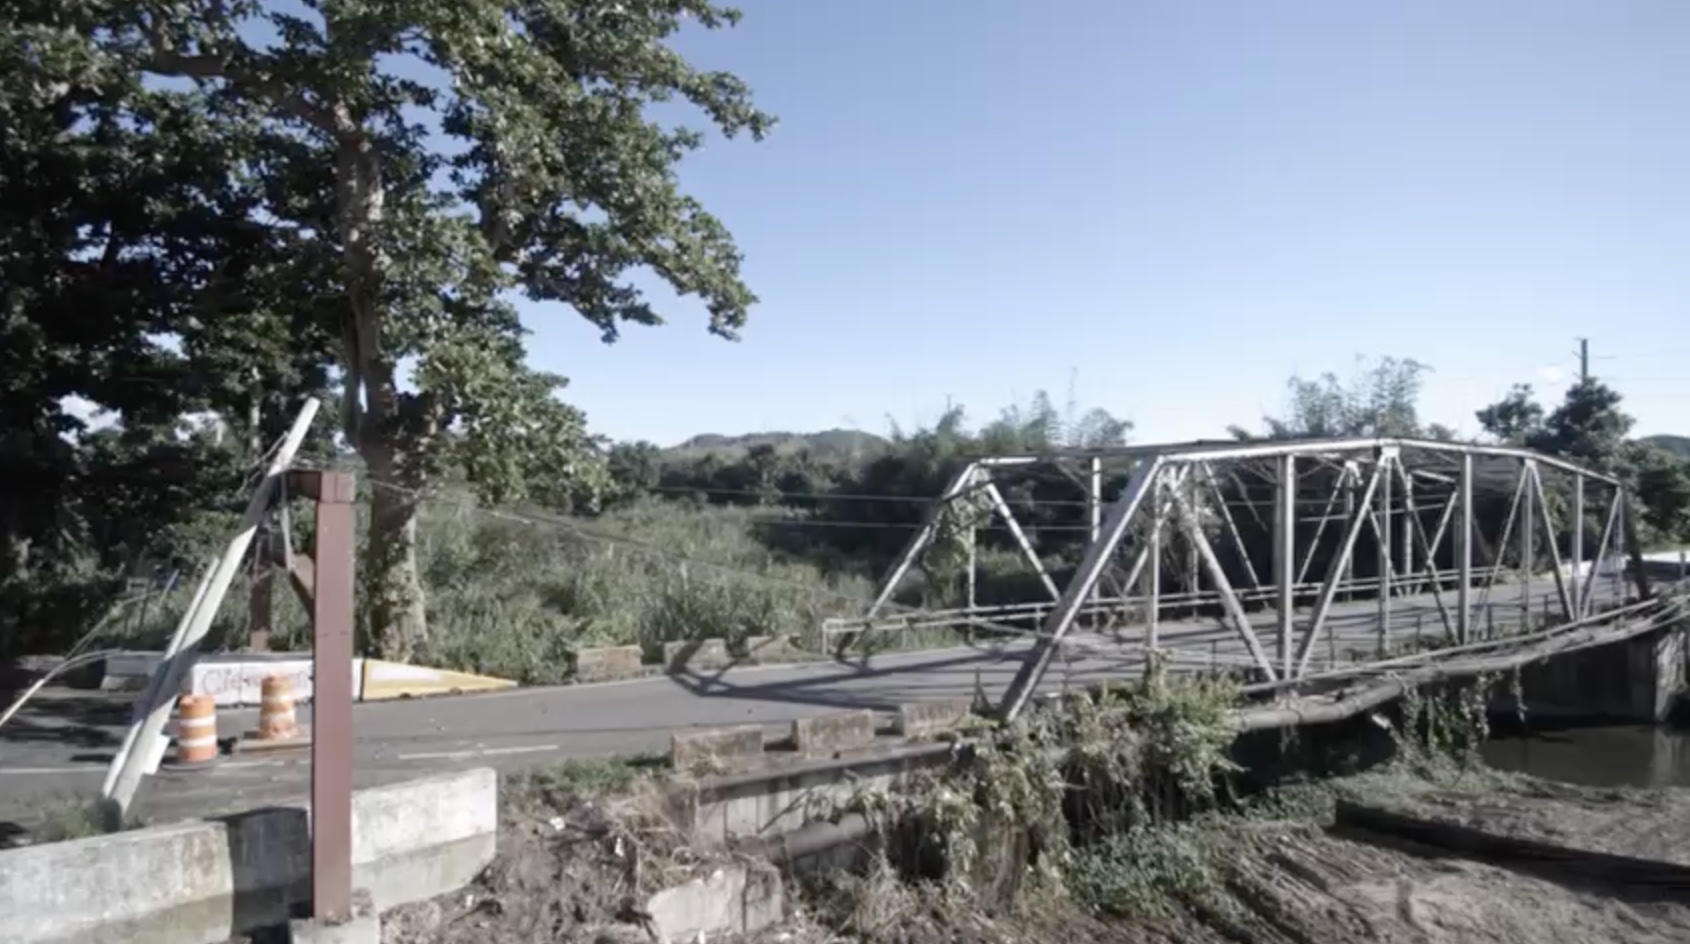
Located near Puerto Rico’s eastern coast, the community of Rio Blanco was hit hard by the hurricane winds of both Irma and Maria. Their community has one bridge (I94) that connects to the main highway. As shown in the photo below, Hurricane Maria partially destroyed this bridge, making it impassable. Without this bridge, the alternate route took three to four times longer to access in and out of their community. Participants also had close connections with Humacao, one of the first locations that got hit hard by the hurricanes. One additional participant was the leader of a neighboring community, Las Piedras. In her community, 22 people lost their lives due to heavy flooding, and many of them were actively involved in search and rescue.
Toa Baja is located in the northern part of the island and relatively close to the San Juan metropolitan area. Despite their location having multiple access routes, their primary challenge involves a river that crosses their region, which gets flooded after heavy rainfall and floods the surrounding areas. That means that the access roads to the main highway get flooded, leaving many communities stranded. After Hurricane Maria, they were left isolated because the roads were inundated for several weeks.
Luquillo and Humacao are both coastal locations. Humacao’s population evacuated before the hurricanes because this was one of the areas that the hurricane was expected to make landfall. Humacao’s communities are most at risk because a lake and a river surround them.
Qualitative Analysis: Challenges Evidenced from Hurricane Maria
From the in-depth interviews (participants 1-17) and focus groups (participants 18-36), participants highlighted the key challenges that communities faced after Hurricane Maria that directly influenced prompt access to health services.
Flood-Prone Areas
Flood-prone areas left communities without access to a health facility (e.g., Ingenio in Toa Baja, Rio Blanco, Naguabo, Punta Santiago in Humacao, Maguayo in Lares). Participant 23 in Rio Blanco said that after their main bridge was down, the alternative road extended their travel times three times the normal time. After the hurricane, these travel times exponentially increased, making it impossible to reach a nearby hospital by road for the next couple of weeks. Participants from this community faced a medical emergency with one of their neighbors in the aftermath of the hurricane. Participant 26 explained he had to carry his neighbor over his shoulder across the bridge that was unavailable for vehicle trespassing, and get her to the ambulance on the other side of the river. The government built a new bridge a year after the hurricane, but their erroneous design created a more significant issue. After 18 months of building the bridge, it got flooded. The region of Cataño also got flooded immediately after the hurricane, and 15 to 20 families were trapped in that area. Other areas, like Utuado, had their only access bridge collapse after Hurricane Maria and it stayed down for several months. The community was isolated until the National Guard moved them by helicopter.
Mountainous Regions
Rural communities in mountainous regions also experienced challenges to regaining healthcare access after the hurricane. Participant 28 explained the roads leading to his home in Buenos Aires are narrow and with many curves. Most of their roads can barely fit two small vehicles. Participant 4 acknowledged that the government was quick to respond in their area because their hospital was the only one that served populations in the mountains. He explained,
I arrived at the hospital three weeks after the hurricane because there was no access to Castañer. After all, it is located higher up in the mountains. However, the government gave the hospitals priority. Thus, they opened roads for accessibility because it was the only center in the mountain region able to receive patients affected by Hurricane Maria.
Poor Road Network
Puerto Rico only has two interstates and a few main highways across the island. Yet, road access is critical to reach hospitals or get ambulances to pick up patients. Under normal conditions, these highways are largely congested. Centro Medico, the only trauma center on the island, is, for many communities, a long drive. Participant 12 explained that, under normal conditions, it takes an ambulance more than thirty minutes to take a patient from Hato Rey—located in the San Juan metropolitan area—to reach Centro Medico. Participant 1 explained that other communities near the San Juan area face constant challenges reaching Centro Medico because their only road of access gets congested. She mentioned the community Piñones “only has one main road that gets congested easily.” The doctor explains that the community’s access to health care is critical because many residents lack a private vehicle, and there is no public transportation that takes them from their communities to the main road. After they reach the main highway, they could get on a municipal bus, which is highly unreliable. She explained, “people who have had health emergencies have not been able to leave the community because they have nowhere to go, they can take an hour or two to leave the community. This was even before Maria.” After Hurricane Maria, the reality was that ambulances could not even arrive in specific communities due to incorrect or missing addresses. Yet, to those who were able to arrive, it took them approximately 8 hours, as acknowledged by Participant 22.
Hurricane Debris Left Roads Inaccessible
After Hurricane Maria, many communities were left isolated because the roads were covered in fallen trees, power lines, and a lot of other debris. Participant 11 mentioned, “the official response did not arrive on time for many communities. Thus, after the emergency, communities had to look out for themselves.” The latter was confirmed by Participant 13, who mentioned this happened in her community. A girl was about to give birth in the aftermath of Hurricane Maria. Her husband, who rushed to take her to the hospital, also had an emergency because his fingers were hurt from fallen debris. He had a personal vehicle to drive to the hospital, but debris blocked the only road to access the highway. This was in the middle of the night, just after the hurricane had passed. Thus, the official response had not arrived to clear the road. Some neighbors came together with “machetes” to clear off the road and help them get to the hospital. Participant 4 acknowledged that road infrastructure was already vulnerable and worsened after Hurricane Maria. He explains the evidence and its prolonged effects,
(…) rivers flooded, roads collapsed, and trees and landslides prevented access to communities because the infrastructure was weak. After almost six years since Hurricane Maria, there are still roads that are difficult to access because the hurricane deteriorated them quite severely. This is a vulnerability.
Lack of Access to Medication
The lack of emergency supplies was a general issue in Puerto Rico after Hurricane Maria, including medication and medical supplies. Insulin, for instance, was a critical medication because it had to be kept under certain temperatures, and with no electricity, the chances of it going to waste were high. A second crisis was the lack of medication for psychiatric patients. Participant 4 explained,
There was a lack of medicine for psychiatric patients during the first three months after the incident. However, the government released the licenses to prescribe this type of medicine, and the hospital pharmacy was able to open these drugs to give to patients. This release for prescribing antipsychotic medication, anxiolytics, and antidepressants benefited the patients because they did not have to go to a specialized pharmacy with a psychiatrist and were able to get refills of their medication.
Lack of Medical Facilities
A pressing issue that communities faced was access to a hospital after the hurricane, both in the immediate aftermath of the disaster and for the subsequent years. In areas where communities had a health facility, it is either not operational or has limited operating hours. Puerto Rico’s health system model worsened the situation because low-income communities now have fewer primary care facilities near their communities. Those that remain are privately owned and do not operate 24/7. These primary care facilities, called Centers for Diagnostic and Treatment, are unavailable during night hours. Participant 28 mentioned their primary care facility only stayed open until 8 pm. Participant 8 explained that “there was a huge migration of providers, doctors and nurses after Maria. Also, many centers were destroyed and were not recovered again.” After Hurricane Maria, these hospitals and primary care centers suffered massive infrastructure damage, particularly those with wooden structures. Participant 25 mentioned they do not have a hospital and that the nearest hospital, the largest of the three in Humacao, had collapsed. Hospitals that remained operative had at least one generator, but the generators were unreliable with prolonged outages.
Strategies to Regain Access to Health Care After a Disaster
Both stakeholders and community members highlighted potential and current strategies that can help improve healthcare access in communities across Puerto Rico. We organized these strategies and listed them in the next section.
Conclusions
Policy Recommendations
The study’s preliminary findings helped us design policy recommendations that can help improve healthcare access in communities across Puerto Rico. The recommendations are as follows:
- Identify road network vulnerabilities and plan to have a fast road access plan. The quantitative findings in this study can help identify communities with fewer streets or more streams to prioritize access.
- Reserve areas that can serve as heliports near hospitals to provide alternative ways to distribute medical supplies and services where roads are unavailable.
- Increase the number of primary care facilities that serve communities in Puerto Rico.
- Collect more data to identify critical transportation vulnerabilities, like specific road segments and bridges that require an upgrade, to improve the communities’ access routes.
- Identify and map missing addresses across the island to help ambulances more accurately reach those in need of urgent medical attention.
Community Action Guidelines
Our findings identified that transportation challenges made the delivery of medical supplies and services very difficult. Thus, communities should prepare to address immediate medical emergencies without taking patients to the nearest hospital. Community members can develop these guidelines in preparation for a disaster:
- Conduct a census of the population’s health conditions to understand critical vulnerabilities in their community and help inform the disaster response emergency plans regarding specific medical needs within their community.
- Map the essential facilities near their community (e.g., a point of refuge, the flood-prone areas, areas that serve as heliports, and shelter locations like schools to distribute food and medical supplies).
- Have a structurally safe, reserved space with alternative electricity back-ups (e.g., generator, solar panels) and reserves of essential hygiene and medical supplies that functions as a primary care facility.
- Train members of the community in first response activities (e.g., Cardiopulmonary Resuscitation).
Public Health Implications
This study has several public health implications. First, the findings improve our understanding of the transportation-related variables that influence social vulnerability and the identification of vulnerable groups. Such information can help evaluate disaster-related health policies that help ensure the well-being of these communities. In addition, SVI can be used by local governments, emergency management, clinicians, public health practitioners, and other relevant parties to inform decision-making. Updating the SVI to include additional measures of transportation can help practitioners identify particularly vulnerable communities.
Second, public health policies and strategies can help address the health issues Puerto Rican communities currently face. The specific strategies identified in this research include:
- Identifying vulnerable populations using the SVI and access to transportation variables, based upon the findings of our quantitative study.
- Have a centralized database that includes public health statistics for Puerto Rico. Our study identified missing datasets, such as data on open medical facilities and the number of ambulance drivers, ambulance services, and disaster emergency response teams in the different counties. These additional variables may complement the SVI as more information is publicly available and regularly updated for Puerto Rico. These indicators will allow public health agencies to identify communities that have limited transportation access to medical services.
- Have medical teams in place to visit communities when these get isolated. Our study identified socially vulnerable communities in counties that are more likely to get isolated.
Future Research Directions
The study employed a mixed-methods approach to improving healthcare access in Puerto Rican communities. The quantitative analysis identified the access and network variables that influence social vulnerability. The fieldwork data complemented the analysis by understanding the inherent challenges in Puerto Rico’s lack of access to health care. This study also provided ample opportunities for future research. The quantitative analysis of the SVI suggests that new variables may be added to account for the transportation barriers to receiving health care. The latter can be done as more data becomes available. In addition, future work should consider updating the transportation network mapping of Puerto Rico as it will help identify the feasible access routes for communities across the island. Evaluating the transportation system’s vulnerabilities and resilience for the entire island is another promising area for future research.
References
-
Centers for Disease Control and Prevention/ Agency for Toxic Substances and Disease Registry/ Geospatial Research, Analysis, and Services Program (CDC/ATSDR). (2021). CDC/ATSDR Social Vulnerability Index [2018] Database [Puerto Rico]. https://www.atsdr.cdc.gov/placeandhealth/svi/data_documentation_download.html ↩
-
The Stormwater Report. (2021). Puerto Rico particularly vulnerable to climate change, research suggests. https://stormwater.wef.org/2021/06/puerto-rico-particularly-vulnerable-to-climate-change-research-suggests/ ↩
-
Kishore, N., et.al. (2018). Mortality in Puerto Rico after Hurricane Maria. New England Journal of Medicine, 379(2), 162-170. https://www.nejm.org/doi/full/10.1056/nejmsa1803972 ↩
-
Mitigation Assessment Team (MAT). (2018). Hurricanes Irma and Maria in Puerto Rico: Building performance observations, recommendations, and technical guidance. FEMA. https://www.fema.gov/sites/default/files/2020-07/mat-report_hurricane-irma-maria-puerto-rico_2.pdf ↩
-
Mazzei, P. (2019). Hunger and an ‘Abandoned’ Hospital: Puerto Rico Waits as Washington Bickers. The New York Times. https://www.nytimes.com/2019/04/07/us/puerto-rico-trump-vieques.html ↩
-
Coto, D. (2018) A year after Maria, Puerto Rican kidney patients fear death. AP News. https://apnews.com/article/64150b2b19644256860be645cf5f3e6c ↩
-
Cruz-Cano, R., & Mead, E. L. (2019). Causes of excess deaths in Puerto Rico after Hurricane Maria: A time-series estimation. American Journal of Public Health, 109(7), 1050-1052. ↩
-
Caliper (2022). Maptitude Mapping Software. https://www.caliper.com/maptdata.htm ↩
-
Martinez-Sanchez, O. (2018). Impacts from Hurricanes Irma and Maria in the Caribbean. Sidebar 7.1. In State of the Climate in 2017. Bull Amer Meteor Soc, 99(8), S202–S203. ↩
-
Chapell B. (2017) Trump hints at a limit on federal aid to Puerto Rico; San Juan Mayor Responds. NPR. http://www.npr.org/sections/thetwo-way/2017/10/12/557353205/trump-hints-at-a-limit-on-federal-aid-to-puerto-rico-san-juan-mayor-responds ↩
-
Niles, S. & Contreras, S. (2019). Social Vulnerability and the Role of Puerto Rico’s Healthcare Workers after Hurricane Maria. Natural Hazards Center. https://hazards.colorado.edu/quick-response-report/social-vulnerability-and-the-role-of-puerto-ricos-healthcare-workers-after-hurricane-maria ↩
-
Zorrilla, C. D. (2017). The view from Puerto Rico—Hurricane Maria and its aftermath. New England Journal of Medicine, 377(19), 1801-1803. https://www.nejm.org/doi/full/10.1056/NEJMp1713196 ↩
-
Portela, M., & Sommers, B. D. (2015). On the outskirts of national health reform: A Comparative assessment of health insurance and access to care in Puerto Rico and the United States. The Milbank Quarterly, 93(3), 584–608. ↩
-
Behling-Hess, C. (2021). Healthcare in Puerto Rico: Before and after Hurricane Maria. Public Health in Latin America. https://sites.google.com/macalester.edu/phla/key-concepts/healthcare-in-puerto-rico-before-and-after-hurricane-maria ↩
-
Wisner, B., Blaikie, P., Cannon, T., & Davis, I. (1994). At risk: Natural hazards, people’s vulnerability and disasters. Routledge. ↩
-
Centers for Disease Control and Prevention (CDC). (2015). Planning for an emergency: Strategies for identifying and engaging at-risk groups: A guidance document for emergency managers. https://www.cdc.gov/nceh/hsb/disaster/atriskguidance.pdf ↩
-
Gulliford, M., Figueroa-Munoz, J., Morgan, M., Hughes, D., Gibson, B., Beech, R., & Hudson, M. (2002). What does "access to health care" mean?. Journal of Health Services Research & Policy, 7(3), 186-188. https://doi.org/10.1258/135581902760082517 ↩
-
Dixon-Woods, M., Cavers, D., Agarwal, S., Annandale, E., Arthur, A., Harvey, J., Hsu, R., Katbamna, S., Olsen, R., Smith, L., Riley, R. & Sutton, A. J. (2006). Conducting a critical interpretive synthesis of the literature on access to healthcare by vulnerable groups. BMC Medical Research Methodology, 6(1), 1-13. https://doi.org/10.1186/1471-2288-6-35 ↩
-
Field, K., & Briggs, D. (2001). Socio-economic and locational determinants of accessibility and utilization of primary health-care. Health and Social Care in the Community, 9(5), 294-308. https://doi.org/10.1046/j.0966-0410.2001.00303.x ↩
-
Littenberg, B., Strauss, K., MacLean, C. D., & Troy, A. R. (2006). The use of insulin declines as patients live farther from their source of care: results of a survey of adults with type 2 diabetes. BMC Public Health, 6, 198. https://doi.org/10.1186/1471-2458-6-198 ↩
-
Nicholl, J., West, J., Goodacre, S., & Turner, J. (2007). The relationship between distance to hospital and patient mortality in emergencies: an observational study. Emergency Medicine Journal, 24(9), 665-668. 10.1136/emj.2007.047654. ↩
-
Shipman, C., Payne, F., Dale, J., & Jessopp, L. (2001). Patient-perceived benefits of and barriers to using out-of-hours primary care centres. Family Practice, 18, 149-155. https://doi.org/10.1093/fampra/18.2.149 ↩
-
Cardona, O. D. (2002). La necesidad de repensar de manera holística los conceptos de vulnerabilidad y riesgo. Proceedings of The International Work-Conference on Vulnerability in Disaster Theory and Practice, Wegeningen, Netherlands. ↩
-
Seeliger, L. & Turok, I. (2013). Towards sustainable cities: Extending resilience with insights from vulnerability and transition theory. Sustainability, 5(5), 2108-2128. ↩
-
Modica, M., & Reggiani, A. (2015). Spatial economic resilience: Overview and perspectives. Networks and Spatial Economics, 15(2), 211-233. ↩
-
Cantillo, V., Macea, L., & Jaller, M. (2018). Assessing vulnerability of transportation networks for disaster response operations, Networks and Spatial Economics. https://doi.org/10.1007/s11067-017-9382-x ↩
-
Berdica, K., & Eliasson, J. (2004). Regional accessibility analysis from a vulnerability perspective. Proceedings of The Second International Symposium on Transportation Network Reliability, Christchurch, New Zealand. http://urn.kb.se/resolve?urn=urn:nbn:se:kth:diva- ↩
-
Darayi, M., Barker, K., & Santos, J. R. (2017). Component importance measures for multi- industry vulnerability of a freight transportation network. Networks and Spatial Economics, 17(4), 1111-1136. ↩
-
Lee, S., Kim, J., Lee, S., & Chang-Richards, Y. (2014). Development of resilience index in transport systems. In 10th international conference of the international institute for infrastructure resilience and reconstruction (I3R2), 20-22 May 2014. (7-13). West Lafayette, Indiana: Purdue University. ↩
-
Rodríguez-Núñez E., García-Palomares J. C. (2014). Measuring the vulnerability of public transport networks. Journal of Transport Geography 35:50–63. https://doi.org/10.1016/j.jtrangeo.2014.01.008 ↩
-
Schreiner S (2013) Urban transport and logistics in cases of natural disasters. In: Taniguchi E, Fwa T. F., Thompson R. G. (eds) Urban transportation and logistics: health, safety, and security concerns. CRC Press, Boca Raton, pp 225–244. ↩
-
Murray-Tuite, P. M. (2006, December). A comparison of transportation network resilience under simulated system optimum and user equilibrium conditions. In Proceedings of the 2006 Winter Simulation Conference (pp. 1398-1405). IEEE. ↩
-
Amdal, J. R., & Swigart, S. L. (2010). A Case study of opportunities realized and missed in the greater New Orleans region. Gulf Coast Research Center for Evacuation and Transportation Resiliency. ↩
-
Kelly, P. M., & Adger, W. N. (2000). Theory and practice in assessing vulnerability to climate change and facilitating adaptation. Climatic Change, 47(4), 325-352. ↩
-
Domingue, S. J., & Emrich, C. T. (2019). Social vulnerability and procedural equity: Exploring the distribution of disaster aid across counties in the United States. American Review of Public Administration, 1-19. ↩
-
Cutter, S. L., & Emrich, C. T. (2006). Moral hazard, social catastrophe: The changing face of vulnerability along the hurricane coasts. The Annals of the American Academy of Political and Social Science, 604, 102-112. ↩
-
Fothergill, A., Peek, L. A. (2004). Poverty and disasters in the United States: A Review of Recent Sociological Findings. Natural Hazards, 32, 89-110. ↩
-
Morrow, B. H. (1999). Identifying and mapping community vulnerability. Disasters, 23, 1-18. ↩
-
Reid, M. (2013). Disasters and social inequalities. Sociology Compass, 7, 984-997. ↩
-
Fordham, M., Lovekamp, W., Thomas, D., & Phillips, B. (2013). Understanding Social Vulnerability. In D. Thomas, B. Phillips, W. Lovekamp, & A. Fothergill (Eds.), Social Vulnerability to Disasters (2nd ed., pp. 1-29). CRC Press. ↩
-
Singh, S. R., Eghdami M. R., & Singh, S. (2014). The concept of social vulnerability: A review from disasters perspectives, International Journal of Interdisciplinary and Multidisciplinary Studies, 1(6), 71-82. ↩
-
Kroll-Smith, S. (2013). Recovering Inequality Hurricane Katrina the San Francisco Earthquake of 1906, and the Aftermath of Disaster. University of Texas Press. ↩
-
Cutter, S. L., Boruff, B. J., Shirley, W. L. (2003). Social vulnerability to environmental hazards. Social Science Quarterly, 84, 242-261. ↩
-
Eroglu, D. I., Pamukcu, D., Szczyrba, L., & Zhang, Y. (2020). Analyzing and contextualizing social vulnerability to natural disasters in Puerto Rico. WiP Paper – Data and Resilience: Opportunities and Challenges. Proceedings of the 17th ISCRAM Conference, Blacksburg, VA. http://idl.iscram.org/files/deryaipekeroglu/2020/2238_DeryaIpekEroglu_etal2020.pdf ↩
-
Pendall, R., Theodos, B., & Franks, K. (2012). Vulnerable people, precarious housing, and regional resilience: An exploratory analysis. Housing Policy Debate, 22(2), 271-296. ↩
-
National Academies of Sciences, Engineering, and Medicine. (2020). Strengthening post-hurricane supply chain resilience: Observations from Hurricanes Harvey, Irma, and Maria. The National Academies Press. https://doi.org/10.17226/25490 ↩
-
Rios, C. C., Ling, E. J., Rivera-Gutierrez, R., Gonzalez Sanchez, J., Merrell, S. B., Bruce, J., Barry, M. & de Jesus Perez, V. (2021). Puerto Rico health system resilience after Hurricane Maria: Implications for disaster preparedness in the COVID-19 era. Frontiers in Communication, 120. ↩
-
Chandra, A., Marsh, T., Madrigano, J., Simmons, M. M., Abir, M., Chan, E. W., Ryan, J., Nanda, N., Ziegler, M. D., & Nelson, C. (2021). Health and social services in Puerto Rico before and after Hurricane Maria: Predisaster conditions, hurricane damage, and themes for recovery. Rand health quarterly, 9(2), 10. ↩
-
Michaud, J., & Kates, J. (2017). Public health in Puerto Rico after Hurricane Maria. The Henry J. Kaiser Family Foundation. https://www.kff.org/other/issue-brief/public-health-in-puerto-rico-after-hurricane-maria/ ↩
-
U.S. Census Bureau (2021a). Puerto Rico Municipios Population Totals: 2010-2019. [Online Database]. https://www.census.gov/data/datasets/time-series/demo/popest/2010s-total-puerto-rico-municipios.html ↩
-
Alameda Lozada, J. I. (2013) The demand and supply of physicians in Puerto Rico. Historical trends and forecasting 2013 to 2019. Puerto Rico Department of Health. https://estadisticas.pr/files/inventario/publicaciones-especiales/OfertayDemandadeMedicosPR_Alameda_2014.pdf ↩
-
Health Resources and Services Administration. (2022). Awarded Grants by State and County. https://data.hrsa.gov/data/reports/datagrid?gridName=FinancialAssistance ↩
-
Free Clinic Directory. (2022). Puerto Rico free clinics and community health centers. https://freeclinicdirectory.org/puerto_rico_care.html ↩
-
Center for Emergency Management and Homeland Security (CEMHS). (2022). Spatial Hazard Events and Losses Database for the United States (Version 20.0). [Online Database]. Phoenix, AZ: Center for Emergency Management and Homeland Security, Arizona State University. https://cemhs.asu.edu/sheldus ↩
Ramirez-Rios, D., Wallace, W. A., Kinsler, J., Martinez Viota, N. & Mendez, P. (2022). Exploring Post-Disaster Transportation Barriers to Healthcare of Socially Vulnerable Puerto Rican Communities (Natural Hazards Center Public Health Disaster Research Report Series, Report 17). Natural Hazards Center, University of Colorado Boulder. https://hazards.colorado.edu/public-health-disaster-research/exploring-post-disaster-transportation-barriers-to-healthcare-of-socially-vulnerable-puerto-rican-communities