The March 2020 Tennessee Tornados
Risk Perceptions, Preparedness, and Communication
Publication Date: 2022
Executive Summary
Overview
In March 2020, nocturnal tornados swept throughout middle Tennessee, resulting in 25 deaths and widespread destruction of homes and structures. Recent studies of Tennessee tornados have noted various factors that can influence tornado risk perceptions among the public, such as prior experience with a tornado and the under-reporting of tornados in less populated and rural areas. Focusing primarily on the mostly rural county within the Upper Cumberland region of Tennessee that experienced the highest number of fatalities in March 2020, this study employs a mixed methodology, including a survey, interviews, and participant observation from May 2020 to September 2021, to interrogate tornado risk perceptions, preparedness, and hazard communication among various stakeholders impacted by the 2020 tornados, including residents, emergency managers, media representatives, tornado survivors, recovery workers and volunteers, and public employees.
Research Questions
- How do experiences and beliefs influence public decisions in tornado preparedness?
- What are processes for hazard communication and preparation amongst diverse stakeholders?
- How has hazard communication and preparation among stakeholders been impacted by middle Tennessee’s 2020 tornados?
Research Design
Data collection on tornado risk perceptions, preparedness strategies, and communication occurred in middle Tennessee where an EF0 - EF4 tornado outbreak occurred in March 2020. Purposive and snowball sampling was used to target affected adult community members, emergency responders, impromptu emergency response volunteers, non-governmental organizations, medical professionals, and government officials. Methods included qualitative interviews (conducted virtually or in person) with 34 participants, including survivors, emergency managers and responders, recovery workers and volunteers, media representatives, public employees, and a public official. A quantitative online survey was developed and distributed, which garnered 303 responses, mostly from Putnam County residents. Research design was reviewed and approved by Institutional Review Boards.
Preliminary Findings
Only preliminary findings from the qualitative interviews and descriptive statistics from quantitative data are reported in this paper. Quantitative data will be analyzed and reported in follow-up publications. Two major research foci centered on requests from collaborating local agencies and focused on (1) risk perception and preparedness of community members and (2) effectiveness of emergency communications. Diverse risk perceptions exist among community members. While some participants continue to perceive tornado risk to be low in the region, many increased preparedness after the March 2020 tornados through self-reported behavioral changes such as developing sheltering plans, putting together disaster kits, and purchasing storm shelters or homes with basements. The rapport and relationship-building among agencies prior to the disaster was reported by diverse stakeholders as essential in providing an effective and coordinated response, which was facilitated by the recent development of an emergency operations center in the county.
Community members used a diverse set of emergency alert tools, with most relying on phone applications and text alerts that are easily compromised during severe weather. At least a quarter of survey respondents noted that they did not receive any alert and interviewees often noted that alerts came either moments before or after the tornado event. Individuals also shared that they frequently ignored phone app alerts due to the sheer volume received (e.g., Amber alerts). In the aftermath of the tornados, two improvised forms of communication between responders and community members were established: use of the Public Broadcasting Service television channel to reach those without cellular phones and a locally focused internet Facebook group.
Practical Implications
Our preliminary findings support other tornado research in the southeastern United States highlighting the barriers to warning access and receipt, especially for nocturnal tornados (Mason et al., 20181; Walters et al., 20202). Preparedness efforts should consider the importance of multiple formal and informal warning sources for facilitating the receipt of nighttime warnings (Brotzge & Donner, 20133; Mason et al., 2018). Our study also stresses the importance of expanding access to and knowledge of warning systems in rural and semi-rural areas where access is currently limited (e.g., outside of cellular range) and for individuals who are not socioeconomically positioned to invest in tornado preparedness (e.g., weather radio). Preliminary findings, like other studies (Choi & Wehde, 20204; Sherman-Morris, 20055; Wachinger et al., 20136), highlight reliance on various media platforms and the importance of outreach through trusted organizations, while also considering the limited access to internet service in more rural areas. While mobile home vulnerability remains a concern in the southeastern United States, most participants in this study reside in permanent homes, which was also the housing type most impacted by the EF-4 tornado in 2020, suggesting the importance for governments to explore funding for safe sheltering possibilities for diverse housing types (e.g., safe rooms), review building codes, and incentivize mitigating construction practices. Lastly, this study emphasizes the importance of strong relationships among entities (e.g., government, emergency managers, hospitals, nonprofits, media) involved in disaster preparedness and response, and where possible, developing emergency operations centers that bring key stakeholders together during crises.
Introduction
In early March 2020, a series of nocturnal tornados swept throughout Tennessee, resulting in 25 deaths and widespread destruction of homes and structures. The seasonal variability and nocturnality of tornados in the southeastern United States have historically resulted in high fatality rates and pose numerous challenges in terms of warnings and preparedness. Studies of southeastern tornados in recent years have examined tornado climate, behavior, warnings, and risk perceptions in and around major cities across the state, noting various factors that can shape tornado risk perceptions, including direct experience with previous tornados and the under-reporting of tornado events in less populated or rural areas. Focusing primarily on a mostly rural county within the Upper Cumberland region of Tennessee that experienced the highest number of fatalities in the March 2020 tornado outbreak, this study employs a mixed methodology to interrogate (1) how experiences and beliefs influence tornado preparedness decisions among members of the general public and (2) processes and effects of hazard communication among diverse stakeholders, including residents, emergency managers, media representatives, tornado survivors, recovery workers and volunteers, and public employees. To answer these questions, qualitative and quantitative data was collected from May 2020-September 2021 using surveys, interviews, and participant observation.
Literature Review
According to the National Severe Storms Laboratory (n.d.7), the United States is particularly prone to tornados, with approximately 1,200 tornados reported annually. Studies have historically focused heavily on the frequency and spatial and temporal dimensions of “Tornado Alley,” an area geographically associated with the Great Plains and Midwest (Anderson-Frey et al., 20198) to the exclusion of the southeastern United States. Despite this, reports on the destructiveness of tornados in the southeastern United States date back many decades (e.g., Kincer, 19369; Nunn, 192110).
The lesser known “Dixie Alley'' of the southeastern United States may be an extension of Tornado Alley (Dixon et al., 201111), yet it exhibits differences in seasonality, timing, and frequency of severe tornados (Gagan et al., 201012). The southeast has high exposure to significant tornados (category EF2 and higher) (Coleman & Dixon, 201413) and experiences higher numbers of tornado-related fatalities due in part to the frequency of nocturnal tornado events, which are 2.5 times more likely to kill than diurnal tornados (Ashley et al., 200814; Kis & Straka, 201015). In fact, nocturnal tornados account for 43.1% of the tornados in the South, and in Tennessee specifically, they account for 45.8% (Ashley et al., 2008). The region also experiences high-shear/low-CAPE (Convective Available Potential Energy) (HSLC) tornados compared to other areas in the contiguous United States, with shear referring to spin or rotation and CAPE referring to the lift or rise of the tornado. These HSLC tornados contribute to nocturnal tornado events since they commonly occur overnight and in cooler weather (Anderson-Frey et al., 2019; Sherburn & Parker, 201416). Their behavior also contributes to Tennessee’s susceptibility to cold season tornados between November and February (also known as “NDJF tornados,” for the initials of the season’s months) (Childs & Schumacher, 201817), although the greatest peak in activity is in the spring (Ashley, 200718; Brooks et al., 200319).
Among studies in the southeastern United States, Tennessee has received considerable attention due to variability of tornado behavior over time and space (Agee et al., 201620; Brown et al., 201621), with implications for risk perceptions, preparedness, and predictability (Ellis et al., 201822; Ellis et al., 202023). Highlighting the variability in tornado behavior across Tennessee, Brown and colleagues (2016) examined the frequency (total frequency and tornado days) in three major cities (Memphis, Nashville, and Knoxville) and surrounding areas between 1950 and 2013 and found more reported tornados in Nashville, although Memphis had a higher number of tornado days. Surveyed risk perceptions (Ellis et al., 2018) in and around these urban areas found that about half of participants underestimated tornado risk, when calculating risk based on 50 years of historical tornado data. In rural areas where weaker tornados are under-reported, risk under-estimation increased to 81%, highlighting how experience and knowledge of events may influence risk perceptions.
Studies have also focused on risk perceptions, preparedness, and vulnerability in relation to housing in the southeastern United States (Liu et al., 201924; Strader & Ashley, 201825), and in Tennessee specifically (Chaney & Weaver, 201026) due to mobile home density in the region, which is higher than the national average (Ashley, 2007). Recognizing the socioeconomic dimensions of preparedness, these studies found mobile home residents to be less prepared for a tornado than permanent or fixed home residents and are also less likely to find safe shelter during a tornado event. While fixed homes may provide some refuge during low intensity tornados, high numbers of fatalities with EF4 and EF5 tornados, however, occur in permanent structures, which calls into question the efficacy of commonly used shelter-seeking protocols (Mason & Senkbeil, 201427). This is important to consider in Tennessee, where the average of EF-3 to EF-5 tornados is higher than other states (National Oceanic and Atmospheric Administration [NOAA], 202028).
Insight into sociocultural and psychological factors, not just technological, in understanding risk and preparedness is key for framing disaster policy and practice (Brotzge & Donner, 2013; Klockow et al., 201429; Paul et al., 200330; Schumacher et al., 201031; Stokoe, 201632). Meteorologists, emergency services, and government officials play an important role in risk perception and preparedness. The literature suggests that trust in emergency management agencies, from local to federal levels, can affect tornado preparedness, but levels of trust in government can vary due to demographic characteristics and individual political ideology (Choi & Wehde, 2020). This is particularly relevant for emergency communications and preparedness sensitization.
Risk perception can be linked to personal and past experiences (Greening & Dollinger, 199233; McClure et al., 201534) and collective memory (García-Hernández et al., 201835; Viglione et al., 201436), but media coverage and other factors, such as trust in experts and authorities, also play a key role (Wachinger et al., 2013). For instance, media, and specifically broadcast meteorologists, serve as intermediaries between forecasters and the public. While media networks may promote forecast accuracy in their reporting, meteorologists are tasked with reporting forecast uncertainty, while also trying to maintain viewer loyalty and confidence. Uncertainty in weather forecasts and advisory alerts is often expected, but there is variability in how it is communicated and interpreted, which has implications for emergency communications preparedness and understandings of public responses to weather alerts (Demuth et al., 200937; NOAA, 2016, p. 2838). A study in Memphis, Tennessee, for example, not only supports previous studies on public dependency on mass media during severe weather, but also suggests that people establish trust in local weather forecasters, which can influence shelter-taking behavior during a tornado (Sherman-Morris, 2005). These complex relationships call for further investigation into how emergencies are communicated to residents and how residents prioritize the communications.
As Brotzge and Donner (2013) note, public responses to warnings are multidimensional and complex, and while many challenges are technological, warning systems could specifically be improved with further research into “acceptable risk, preparation, and personalization” (2013 p. 1724). People receive warnings from formal and informal channels and how they interpret risk and comprehend warnings can be shaped by personal experiences, demographic factors, and beliefs. Research suggests that more localized and personalized warnings, with maps and specific location information, can enhance response to tornado warnings; whereas probability information can be confusing and high rates of false alarms and long lead times can depersonalize warnings (Brotzge & Donner, 2013; Walters et al., 2020).
Given that the southeastern United States is prone to deadly, nocturnal tornados, such as those in March 2020 that prompted this study, understanding warnings and responses to night tornados will be pivotal to reducing fatalities. People are less likely to receive warnings and other environmental and social cues at night, which in turn inhibits protective actions (Mason et al., 2018). Additionally, a previous study conducted in Tennessee found that individuals had access to at least one warning source, but numerous barriers to warnings were reported, such loss of electricity, heavy sleep, ineffectiveness for those living with hearing impairments, reception in rural localities, and lack of weather radios (Walters et al., 2020). At the intersection of these bodies of literature, this study focuses on disaster preparedness and risk perception in semi-rural and rural areas of middle Tennessee, specifically in the aftermath of the March 2020 nocturnal tornados.
Research Design
Research Questions
- How do experiences and beliefs influence public decisions in tornado preparedness?
- What are processes for hazard communication and preparation amongst diverse stakeholders, including residents, emergency managers, media representatives, tornado survivors, recovery workers and volunteers, and public employees?
- How has hazard communication and preparation among stakeholders been impacted by middle Tennessee’s 2020 tornados?
Study Site Description
Of the 10 tornados that swept through Tennessee on March 2-3, 2020, an EF-3 tracked 60 miles from east Nashville into Smith County and an EF-4 with 175 miles per hour winds touched down in western Putnam County almost immediately after a warning was issued at 1:48 AM. While data collection occurred in multiple counties, the primary study site was Putnam County, situated in the rural Upper Cumberland area of middle Tennessee, which is part of the broader Appalachian region. Due largely to the EF-4 tornado, Putnam County experienced the highest number of fatalities (19), dozens of injuries, and an estimated $100 million of damages to infrastructure and property (National Weather Service, 202039). The deaths and damage largely occurred in the EF-4 area, where an apartment complex and over 20 permanent homes were leveled or destroyed. Destruction continued as the tornado weakened in its path east toward the city of Cookeville, the hub of the Upper Cumberland. At that time, a nascent emergency operations center that had not yet officially opened was activated. Damage to a public safety radio tower and to commercial cellular networks disrupted many warnings and responses (Firstnet Authority, 202040). While the county has experienced over 20 tornado events since the 1950s, the 2020 tornado is the worst on record and most severe since 1974. Due to COVID-19 restrictions, the field sites were initially accessed virtually, with implications for building rapport and participant relationships throughout our ethnographic fieldwork (see Kim et al., 202141). On-site research occurred in July 2020 and June 2021, with careful observation of public health guidelines.
Sampling and Participants
To collect qualitative data on tornado risk, preparedness, and communication in middle Tennessee, we leveraged existing connections in the region and used a purposive sampling plan that targeted adult community members, trained emergency responders, impromptu emergency response volunteers, non-governmental organizations, medical professionals, and government officials impacted by the March 2020 tornados. Snowball sampling was also used to identify participants, as practitioners and survivors recommended others for interviews and observation. Verbal or signed informed consent was obtained prior to participation.
For quantitative survey data, convenience sampling was used to disseminate the survey through established networks and social media and media outlets, including the Putnam County Emergency Management Agency (EMA), county mayor, and Cookeville Strong Facebook groups. In 2021, 303 individuals participated in the online survey, which required informed consent and targeted individuals over the age of eighteen and living or working in the impacted counties at the time of the disaster. Most respondents were between ages 20 and 70 and over 86% indicated they were living in Putnam County during the time of the survey. Minors and those not living or working in the impacted communities at the time of the disaster were excluded from the study.
Data, Methods, Procedures, and Data Management
Qualitative data regarding disaster experience, preparedness, response, and recovery was collected through 34 semi-structured interviews, eight informal interviews, and participant observation, including participation at a tornado clean-up event. For interviews, participants were contacted first via email or telephone, and then interviewed for 30-90 minutes either in-person, through videoconference, or telephone. Questions varied depending on the role of the interviewee, but broadly speaking, they focused on personal and professional preparedness; direct experiences before, during, and after the tornado; and challenges faced during recovery and when interacting with other stakeholders. Interviews were recorded and transcribed. Interview recordings, transcriptions, notes, site photos, maps, and other research-related materials have been de-identified and stored in a google drive account accessible by the three PIs. Qualitative data was memoed and coded in NVivo.
Quantitative data was collected through use of a Qualtrics survey, which was a modified version of the Oregon Natural Hazards Workgroup (200742) Households Natural Disasters Preparedness Survey and Stokoe (2016) Online Tornado Preparedness Survey, with questions added to meet the stated interests and needs of the Putnam County EMA. The survey collected demographic information as well as information on preparedness prior to and after the March 2020 tornados. De-identified data was collected and stored in the Qualtrics platform and has been converted to SPSS Statistics format on password-protected computers. At this time quantitative data is being cleaned and prepared for analysis to identify correlations between preparedness behaviors and perceptions of risk.
Researcher Positionality, Reciprocity, and Other Ethical Considerations
The study design and methodology were approved by Institutional Review Boards at Kennesaw State University, University of North Carolina at Charlotte, and University of Findlay during May and June of 2020. Due to the COVID-19 safety concerns, research began remotely before moving to on-site fieldwork, which was limited and in accordance with safety protocols. Collaboration for this study included researchers from multiple disciplines at three academic institutions. While all three of the researchers have lived in Tennessee, two are currently based in the southeastern United States, and one is a native of the affected region. Our team was thus well positioned for this research and ongoing collaborations. As part of the reciprocal nature of the relationships built with community organizations, data collection questions were rooted in the stated needs of the Putnam County EMA and findings will be shared with the EMA and other interested stakeholders.
Preliminary Findings
Preliminary findings are based predominantly on qualitative data which has been cleaned, coded, and initially analyzed; quantitative data is being prepared for analysis with only descriptive statistics provided at this time. Data analyses thus far have focused on assessing tornado risk perception and preparedness behaviors and emergency communication among stakeholders with a focus on community members. A few initial findings are presented here, but data collected includes additional information on individual and community-level preparedness, and local and national agency response.
Tornado Risk Perception and Preparedness
Despite a long history of tornado activity in the region, preliminary data indicate that prior to the 2020 tornados, many interviewees did not perceive a serious tornado risk in their area. According to one, they “didn’t know how serious things were here” regarding storms, and another stated that when it comes to storms “you just kind of are like, oh, whatever. It’s a tornado watch or whatever, and it doesn’t really mean anything.” There was widespread perception that the likelihood of tornados occurring was very small. While some interviewees referenced the 1974 tornado event, few reflected on more recent tornados that affected the area. The perception that tornados occurred in the distant past, rather than posed as a current risk, may influence risk perception, and therefore, preparedness efforts.
After the March 2020 tornados, community members and organizations involved in rebuilding and preparedness reported higher increased interest in homes with basements, which are less common in the south than in other regions of the United States (U.S. Census Bureau, 202043), weather radios, and storm shelters. These new interests and demands suggest the disaster had increased the public’s perception of risk from tornados, especially among individuals directly impacted. To illustrate, a survivor who lost their home and decided to move to a new location instead of rebuilding explained in an interview that “we went over to a friend's house and we looked at their storm shelter. So we’ll be purchasing one of those to put in my garage.” Regarding weather radios, another survivor stated, “I got on Amazon, and I bought one of them $28 emergency weather radios after that because every time it thundered, I was having a panic attack. And so I got that radio, and twice already it’s woke me up, and it was tornado warnings, and they were on the ground. So I didn’t even hesitate. I just went straight to the basement.” Another survivor looking to purchase a different home noted, “I'll say how expensive the home is what's most important, but I am thinking a lot more about does the house have a basement? Does the house have somewhere that's safe to go to which is probably something I wouldn’t have thought of previously.”
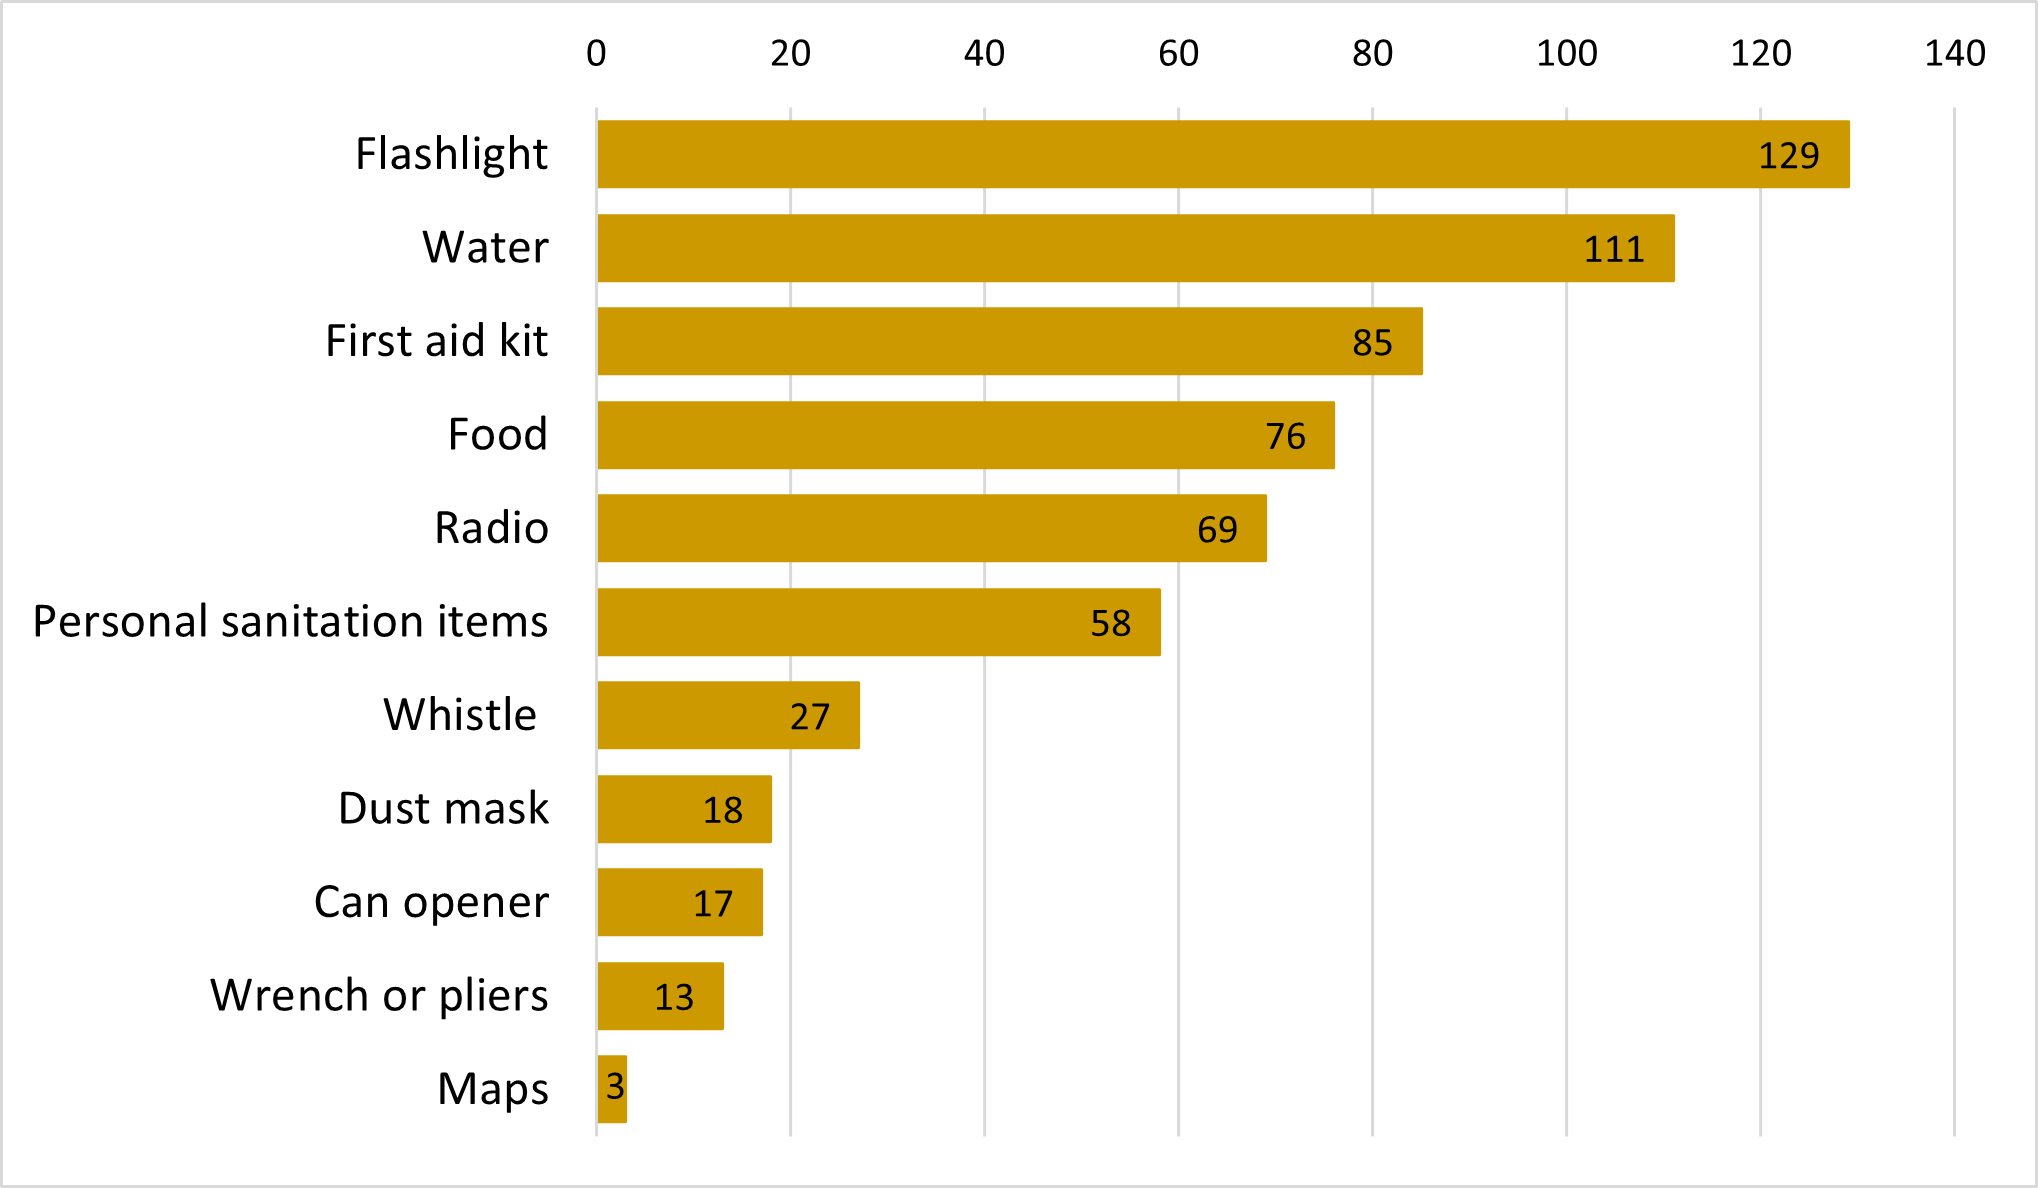
This data is consistent with initial review of the survey results: 221 out of 265 survey participants who have experienced a tornado in their lifetime reported an increased sense of tornado risk after the disaster event. When examining preparedness data, initial observations indicating ownership of disaster preparedness kits amongst respondents showed that prior to the tornados, only 9% of respondents had a kit, while 47% of respondents had a kit after the tornados (See Figure 1).Endnote 1 Utilizing the Ready.gov emergency preparedness kit checklist, survey respondents were also asked to report which items (if any) they had in their disaster emergency kit (See Figure 2). The five most frequently identified items in the kit were a flashlight (129), water (111), first aid kit (85), food (76), and a radio (69). Among interviewees who survived the destruction of their homes, several suggested having shoes in the disaster kits, as evacuating ground zero barefoot proved difficult.
Figure 1. Tornado Preparedness Methods/Strategies Before and After the March 2020 Tornados
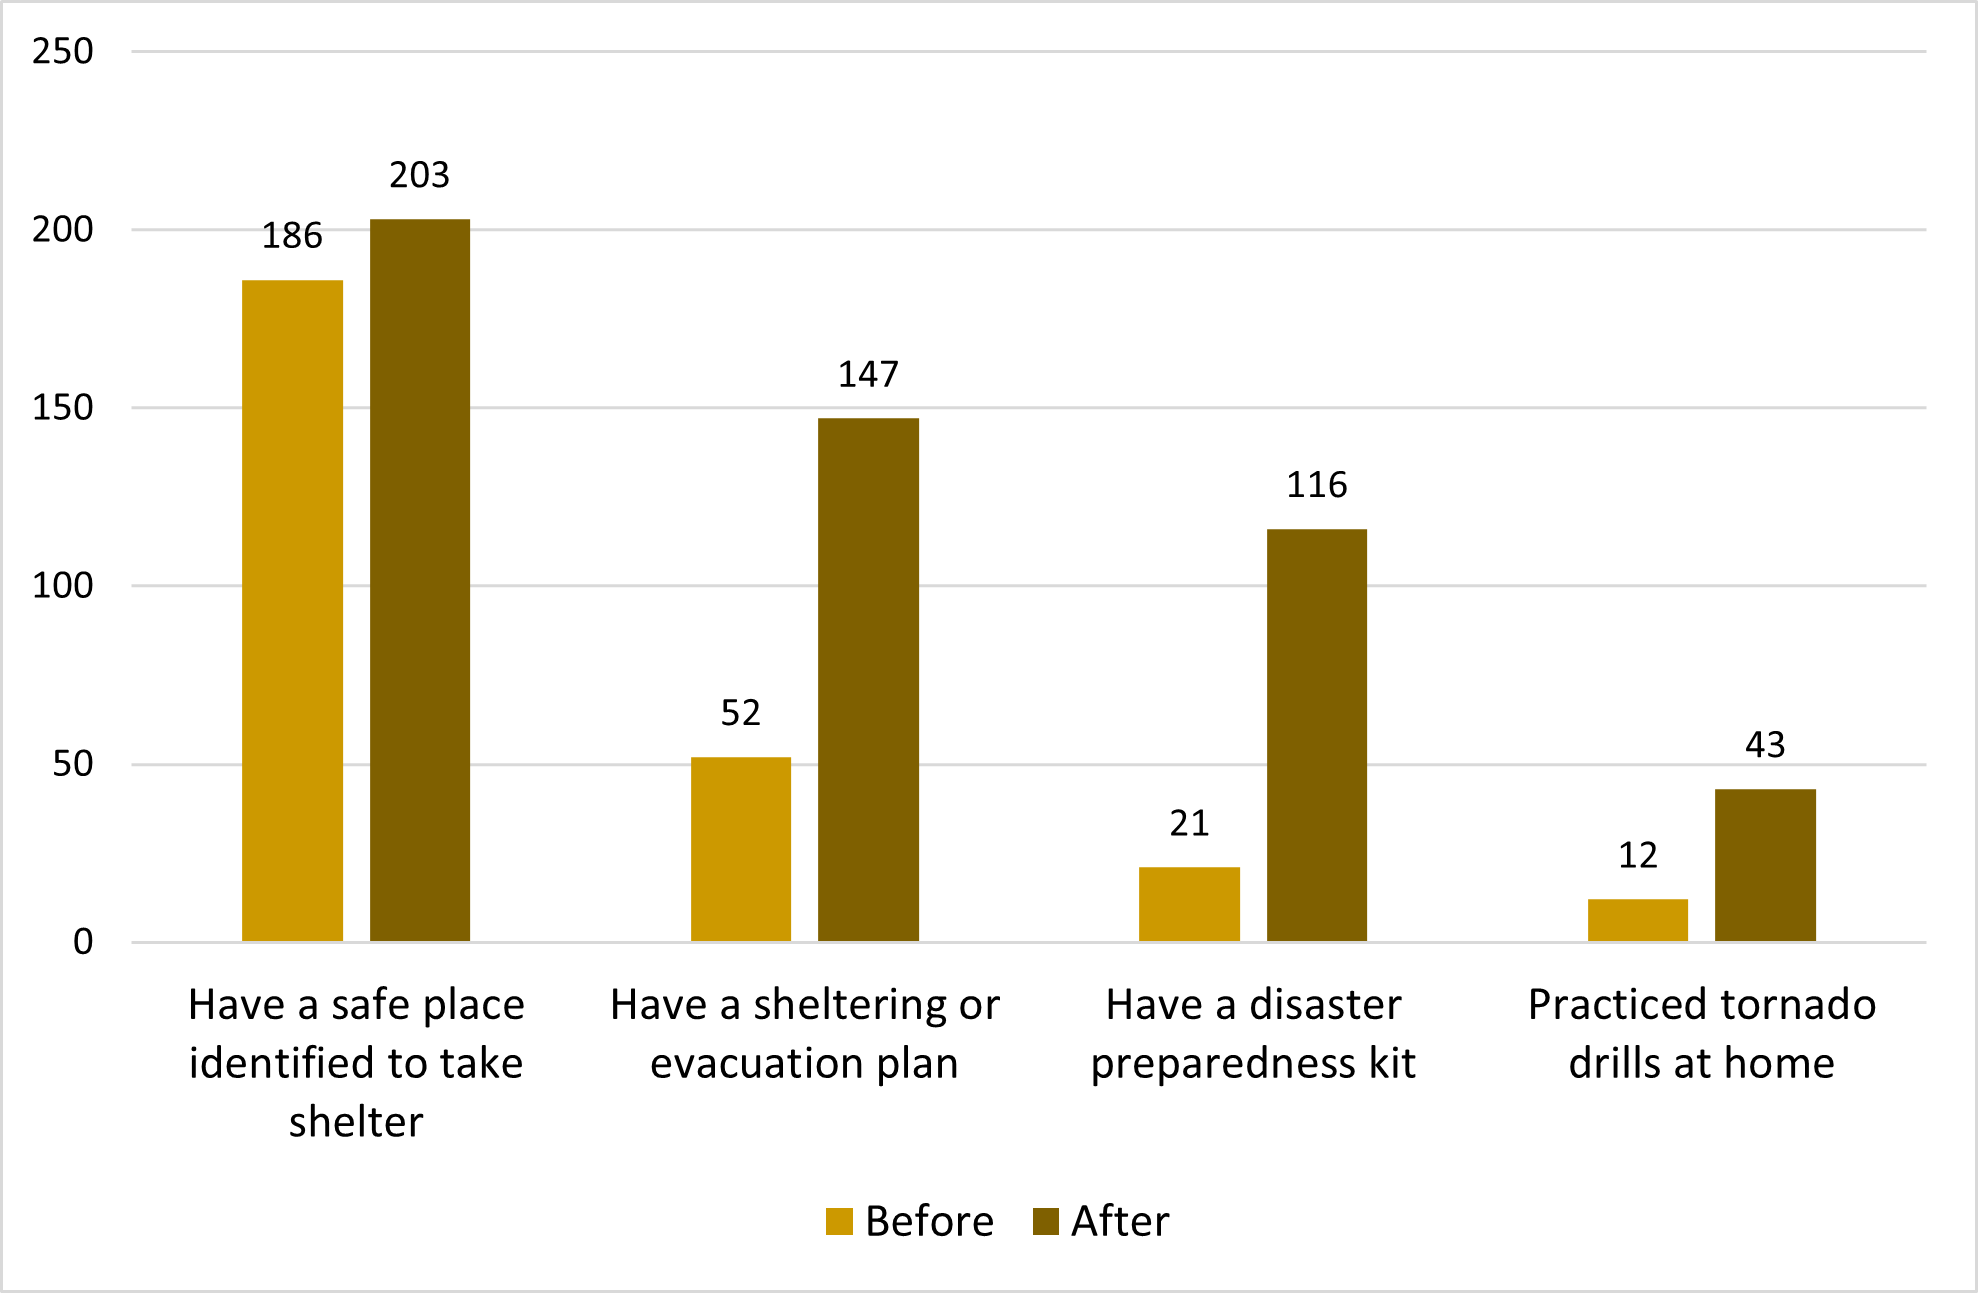
Figure 2. Disaster Preparedness Kit Items Identified by Survey Respondents
To provide another example of preparedness behaviors, 21% of respondents had a sheltering/evacuation plan before the tornados, while 60% had a shelter/evacuation plan after the tornados. However, overall, these data indicate many respondents still do not have a sheltering plan (approximately 40%) or a disaster preparedness kit (approximately 53% of respondents).Endnote 2 Preparedness behaviors also came to light in interviews, as well as how differential experiences may influence risk perceptions. For example, one survivor who lives in a mobile home with extended family, specifically mentioned that after their direct experience with a tornado while driving, the individual developed a tornado response plan and hoped to be able to afford a weather radio in the future; however, the survivor experienced frustration at family members who still perceived the risk to be low. After the 2020 tornado outbreak, some interviewees, like the aforementioned survivor’s family, also expressed low likelihood of future tornados directly affecting them or their community. One participant, for example, remarked, “And also, [the likelihood of a tornado] happening here in the first place was extremely small. You know, something that big happens in the middle of the night was apparently like a weather mystery.”
Prior to the 2020 tornados, Putnam County had recently implemented an Emergency Operations Center (EOC), and while it had not yet officially opened, it was used in the response coordination. In the months before the tornado event, representatives from responding agencies had worked together to plan the EOC and its role in centralizing emergency operations. The rapport and relationship building among agencies prior to the disaster was reported by diverse stakeholders as essential in providing a rapid, effective, and coordinated response. One government official coordinating at the county level in affected areas noted how they “have a great relationship” with other key stakeholders in the immediate response and recovery efforts; they could work effectively with individuals they “trusted to work through this together” because of what they describe as a “tight-knit community” and the strong relationships that result from that environment. In the immediate aftermath, the Upper Cumberland region—comprised of 14 counties—sent ambulances, fire trucks, and other resources to affected areas to assist in the recovery. These resources came in “automatically, they didn’t even ask, they just came.”
Emergency Communications
Focusing on preparedness, this study also examined inclement weather alerts and responses, as well as strategies for post-disaster communication among stakeholders. Weather warnings presented several challenges in middle Tennessee. Survey data revealed the public used of an array of warning systems to receive weather alerts. The most frequently used alert systems included phone weather apps (76%), text alerts (65%), weather radio (56%), tornado warning phone app (53%), television news (50%), and tornado sirens (46%). When asked specifically about how they received an alert about the March 2020 tornados, 34% of survey respondents received a text alert, 21% heard tornado sirens, 21% received an alert through a general weather app on their phone, and 16% were made aware of inclement weather via television news.
While survey data shows heavy reliance on text alerts and phone apps, there was also expressed frustration about cell phone alerts that were never received or received too late to benefit residents during the 2020 tornados. Many that received an alert had limited time to respond, ranging from “a few seconds,” “about a minute,” to three to five minutes. Survey respondents added commentary regarding alerts during the 2020 event, noting “warning came through on the phone minutes after it was already directly hitting us” and “the message said we had fifteen minutes to take cover however our house was gone in the next minute.” Similarly, some interview participants described warnings with little to no lead time, as one participant explained, “I said, ‘it says tornado warning.’ He said ‘no it wasn’t,’ his [phone] told him nothing. And so he grabbed it from my hand and he looked at it and sure enough. And so we had three minutes.”
About 26% of survey respondents did not receive a warning about the tornados. Some of those respondents indicated this was a result of storm impacts on cellular phone service, stating “towers were taken out” and “signal down.” One interviewee also stated, “from what I understand is the cell phone towers got knocked out, so there was no cell service. So we didn't get any alerts or anything.” While inclement weather can compromise phone service, residents in more rural areas may experience a general lack of access to reliable cellular phone service, as one interviewee explained, “We don't get cellular service inside our house; outside we get maybe one or two bars at most” and “There's a dead zone down that road, so … if one happens and you're like in that area, there's not going to be any notification. That's what happened to me.”
When individuals received an alert, 53% of survey participants responded that they check their television, radio, or internet to see if they are likely to be affected by an alert, while 38.5% would immediately take shelter in areas such as a basement, storm shelter, or other enclosed space (i.e., hallway or bathroom without windows). Many interviewees shared that they ignored sirens, phone alerts, and other inclement weather warnings. This phenomenon of disregarding warnings and alerts has been associated with the “false alarm effect;” if the warnings are too frequent, they may be ignored. For example, one survivor stated, “I heard the phone … alerts go off and I kind of pulled the blanket over my head … We all heard the weather warnings go off before and always for me it has never been anything.”
Responses to warnings may be shaped by housing type and access to shelter. Of the 10 survey respondents that indicated they live in a mobile home, one explained, they have “nowhere to go except the hall.” One hundred and eighty-four of survey respondents (82%) indicated they live in fixed single or multi-storied homes, 41.5% stated that they have access to a basement or storm shelter either in or near their home, and 42% have a place of employment with a basement, storm shelter, or safe room for inclement weather. Most interviewees lived in permanent homes, and while some had access to a basement, others noted they took shelter in a bathtub, interior bathroom, or just “ran in the dark and took cover as much as [they] could.”
Lack of power, cellular phone service, and internet due to storms and/or everyday living conditions posed a challenge for emergency communication and should be considered in disaster preparedness plans. Additionally, after the March 2020 tornados, over 20% of survey respondents remained “unsure” about who to reach out to for assistance after a tornado, which is key information to be communicated by organizations involved in disaster preparedness outreach. According to those surveyed about preparedness outreach, the most effective method for sharing preparedness information is social media (42%), followed by television (19%), the internet (13%), and radio (9%). Comparatively, the newspaper, mail, email, fact sheets or brochures, workshops and meetings, and magazines scored low among participants. The survey also indicated the public’s preferred source for preparedness information is the fire department or rescue (63% of participants) followed by the American Red Cross (38%) and a government agency (33%). Other options provided to survey participants, including utility company, insurance agent or company, university or research institution, a school, nonprofit organizations, or religious groups all received between 10-17% of responses.
Interviews provided some data on post-disaster communication. While survey results indicate that social media is considered an effective method for preparedness outreach, interviewees shared concerns about the use of these platforms for survivors during disaster aftermaths. According to one interviewee reflecting on the Cookeville Strong Facebook page—a page created after the tornados to disseminate information to the community—“The Cookeville Strong group was really great in the few weeks after. It was great for finding things, sharing recovery stories; it was not great for communicating to survivors. It hit a wall where people weren’t finding things [in the page] because there were too many people.” As of December 2020, this public page had 26,000 members, making it difficult to track information.
Interviews also revealed an improvised strategy used by Putnam County for communication that utilized the local Public Broadcasting Service (PBS) station, making information accessible to those living without the internet, cellular phones, or cable television. Other post-disaster emergency communication strategies sourced in the data included in depth information on response planning, coordinating access to ground zero, and implementing human remains recovery and identification. For example, an unprecedented number of volunteers arrived in the days following the Tennessee disaster, which presented challenges that were not anticipated in agency response preparedness.
Qualitative and quantitative data provide rich perishable information on behaviors of community members, response agencies, non-profit organizations, and other stakeholders situated in rural and semi-rural areas of the southeastern United States. Preliminary findings focused on risk perceptions, preparedness, and the role of emergency communications are only touched on in this report, yet implications for policy and practice can be seen.
Discussion and Conclusions
Tornado Risk Perception and Preparedness.The present study has several implications for practitioners in emergency preparedness and management in rural and semi-rural areas. Both interview and survey data indicate increased risk awareness after the 2020 tornados, especially among those with direct experiences with tornados. Survey data suggest the public increased its preparedness in the wake of the 2020 event in the form of disaster kits, drills, and response plans. Highlighting continued preparedness challenges, however, interviews also reveal continued beliefs among some community members that tornados are rare in the region, and that the 2020 outbreak was an anomaly. Although further analysis is needed, these risk perception disparities may be related to different experiences with tornados, as well as differential accounting of past tornado events (e.g., memory of larger and more destructive tornados, but not smaller, less fatal occurrences).
This is consistent with other studies which have shown that personal experience with a disaster is associated with increased risk awareness, although there may be variability due to differences in direct experiences and the frequency of events (Castañeda et al.44, 2020; Drost, 201345; Mulilis et al., 200646). While direct experiences with tornados can result in increased awareness and preparedness, regular and personalized preparedness and risk communication strategies may be useful in accounting for differential experiences and memory in the region.
Local emergency management agencies may have limited resources to support preparedness work, but where possible, we strongly recommend agencies work with extant community groups and organizations to increase the awareness of potential tornado risk in their area. Survey respondents shared that social media, television, the internet, and weather radio were respectively the most effective form of outreach for preparedness and also indicated that preferred sources of information were fire and rescue services, aid organizations, and government agencies. Our survey highlights the importance of outreach through these platforms and organizations; however, most survey respondents were below the age of 60. Older adults, as well as adults in more rural Appalachian areas of the region, may rely less on social media or have limited access to internet and smartphone service (Madden, 201047; Pollard & Jacobsen, 201948). Increasing the perceived risk of tornados in rural and semi-rural areas of the southeastern United States is becoming more salient as the region continues to see nocturnal tornados of increasing size and strength due to the effects of climate change (Agee et al., 2016; Gagan et al., 2010; NOAA, 2020).
Most of our survey respondents live in fixed, permanent homes but over half indicated they do not have access to a basement or storm shelter. Most of the fatalities and housing destruction in the EF-4 zone of the March 2020 tornados occurred in fixed, permanent homes (National Weather Service, 2020), illustrating the limitations of some shelter-seeking behaviors during the most severe tornados, such as sheltering in interior rooms of permanent structures (Mason & Senkbeil, 2014). Preparedness strategies by state and local governments should consider federal assistance for safe sheltering for diverse housing situations, such as the Federal Emergency Management Agency’s [FEMA] safe room funding and other assistance (FEMA, 202049), ensure that building codes are in place and updated, and incentivize construction practices for housing and development projects that can reduce damage or delay structural collapse the face of strong winds and tornados (Henderson et al., 202150).
Emergency Communications. Respondents expressed concern about unreceived or late warnings: some warnings were not received at all because of cell tower damage or the respondent lived outside of cellular service; other warnings were received one to five minutes before, during, and after the event, limiting their efficacy. Walters and colleagues (2020) have demonstrated the barriers to receiving a warning, which included lack of access to warning technologies (e.g., electricity, weather radio), heavy sleeping, and hearing impairment. Considering the disruption of communication towers during the 2020 tornados, reliance on cell phone warnings alone may not be adequate. Stakeholders in emergency preparedness and warning systems should thus consider how to expand access to and knowledge of warning systems in rural areas where access is currently limited (e.g., outside of cellular range), and for individuals who are not socioeconomically positioned to invest in tornado preparedness equipment (e.g., weather radio).
A previous study in Tennessee also demonstrated that tornado warnings sent at night are less likely to be received, as people are engaged with fewer warning sources and receive fewer social and environmental cues at night, although those who have previous tornado experience were more likely to receive nocturnal tornado warnings (Mason et al., 2018). Multiple formal and informal warning sources, such as outreach via personal contacts, may help facilitate receipt of nighttime warnings, especially warning systems designed to wake the sleeping and alert hard-of-hearing individuals (Brotzge & Donner, 2013; Mason et al., 2018).
While research at the national level suggests that the “false alarm effect” (i.e., perception that the alerts never result in a tornado and thus it is likely a false alert) results in warning complacency (Trainor et al., 201551), or that the desensitization to alerts, alarms, and warnings results in the tendency for people to receive a warning and look out the window or call a neighbor rather than to immediately take shelter (Breeden, 201252), a study specific to the southeastern United States proposes that false alerts may not predict protective behavior (Lim et al., 201953). Preliminary analysis of our survey data indicates that people mostly responded to alerts by checking news sources to evaluate risk levels, while many others immediately engaged in some level of protective behavior. Of the two who did not respond to alerts, it was due to lack of access to shelter and long lead times. In some interviews, however, people did not engage in protective behavior due to the frequency of various types of cell phone alerts (e.g., Amber Alerts). Warning personalization, outreach to cultivate public understanding of tornado frequencies (and thus alarms) in the southeastern United States, and promotion of weather specific warning devices may help mitigate desensitization.
A final implication for practice we highlight is the importance of strong relationships among emergency management and the various recovery organizations that respond to a disaster, as we have witnessed in other disaster contexts (see Reinke & Eldridge, 202054). Interviewees working in the field repeatedly shared how their extant relationships (i.e., government, emergency managers, hospitals, nonprofits, media), and the trust that comes with them, enabled workers to quickly find needed resources and collaborate throughout response and recovery. This was reflected in survivor interviews as well, as they noted how the community came together and leaders were seemingly able to work collectively for the good of survivors during the response, cleanup, and recovery periods. In some cases, having a physical space where stakeholder agencies can work collaboratively is beneficial. For example, Putnam County opened their Emergency Operations Center—a physical space where emergency agencies could collaborate in a single large room together—just before the tornados hit. An EOC allows all key decision-makers and resource-providers to share one space, facilitating communication, particularly amid the loss of communication towers. Where building an EOC is not possible, fostering collaborative relationships among government decision makers (e.g., mayors), emergency responders (e.g., EMA, fire and rescue), nonprofits (e.g., American Red Cross, National Voluntary Organizations Active in Disasters members), and other state and federal groups (e.g., state-level EMA, National Guard, FEMA) is perceived by our interviewees as key to response efficiency (which could save lives) and long-term success. Such collaborations also have implications for strengthening risk and preparedness communications.
Limitations and Strengths
This study included a diversity of participants including emergency responders, political decision makers, media representatives, and survivors, adding significant depth and breadth of information to our study. Our connections to the region and sampling strategy enabled us to select unique cases for interviews. While we consider purposive sampling to be a strength of this study insofar as it provided a unique data set of diverse stakeholders, our other sampling strategy, snowball, introduced potentially significant sample bias that cannot be easily measured. Selection bias is present, with implications for the generalizability of this study. Despite this limitation, snowball sampling was beneficial in a semi-rural region that quickly became saturated with non-community members driving through damaged areas for pictures, as well as scammers and others attempting to gain from the disaster. Snowball sampling was one way to overcome the initial distrust some potential research participants may have felt in areas where individuals feel exploitation of suffering has occurred. Regardless of this potential benefit, both purposive and snowball sampling are non-representative strategies which limits the generalizability of study findings.
The survey respondents reflect those individuals who had access to a smartphone with internet or a cell signal, and/or those with access to a computer and stable internet. The resulting survey population reflects sample bias based upon technology access, in addition to the expected variation in individual interest and willingness to complete the survey. This is particularly important given the expressed concerns of interview participants about cell phone coverage in their areas—our survey may have missed key groups who otherwise could have provided important insights.
A core strength of this research was the interdisciplinary and explicitly practice-informed approach, which oriented the interview and survey design. The research team collaborated with the Putnam County EMA to formulate survey questions that met their interests and needs in tornado preparedness and risk awareness, which will culminate in a findings report to be delivered to the EMA in spring 2022.
Endnote 1: Provided percentages reflect slight differences in the number of respondents per question; 242 respondents answered the “before” question regarding tornado preparedness methods/strategies, while 246 respondents answered the “after” question. This total number of respondents also shows that about 60 of 303 respondents did not answer either question.↩
Endnote 2: Provided percentages reflect slight differences in the number of respondents per question. Please note that nearly 20% of survey respondents did not provide an answer to these questions.↩
References
-
Mason, L.R., Ellis, K.N., Winchester, B., & Schexnayder, S. (2018). Tornado Warnings at Night: Who Gets the Message? Weather, Climate, and Society, 10(3), 561-568. ↩
-
Walters, J.E., Mason, L.R., Ellis, K., & Winchester, B. (2020). Staying Safe in a Tornado: A Qualitative Inquiry into Public Knowledge, Access, and Response to Tornado Warnings. Weather and Forecasting, 35(1), 67-81. ↩
-
Brotzge, J. & Donner, W. (2013). The Tornado Warning Process: A Review of Current Research, Challenges, and Opportunities. Bulletin of the American Meteorological Society, November. ↩
-
Choi, J. & Wehde, W. (2020). Trust in Emergency Management Authorities and Individual Emergency Preparedness for Tornadoes. Risk, Hazards & Crisis in Public Policy, 11(1), 12-34. ↩
-
Sherman-Morris, K. (2005). Tornadoes, Television and Trust – A Closer Look at the Influence of the Local Weathercaster During Severe Weather. Environmental Hazards, 6, 201-210. ↩
-
Wachinger, G. Renn, O., Begg, C. & Kuhlicke, C. (2013). The Risk Perception Paradox—Implications for Governance and Communication of Natural Hazards. Risk Analysis, 33(6), 1049-1065. ↩
-
National Severe Storms Laboratory. (n.d.). Severe Weather 101. https://www.nssl.noaa.gov/education/svrwx101/tornadoes/ ↩
-
Anderson-Frey, A.K., Richardson, Y.P., Dean, A.R., Thompson, R.L., & Smith, B.T. (2019). Characteristics of Tornado Events and Warnings in the Southeastern United States. Weather and Forecasting, 34, 1017-1034. ↩
-
Kincer, J. (1936). Tornado Disasters in the Southeastern States, April 1936. Monthly Weather Review, 64(5), 168–171. https://doi.org/10.1175/1520-0493(1936)64<168:TDITSS>2.0.CO;2 ↩
-
Nunn, R. (1921). Tornadoes, with Special Reference to Those That Have Occurred in Tennessee. Annual Address of the Retiring President. Tennessee Academy of Science, Nov. 25. ↩
-
Dixon, P.G., Mercer, A.E., Choi, J., & Allen, JS. (2011). Tornado Risk Analysis: Is Dixie Alley and Extension of Tornado Alley?. Bulletin of the American Meteorological Society, 92(4), 433-441. ↩
-
Gagan, J.P., Gerard, A. and Gordon, J. (2010). A Historical and Statistical Comparison of ‘Tornado Alley’ to ‘Dixie Alley’. National Weather Digest, 34(2), 146-155. ↩
-
Coleman, T.A. & Dixon, P.G. (2014). An Objective Analysis of Tornado Risk in the United States. Weather and Forecasting, 29, 366-376. ↩
-
Ashley, W.S., Krmenec, A.J., & Schwantes, R. (2008). Vulnerability Due to Nocturnal Tornadoes. Weather and Forecasting, 23(5), 795-807. ↩
-
Kis, A.K. & Straka, J.M. (2010). Nocturnal Tornado Climatology. Weather and Forecasting, 25(2), 545-561. ↩
-
Sherburn, K.D. & Parker, M.D. (2014). Climatology and Ingredients of Significant Severe Convection in High-Shear, Low-CAPE Environments. Weather and Forecasting, 29(4), 854-877. ↩
-
Childs, S.J., & Schumacher, R.S. (2018). Cold-season Tornado Risk Communication: Case Studies from November 2016 to February 2017. Weather, Climate, and Society, 10(3), 419-433. ↩
-
Ashley, W.S. (2007). Spatial and Temporal Analysis of Tornado Fatalities in the United States: 1880-2005. Weather and Forecasting, 22(6), 1214-1228. ↩
-
Brooks, H.E., Doswell, C.A, III., & Kay, M.P. (2003). Climatological Estimates of Local Daily Tornado Probability for the United States. Weather and Forecasting, 18(4), 626-640. ↩
-
Agee, E., Larson, J., Childs, S., & Mamo, A. (2016). Spatial Redistribution of U.S. Tornado Activity. Journal of Applied Meteorology and Climatology, 55(8), 1681-1697. ↩
-
Brown, V.M., Ellis, K., & Bleakney, S. (2016). Tennessee Tornado Climate: A Comparison of Three Cities. Southeastern Geographer, 56(1), 118-133. ↩
-
Ellis, K.N., Mason, L.R., Gassert, K.N., Elsner, J.B., & Fricker, T. (2018). Public Perception of Climatological Tornado Risk in Tennessee, USA. International Journal of Biometeorology, 62,1557-1566. ↩
-
Ellis, K.N., Burow, D., Gassert, K.N., Mason, L.R., & Porter, M.S. (2020). Forecaster Perceptions and Climatological Analysis of the Influence of Convective Mode on Tornado Climatology and Warning Success. Annals of the American Association of Geographers, 110(4), 1075-1094. https://doi.org/10.1080/24694452.2019.1670042 ↩
-
Liu, B.F., Egnoto, M., & Lim, J.R. (2019). How Mobile Home Residents Understand and Respond to Tornado Warnings. Weather, Climate, and Society, 11, 521-534. ↩
-
Strader, S.M. & Ashley, W.S. (2018). Finescale Assessment of Mobile Home Tornado Vulnerability in the Central and Southeast United States. Weather, Climate, and Society, 10, 797-812. ↩
-
Chaney, P.L, & Weaver, G.S. (2010). The Vulnerability of Mobile Home Residents in Tornado Disasters: The 2008 Super Tuesday Tornado in Macon County, Tennessee. Weather, Climate, and Society, 2, 190-199. ↩
-
Mason, J.B. & Senkbeil, J.C. (2014). Implications of the 2011 Tuscaloosa EF4 Tornado for Shelter and Refuge Decisions. Natural Hazards, 74, 1021-1041. ↩
-
National Oceanic and Atmospheric Administration. (2020). Average Annual Number of EF3-EF5 Tornadoes Per 10,000 Square Miles. National Oceanic and Atmospheric Administration. https://www1.ncdc.noaa.gov/pub/data/cmb/images/tornado/clim/avg-ef3-ef5-torn1991-2010.gif ↩
-
Klockow, K.E., R.A. Peppler, & R.A. McPherson. (2014). Tornado Folk Science in Alabama and Mississippi in the 27 April 2011 Tornado Outbreak. GeoJournal, 79(6), 791. ↩
-
Paul, B.K., Brock, V.T., Csiki,S. & Emerson, L. (2003). Public Response to Tornado Warnings: A Comparative Study of the Mary 4, 2003 Tornados in Kansas, Missouri, and Tennessee. National Hazards Center Quick Response Reports, QR 165. ↩
-
Schumacher, R.S., Lindsey, D.T., Schumacher, A.B., Braun, J., Miller, S.D., & Demuth, J.L. (2010). Multidisciplinary Analysis of an Unusual Tornado: Meteorology, Climatology, and the Communication and Interpretation of Warnings. Weather and Forecasting, 25(5), 1412-1429. ↩
-
Stokoe, R.M. (2016). Putting People at the Centre of Tornado Warnings: How Perception Analysis Can Cut Fatalities. International Journal of Disaster Risk Reduction, 17, 137-153. ↩
-
Greening, L. & Dollinger, S.J. (1992). Illusions (and Shattered Illusions) of Invulnerability: Adolescents in Natural Disaster. Journal of Trauma Stress, 5(1), 63-75. ↩
-
McClure, J., Johnston,D., Henrich, L., Milfont, T.L. & Becker, J. (2015). When a Hazard Occurs Where It Is Not Expected: Risk Judgments About Different Regions After the Christchurch Earthquakes. Natural Hazards, 75(1), 635-652. ↩
-
García-Hernández, C., Ruiz-Fernández, J., & González-Díaz, B. (2018). Inherited Memory, Social Learning, and Resilience: Lessons from Spain’s Great Blizzard of 1888. Geographical Research, 57(2), 189-203. ↩
-
Viglione, A., Di Baldassarre, G., Brandimarte, L., Kuil, L., Carr, G., Salinas, J.L., Scolobig, A., & Blöschl, G. (2014). Insights from Socio-Hydrology Modeling on Dealing with Flood Risk—Roles of Collective Memory, Risk-Taking Attitude and Trust. Journal of Hydrology, 518, 71-82. ↩
-
Demuth, J.L., Morrow, B.H. & Lazo, J.K. (2009). Weather Forecast Uncertainty Information. Bulletin of the American Meteorological Society, 90(11), 1614-1618. ↩
-
National Oceanic and Atmospheric Administration. (2016). Risk Communication and Behavior: Best Practices and Research Findings. https://www.performance.noaa.gov/wp-content/uploads/Risk-Communication-and-Behavior-Best-Practices-and-Research-Findings-July-2016.pdf ↩
-
National Weather Service. (2020). March 2-3, 2020 Tornadoes and Severe Weather. https://www.weather.gov/ohx/20200303 ↩
-
Firstnet Authority. (2020). FirstNet Helps Tennessee Public Safety Respond to Tornado Damage. https://firstnet.gov/newsroom/blog/firstnet-helps-tennessee-public-safety-respond-tornado-damage ↩
-
Kim, J.J., Eldridge, E.R., Reinke, A.J., & Williams, S. (2021). Digitally Shaped Ethnographic Relationships During a Global Pandemic and Beyond. Qualitative Research. https://doi.org/10.1177/14687941211052275 ↩
-
Oregon Natural Hazards Workgroup. (2007). Household Natural Hazards Preparedness Survey, Eugene, OR. ↩
-
United States Census Bureau. (2020). Survey of Construction. https://www.census.gov/construction/chars/ ↩
-
Castañeda, J.V., Bronfman, N.C., Cisternas, P.C., & Repetto, P.B. (2020). Understanding the Culture of Natural Disaster Preparedness: Exploring the Effect of Experience and Sociodemographic Predictors. Natural Hazards, 103, 1881-1904. ↩
-
Drost, R. (2013). Memory and Decision Making: Determining Action when the Sirens Sound. Weather, Climate, and Society, 5(1), 43-54. ↩
-
Mulilis, J., Duval, T.S., & Rogers, R. (2006). The Effect of a Swarm of Local Tornados on Tornado Preparedness: A Quasi-Comparable Cohort Investigation. Journal of Applied Social Psychology, 33(8), 1716-1725. ↩
-
Madden, M. (2010). Older Adults and Social Media. Pew Research Center. https://www.pewresearch.org/internet/2010/08/27/older-adults-and-social-media/ ↩
-
Pollard K. & Jacobsen L. (2019). Appalachia’s Digital Gap in Rural Areas Leaves Some Communities Behind. Population Reference Bureau. https://www.prb.org/appalachias-digital-gapin-rural-areas-leaves-some-communities-behind/ ↩
-
Federal Emergency Management Agency. (2020). Safe Room Funding. https://www.fema.gov/emergency-managers/risk-management/safe-rooms/funding ↩
-
Henderson, C., Huff, T., M.ASCE, & Bouton, G. (2021). Structural Observations and Tornado Damage Mitigation Concepts: March 2020 Tennessee Tornadoes. Practice Periodical on Structural Design and Construction, 26(2), 05021001. ↩
-
Trainor, J.E., Nagele, D., Philips, B., & Scott, B. (2015). Tornadoes, Social Science, and the False Alarm Effect. Weather, Climate, and Society, 7(4), 333-352. ↩
-
Bredeen, J. (2012). Go Ahead and Panic: Fear-Inspiring Tornado Warnings Designed to Overcome Apathy. Disaster Research: News You Can Use, DR 585. https://hazards.colorado.edu/article/go-ahead-and-panic-fear-inspiring-tornado-warnings-designed-to-overcome-apathy. ↩
-
Lim, J.R., Liu, B.F., & Egnoto, M. (2019). Cry Wolf Effect? Evaluating the Impact of False Alarms on Public Responses to Tornado Alerts in the Southeastern United States. Weather, Climate, and Society, 11(3), 549-563. ↩
-
Reinke, A.J. & Eldridge, E.R.. 2020. Navigating the ‘Bureaucratic Beast’ in North Carolina Hurricane Recovery. Human Organization, 79(2), 107-116. https://doi.org/10.17730/1938-3525.79.2.107 ↩
Reinke, A. J., Kim, J. J., & Eldridge, E. R. (2022). The March 2020 Tennessee Tornados: Risk Perceptions, Preparedness, and Communication (Natural Hazards Center Weather Ready Research Report Series, Report 2). Natural Hazards Center, University of Colorado Boulder. https://hazards.colorado.edu/weather-ready-research/the-march-2020-tennessee-tornados-risk-perceptions-preparedness-and-communication