Calculating the Social Vulnerability Index for Guam
Publication Date: 2021
Executive Summary
Overview
The U.S. Centers for Disease Control and Prevention (CDC) produces social vulnerability index (SVI) maps and estimates for all states. The CDC also provides a SVI and maps for Puerto Rico. However, the SVI remains to be constructed for Guam, a U.S. territory in the western Pacific. To narrow this gap, researchers sought to calculate the SVI for the municipalities and census designated places (CDPs) in Guam and assess SVI associations with select health indicators among Guam residents.
Research Design
The SVI was calculated using data from the 2010 Guam census following the CDC methodology to rank and identify the most vulnerable communities in Guam. Fifteen variables reflecting socioeconomic status, household composition and disability, minority status and language, and housing transportation were applied to the SVI calculations. A second set of adjusted SVI was calculated using a CDC-modified method incorporating additional Guam-specific characteristics on housing structure, communication capacity, and other relevant indicators, and were ranked separately for the 19 municipalities and 57 CDPs in Guam. Lastly, the SVI was applied to a data set of health indicators acquired through the 2011 Guam Behavioral Risk Factor Surveillance System (BRFSS), and the relationship between BRFSS variables and the CDC SVI and between the BRFSS variables and adjusted SVI were assessed.
Preliminary Findings
Applying both the SVI CDC and SVI-adjusted methods, Agat and Ukudu were the most vulnerable municipality and census designated place (CDP), respectively. Piti and Nimitz Hill were the least vulnerable municipality and CDP, respectively. Regarding health indicators, SVI was negatively correlated with binge-drinking, but not after applying the adjusted-SVI. Rankings were visualized using a geographic information system tool comparing the SVI CDC and SVI-adjusted methods. The adjusted indices are recommended as they innovatively redefine minority in the context of Guam’s ethnic composition and incorporate additional themes relevant to Guam’s vulnerability.
Dissemination
Preliminary findings were shared with community stakeholders during a virtual forum to gauge ideas for how the data can be used and disseminated. Stakeholders in attendance were representatives of mayoral and senatorial offices, academic institutions, the health department, the Bureau of Statistics and Plans (BSP), the Environmental Protection Agency (EPA), and more. During breakout group discussions, stakeholders voiced various ways the SVI data could be used and applied in program development, grant writing and application, public health and social services, community planning and research response, and in leveraging data-driven policy. Stakeholders encouraged research team members to disseminate the data widely to the public by utilizing mixed media platforms to aid in the visualization and comprehension of information being shared.
Conclusions
The preliminary findings provide the initial estimates of Guam SVI in multiple forms. The municipality-level indices useful for official local and national references to municipality boundaries. The CDP-level indices are useful to local policymakers and public health practitioners, as these indices provide the granular data identifying which communities have the greatest public health needs. Overall, SVI uptake by public and private entities in Guam is beneficial for local strategic planning and to inform practice, policy, and academic pursuits.
Introduction
Disasters disrupt normal conditions and result in excessive suffering in affected communities (World Health Organization, 20021). The extent of suffering is influenced by the community’s vulnerability—a dynamic concept measured in many ways, although the diversity is viewed as a “strength and sign of vitality” (Adger, 20062). Birkmann (20053) describes the concept of vulnerability in an organized five-layered system starting with intrinsic vulnerability (internal risk factors) and advancing to the fifth layer of multi-dimensional vulnerability (physical, social, economic, environmental, and institutional factors). There are numerous models on the measurement of the multiple dimensions of vulnerability, including social vulnerability led by Cutter and colleagues (Cutter et al., 20034). The dimensions of vulnerability have resonated in the public health field. The U.S. Centers for Disease Control and Prevention (CDC) developed a method to measure the social vulnerability index (SVI) (Centers for Disease Control and Prevention [CDC], 20185). The SVI is a number ranging from zero to one, with zero indicating the least vulnerability and one indicating the most vulnerability. The CDC SVI is used to determine the vulnerability of communities to disaster recovery based on social, economic, and demographic factors (Flanagan et al., 20116). The SVI was developed following the Pandemic and All-Hazards Preparedness Act of 2006 by the CDC Agency for Toxic Substances and Disease Registry’s Geospatial Research, Analysis & Services Program, and since has been used as a tool for emergency preparedness and planning, as well as recovery efforts among vulnerable communities following a disaster (Flanagan et al., 20187). The SVI may assist with allocating funds based on community shortages, estimating the number of supplies required in preparation for an emergency, identifying areas in need of emergency shelters, and aiding in evacuation plans for the elderly, disabled, and those with language barriers (CDC, 2018). Aside from emergency preparedness and disaster response, the SVI has been used to understand other health risk behaviors or conditions including teen pregnancy (Yee et al., 20198), chronic conditions (Nguyen et al., 20199), physical inactivity (An & Xiang, 201510), obesity (Freitas & Moraes, 201611), and more recently the novel coronavirus (Biggs et al., 202112) to name a few.
The U.S. CDC currently provides interactive SVI maps in addition to state-based and U.S.-based CDC SVI rankings for all states, which may be used for interstate county comparisons (one county to other counties in the U.S.) and intrastate county comparisons (one county to other counties in a particular state) (CDC, 202013). The CDC also produces state-based SVI and maps for Puerto Rico. However, the SVI remains to be constructed for Guam, a U.S. territory in the western Pacific. To narrow this gap, we propose to construct the SVI for the municipalities in Guam. The construction of SVI estimates is beneficial for local strategic planning by public and private sectors in Guam. Of immediate relevance is the Guam Comprehensive Emergency Management Plan (CEMP), which was developed in response to the Guam Civil Defense Act of 1951 and was revised in December 2016 (Guam Homeland Security Office of Civil Defense [GHS OCD], 201614). The plan defines the responsibilities of various government and non-government entities in the event of an island emergency. Among the list of purposes of the Guam CEMP is one to “reduce the vulnerability of people and their community” (GHS OCD, 2016). Once the Guam SVI is constructed, the estimates will be shared with the CEMP and other interested entities to inform practice, policy, and academic pursuits.
Methods
Research Questions
In this study, we sought to calculate the SVI for Guam to provide baseline estimates for the island. Additionally, the preliminary findings were shared with local stakeholders and feedback were obtained on the appropriate dissemination of the findings. We were guided by the following research questions.
- What are the SVI rankings for each of the 19 municipalities in Guam?
- Does ranking by census designated places (CDPs) impact the identification of vulnerable areas?
- Is SVI associated with selected health indicators among Guam residents?
- How can the data be used and disseminated in the community?
Study Site Description
This study was conducted in Guam, the southernmost island in the Marianas Archipelago in the Western Pacific and an unincorporated territory of the United States. Guam is made up of a diverse population, with 159,358 people residing in coastal, urban, and rural areas throughout the island (U.S. Census Bureau, 201415). Most of the population is concentrated in the Northern, more urban half of Guam, as well as in the central and western coasts (GHS OCD, 2016). The most populated area is the northern municipality of Dededo. In contrast, the southern portion of the island is mainly rural and consists of small villages interspersed along the coast (UGHS OCD, 2016. Those who reside in the southern villages account for 16% of the island’s total resident population and are especially prone to coastal hazards, floods, and wildfires (Bureau of Statistics and Plans [BSP], 201116). Furthermore, Guam is located 3,600 miles away from its closest state, Hawaii, and over 5,600 miles away from the continental United States (GHS OCD, 2016). Because of this isolation, Guam is dependent on seaports and airports, making it vulnerable to water related hazards (GHS OCD, 2016).
Guam is surrounded by a shoreline measuring approximately 152 miles (King et al., 201917). northern Guam is comprised of limestone, which holds the island’s primary aquifer, while southern Guam consists of volcanic rock and more significant erosion potential (King et al., 2019). Like other small islands, Guam is at an increased risk for environmental and social challenges that can be worsened by climate change (Barnett, 200118; Briguglio, 199519; Dahl, 199720; Hay et al., 200121; Mimura, 1999 as cited in King et al., 201922). Such challenges contribute to vulnerability and include limited size, geology, topography, and availability of natural water resources (Adger et al., 2007 as cited in King et al., 201923).
Data, Methods, and Procedures
Calculation of the SVI
The calculation of the Guam SVI was performed using the CDC methodology (CDC, 2018). The SVI measures a community’s vulnerability using 15 social variables from the census categorized into four themes: socioeconomic status, household composition and disability, minority status and language, and housing type and transportation described by the Agency for Toxic Substances and Disease Registry (Flanagan et al., 2018). In this study, data from the 2010 Guam census were provided by Guam Bureau of Statistics and Plans. Guam is divided into 19 municipalities with population size ranging from 3,808 (Agana Heights) to 44, 943 (Dededo) (Guam State Data Center & BSP, 201224). The Guam Bureau of Statistics and Plans (BSP) provided data at the CDP level that reflect units smaller than municipalities. The CDPs are statistical counterparts of incorporated places and are delineated to provide data for settled concentrations of population that are identifiable by name but are not legally incorporated under the laws of the state (U.S. Census Bureau, 2014). Guam is divided into 57 CDPs, which exclude 8,532 people and 2,846 housing units not in a census designated place (Guam State Data Center & BSP, 2012). The Guam municipalities and CDPs are depicted in Figure 1 with population counts in Table 1.
Figure 1. Map of Guam Showing the Municipality or Village Boundaries and the Census Designated Places (CDPs)
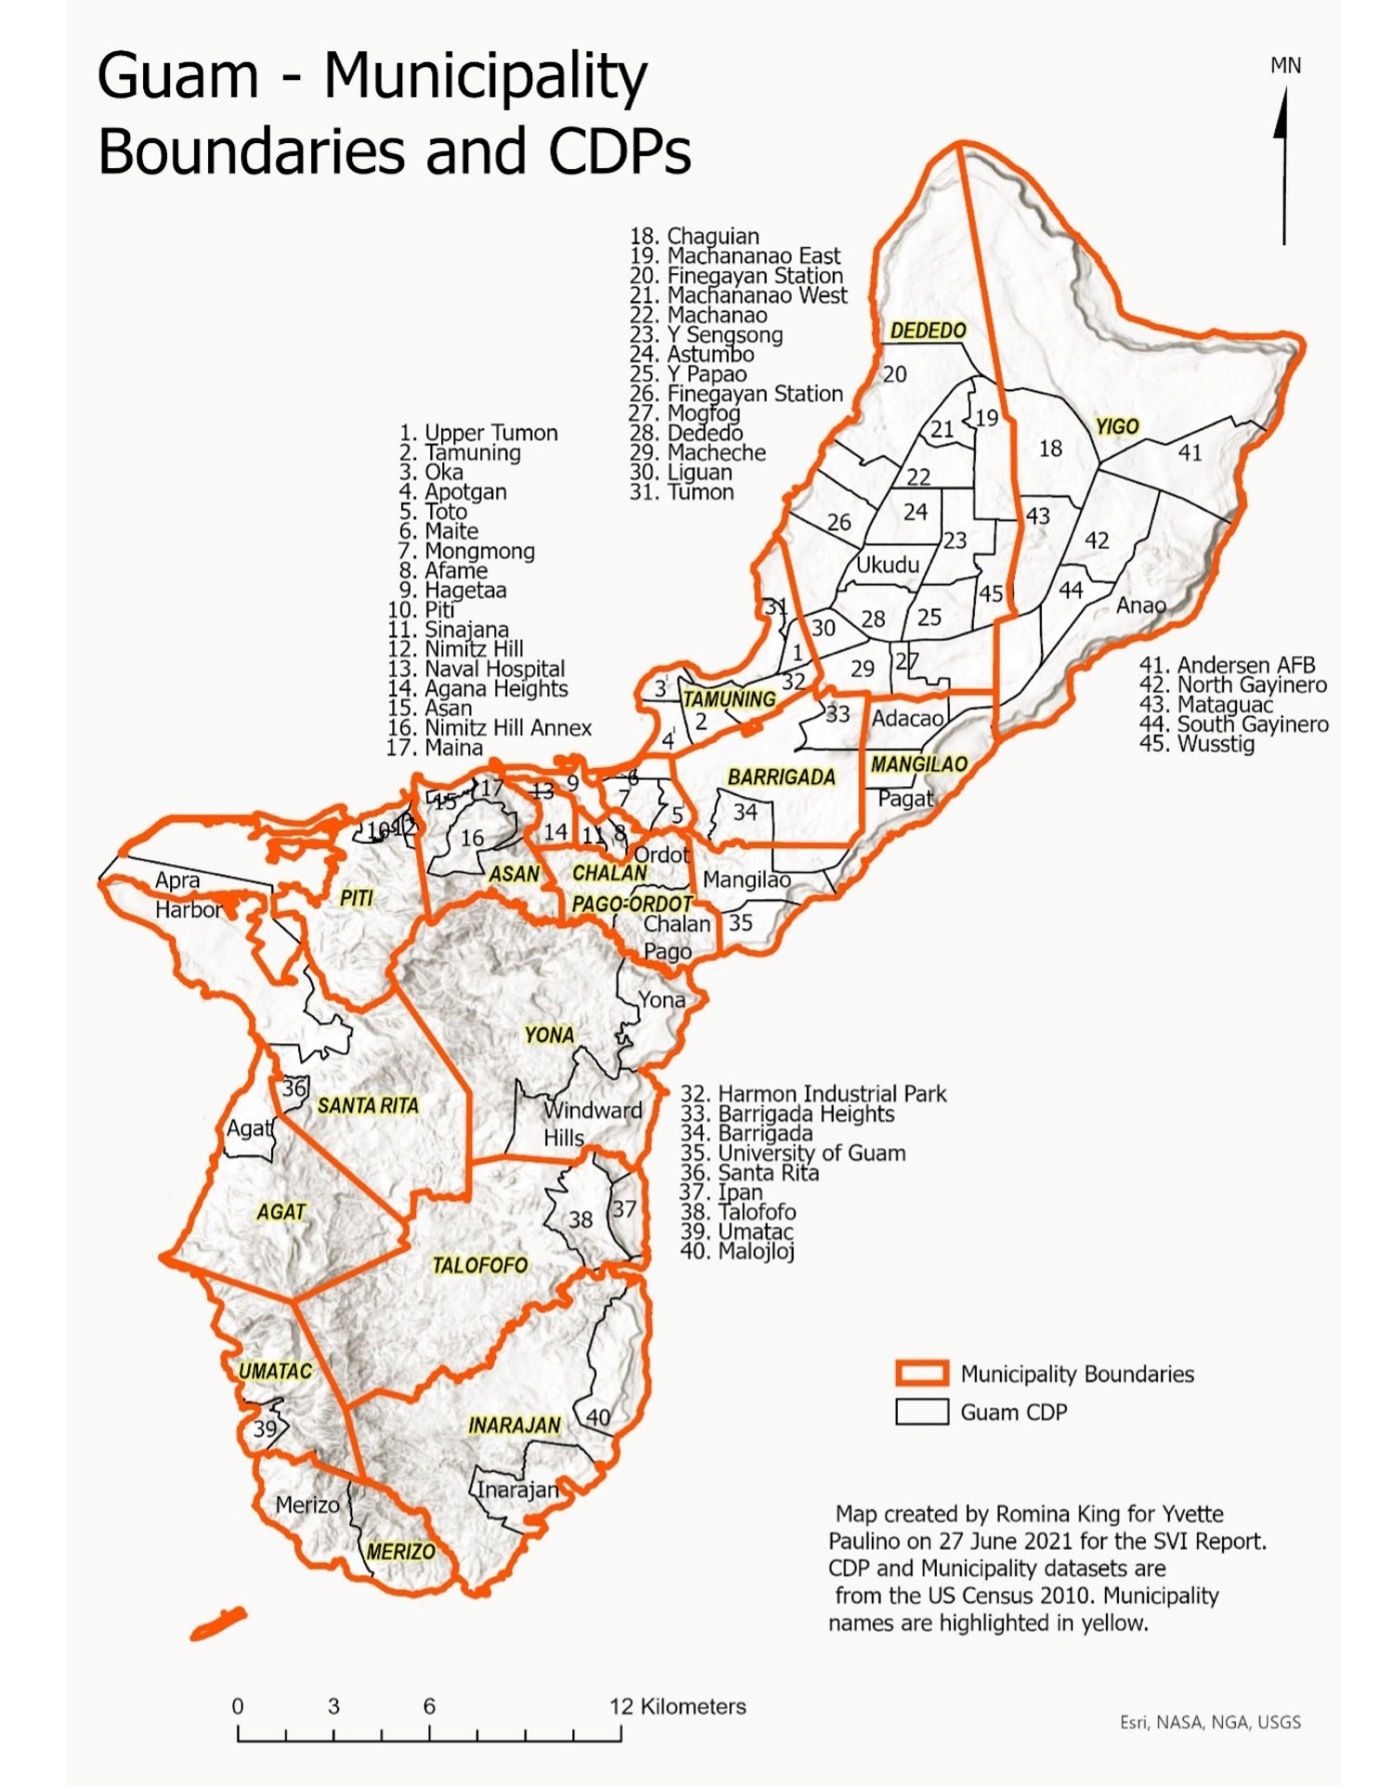
The analysis was done at the municipality and CDP levels. Rankings were performed among the 19 Guam municipalities and among the 57 CDPs. For each ranking, the SVI was calculated two ways. First, the overall SVI based on the sum of rankings of the 15 indicators from the CDC methodology (refer to Themes 1, 2, 3, and 4 in Table 2). Next, SVI calculations were adjusted by modifying the definition of the minority variable (Theme 3 Adjusted). According to the definition in the CDC methods, a minority is anyone who is not White, non-Hispanic. When using this definition, 14 villages had a percentage of minorities higher than 90%. The definition of minority was changed to anyone who is neither CHamoru nor Filipino, the two dominant ethnic groups in Guam. The diversity of other ethnic groups includes Caucasians, non-CHamoru Micronesians, Other Pacific Islanders, non-Filipino Asians, and mixed ethnicity. Migrant experiences may differ by ethnicity and location of settlement. For example, Compact of Free Association (COFA) residents defined as Micronesians migrating to Guam for opportunities via the Compact of Free Association with the United States have contributed to the island’s workforce and economy, but similarly to homelessness and encounters with the law (Hezel, 201325).
Principal component analysis (PCA) using a Varimax orthogonal rotation was run only on the 15 Guam-specific variables measured at the CDP level. PCA revealed a three-component solution, which explained 84.2% of the total variance. The rotated solution was used to group variables into three additional themes (refer to Themes 5, 6, and 7 in Table 2). The adjusted SVI was calculated based on the overall sum of ranking of all 30 variables including the adjusted minority variable, and the rankings were mapped using ArcGIS.
Selection of Guam-Specific Variables
Variables outside of the CDC methodology were selected among local data collected via the Guam census. While the U.S. Census Bureau uses the American Community Survey (ACS) to collect current housing and population estimates in the United States, the Island Areas (i.e., American Samoa, the Commonwealth of the Northern Mariana Islands (CNMI), the U.S. Virgin Islands) including Guam, uses the decennial census long form to obtain extensive housing and population data on their communities. A few years before a census is undertaken, Guam solicits local input and conducts a stakeholder review of the island’s existing census questionnaire. During the planning stages, government and community representatives review the census questionnaire long form and provide comments and recommendations on new subjects to include wording and questionnaire responses. The BSP receives local input from the stakeholders and provides recommendations to the U.S. Census Bureau on the census questionnaire. The U.S. Census Bureau determines inclusion or removal of census questions taking into consideration relevance and importance of the subject, justification, interview time, and respondent burden. Census subjects distinct to the island areas such as type of building materials used for walls and roof, telephone service availability, access to computer or laptop, internet use, and possession of battery-operated radios provide vital information on resources needed on hard-to-reach areas and communities vulnerable to disasters. Guam lies in a region with a high susceptibility to major storms and typhoons. Wooden and metal housing structures, for example, are at risk of severe structural damage due to destructive force winds and heavy rains resulting from a major tropical cyclone. Likewise, communities without battery-operated radios have little to no access to telephones or internet use and are less prepared and most vulnerable to disasters. Local leaders and emergency response officials use such information to effectively plan and respond to reach those communities where resources and support services are needed.
For Guam SVI adjusted calculations, the research team used Guam census variables (housing, wireless connection, other minority indicators) that are not included in the CDC methodology but may influence the ability to respond to stressors such as a typhoon. Characteristics of the Guam-specific variables are listed in Table 3. One third (33.6%) of Guam residents identify as non-CHamoru or non-Filipino and only a few (0.39%) speak no English. A sizable number of households are not connected to a public sewer system (32.5%) and have no plumbing (12.1%), no kitchen (11.5%), no concrete structures (nearly 20% without concrete walls, roof, or foundation), no wireless/connection (22.3% without a battery-operated radio and 25.3% without a computer or laptop), and no health insurance (17.1%). Moreover, a number are not U.S. citizens (12.8%), are foreign-born (20.4%), or send remittances abroad (27.6%).
Application of the SVI
The SVI was applied to a data set of health indicators acquired through the Behavioral Risk Factor Surveillance System (BRFSS) of 2011. The BRFSS collects annual data on health-related risk behaviors and chronic health conditions via a telephone survey in the United States and selected U.S. territories, including Guam (CDC, 202126). Data from the 2011 Guam BRFSS (N = 1877) included a state-added question on “village of residence” that allowed for the merging of SVI to estimate the prevalence of some risk factors by municipality. The sample size for four villages were smaller than 30 and thus removed from the analysis. Spearman’s rank correlations were calculated to assess the relationship between BRFSS variables and the SVI using the CDC method, as well as between the BRFSS variables and adjusted SVI.
Researcher Positionality, Reciprocity, and Other Ethical Considerations
Ethics approval for this study was obtained from the University of Guam for the analysis of the SVI data (Human research subjects’ approval #20-170) and feedback from community stakeholders (CHRS #21-82). Our multidisciplinary team involved a community-based participatory researchers, demographer, epidemiologist, geographer, government planner, and statistician working together to produce the SVI estimates and apply the estimates to population health data. All but one of our team members are from Guam and have many years of experience collecting data or conducting research in Guam and other Pacific Islands. One member is a researcher at the University of Michigan and of Pacific Island heritage with many years of research experience working with Native Hawaiians and Pacific Islanders in the United States. Since this research impacts the entire island, the team engaged community stakeholders to obtain feedback on the preliminary findings and dissemination of the findings to enhance uptake. The research team is committed to seeing this study through the dissemination phase. Discussions are ongoing on the use of the analysis templates to rerun the SVI when the 2020 Guam census and 2020 Guam BRFSS data sets become available.
Findings
Results
Calculation and Application of the SVI
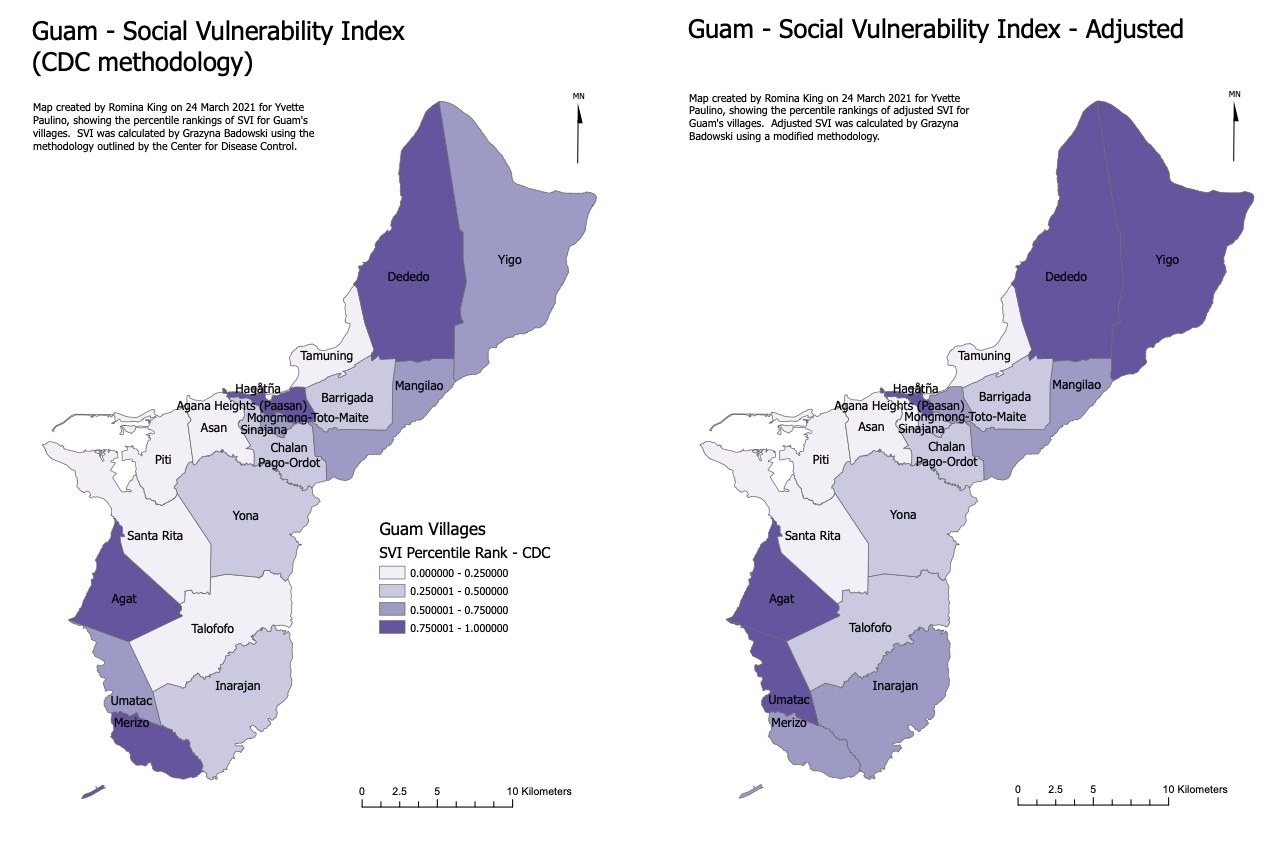
The calculated SVI for the 19 municipalities are listed in Table 4 and mapped in Figure 2. When applying the CDC methodology, the five most vulnerable municipalities based on the SVI were Agat, Merizo, Hagatna, Mongmong-Toto-Maite, and Dededo, while the five least vulnerable municipalities in SVI order were Talofofo, Tamuning, Asan-Maina, Santa Rita, and Piti. After adjustment for the Guam-specific themes, the top five ranking municipalities were Agat, Dededo, Yigo, Hagatna, and Umatac, while the last five ranking municipalities were Tamuning, Agana Heights, Asan-Maina, Santa Rita, and Piti. Regardless of the methodology used, CDC or adjusted, three municipalities (Agat, Hagatna, and Dededo) were among the top five most vulnerable and Agat remained the most vulnerable municipality. Four municipalities (Tamuning, Asan-Maina, Santa Rita, and Piti) were ranked among the five least vulnerable municipalities using both the CDC and the adjusted methods, and Piti remained the least vulnerable municipality.
Figure 2. Social Vulnerability Index (SVI) for the 19 Municipalities in Guam Stratified by Methodology (Source: 2010 U.S. Census)
The calculated SVI for the 57 CDPs are listed in Table 5. When applying the CDC methodology, the most vulnerable CDPs based on the SVI were Ukudu, Astumbo, Y Sengsong, Pagat, and Toto, while the least vulnerable CDPs were Nimitz Hill Annex, Apra Harbor, Naval Hospital, Finegayan Station, and Nimitz Hill. After adjustment for the Guam-specific themes, the most vulnerable CDPs were Ukudu, Chaguian, Y Sengsong, Pagat, and Astumbo, while the least vulnerable CDPs were Andersen Air Force Base, Nimitz Hill Annex, Finegayan Station, Apra Harbor, and Nimitz Hill. Regardless of the methodology used, CDC or adjusted, four of the CDPs (Ukudu, Astumbo, Y Sengsong, and Pagat) were among the most vulnerable and Ukudu remained the most vulnerable CDP. Four CDPs (Nimitz Hill Annex, Apra Harbor, Finegayan Station, and Nimitz Hill) were among the least vulnerable CDPs using the CDC and the adjusted methods, and Nimitz Hill remained the least vulnerable CDP. A map of the CDP rankings illustrated by quartiles is shown in Figure 3.
Figure 3. Comparison of Social Vulnerability Indices (SVI) of the 57 Census Designated Places in Guam by Percentile Ranking Depicted in Quartiles (Source: 2010 U.S. Census)
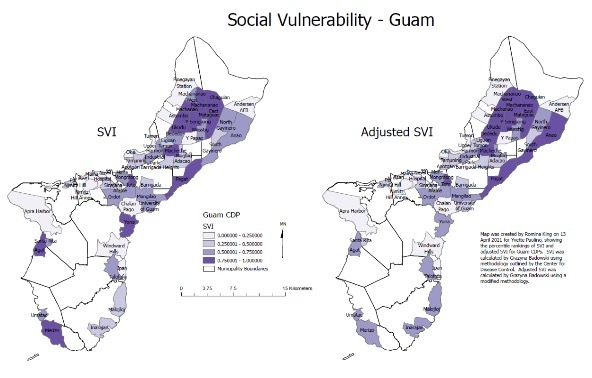
The calculations at the CDP level revealed lots of variability in vulnerability within the villages. For example, the largest village, Dededo, is divided into 13 CDPs with SVI ranks ranging from 0.02 (CDC) or 0.04 (adjusted) to 1. There was a strong significant positive association between SVI using the CDC method and the adjusted SVI for municipalities and CDPs (r(19)=0.91, p<0.001, and r(57) = 0.94, p<0.001 respectively).
Results of the Spearman’s rank correlations are listed in Table 6. There was a significant negative correlation between binge drinking and SVI using the CDC method (rS(15)=-0.57, p=0.026), but not after applying the adjusted-SVI. Nevertheless, this finding is consistent with other findings of less alcohol use among the lower socioeconomic status compared to higher socioeconomic status (Collins, 201627) and less frequent use, although in larger amounts, among the socially disadvantaged compared to the socially advantaged (Beard, 201928). The other correlations in Table 6 were not significant.
Community Input
Feedback from stakeholders were organized according to thematic responses (Table 7). All stakeholders agreed that the data presented during the forum were informative, most especially regarding the allocation of resources based off relevant community needs. The data visualization was also informative in that stakeholders were able to “map problem data with resource data and can [which could] make a difference in how we approach solving the [a] problem.”
Since stakeholders represented a range of workforce roles in the community, they were able to offer specific ways the SVI data is useful and applicable in their respective capacities. A few policy maker representatives noted that the SVI data “is useful for data driven policy,” and “for legislators when allocating resources for public services,” especially since “policymakers on Guam…often struggle to find reliable and concrete data that shows what problems our community is facing so we often must guess as to how to solve those problems.” Health professionals and academics noted that the SVI data can be applied to “program development and applying for grants” and in specific areas of public health and other social services including maternal and child health to “map where fetal deaths occur and which communities the parents live in…a map that can identify the risk status,” as well as “in regard to emergency response planning and helping officials. Very beneficial to vulnerable communities” and for “slow/fast moving virus, obesity, and other ailments.” Collectively, stakeholders agreed that the data will be useful in community planning for aspects such as “village outreach” and “nutritional planning” in “determining underserved areas who need certain services” to respond by providing adequate and relevant resources.
Several stakeholders expressed the need for the SVI team to provide more detail on the data visualization maps including “landmarks—where public institutions are at…where resources are at, village libraries, mayor's offices, parks for exercise” as well as “using words like most vulnerable to least vulnerable,” applying “a more granular look would be more [most] helpful, and specifics such as “more cross references; correlation of overcrowdedness in certain structures.”
In addition to providing more details on the maps, stakeholders noted that that inclusion of interactive features such as the “ability to zoom into the village and identify areas most vulnerable” would aid in increased engagement and that it will also “help with interpretation…the tabular data can only get you so far, but the visual data helps you understand not necessarily direct but indirect relationships and that’s the importance of graphic data.” Although a salient suggestion was made to “have an interactive map or dashboard…for community members to start playing and massaging the variables,” other stakeholders recommended to ensure various levels of access to the data such as on a “research level, which means being able to get down to the nitty gritty data and so on...I think several levels of access will be appropriate. One for the general public and another for researchers, public figures, planning communities who are asking specific questions.”
Lastly, stakeholders expressed their support to have the final products of information be disseminated “widely to the public” using a “simplified version(s) for public consumption.” They also encourage the SVI team to utilize mixed media such as “electronically via email, websites, and infographics” in the dissemination process.
Discussion of Preliminary Findings
Innovation and Relevance
The innovation in this report lies in the adjustment of the minority definition in the CDC methodology. Rather than adopting the non-White, non-Hispanic definition, minority was redefined as non-CHamoru or non-Filipino. Race and ethnicity are among common indicators that account for a large portion of the variability in social vulnerability (Cutter & Finch, 200829). As CHamoru and Filipino are the two predominant ethnic groups in Guam, redefining non-CHamoru and non-Filipino residents as minority more accurately reflects this variable. Thus, the adjusted minority variable makes the index more relevant to Guam. The SVI-adjusted rankings in Table 6 were not correlated with selected BRFSS variables; however, other health variables will continue to be explored based on feedback from the stakeholder forum.
Following the minority adjustment, Guam SVI was calculated in multiple forms (i.e., municipality, CDP, SVI CDC, adjusted SVI) thereby allowing for flexibility of uptake and interpretation depending on purpose. On one hand, the municipality-level rankings are convenient to interpret and compare as they reflect geographical boundaries currently in use in official local (BSP, 201930; Mayors’ Council of Guam, 202131) and national (U.S. Census Bureau, 201332) references. An example is the collection of municipal information in the Guam BRFSS, which allows for the analysis of health indicators by municipality-level SVI (Uncangco et al., 201933). On the other hand, the CDP-level rankings reflect units smaller than municipalities. This level of ranking is most useful to local authorities in identifying specific areas that are socially vulnerable. The SVI CDC rankings may serve as a standard reference point as they were calculated according to the CDC methodology with modification to the minority indicator. The adjusted SVI rankings consider Guam’s unique housing, communication, and other characteristics that influence vulnerability and most closely reflects vulnerability in Guam. Therefore, whether referring to municipality or CDP level rankings, the adjusted indices are recommended.
Contextualizing Vulnerability and Spatial Variation
While some municipalities and CDPs were more vulnerable than others regardless of methodology used, in some instances the SVI changed when the adjusted methodology is used as depicted in Figures 2 and 3. For example, some villages that were in the third quartile jumped to the fourth quartile (e.g., Umatac, Yigo) and some villages that were in the fourth quartile moved up to the third quartile (e.g., Merizo).
However, when focusing on the five most and least vulnerable municipalities and CDPs, they were quite similar between the CDC method and the adjusted method suggesting a level of internal consistency. The top-three ranking SVI-adjusted municipalities (Agat, Dededo, Yigo,) comprise of two northern municipalities (Dededo and Yigo) and one southern (Agat) municipality. Since Agat municipality ranked most vulnerable, regardless of methodology, its ranking was largely driven by socioeconomic status (Theme 1 in Table 2) and household composition and disability (Theme 2 in Table 2) that are not Guam-specific variables. Interestingly, within each municipality, social vulnerability varies; it is not homogenous. One would expect the most vulnerable CDP (Ukudu) to be in the most vulnerable municipality (Agat), but this was not the case; Ukudu is located in the northern municipality of Dededo (Table 4, Table 5, Figure 1, Figure 2). CDPs located on Department of Defense properties (e.g., Naval Hospital, Figure 1) were also less vulnerable than those outside Department of Defense areas. This is most likely due to the adherence to stringent building code requirements (concrete roofs, re-enforced concrete); mandatory requirement of typhoon shutters; access to free healthcare (U.S. Naval Hospital); guaranteed paychecks for service-members.
The high proportion of residents aged 65 and older and residents with disabilities contributed to the high SVI rank of Agat, which is home to a senior living residence in lower and upper Agat. Geographically, Agat rests along the southwestern coast of Guam and is mountainous. The demographic and geographic characteristics should be considered in the event of an emergency, such as a fire, warranting the evacuation residents. Also, there is heavy coastal erosion occurring in Agat (U.S. Army Corps of Engineers, 202034) and this physical geographical vulnerability is not adequately captured in the SVI.
Interestingly, the three most vulnerable SVI-adjusted CDPs (Ukudu, Astumbo, Y Sengsong) all lie within the most populous municipality of Dededo. Ukudu ranked the most vulnerable CDP, regardless of methodology, which was largely driven by socioeconomic status (Theme 1 in Table 2) and housing structure (Theme 5 in Table 2). The high proportion of residents that live below the poverty line and did not earn a high school diploma, as well as the high proportion of households without concrete structures and no access to public water, sewer, plumbing, kitchen, and telephone service contributed to the high SVI rank of the Ukudu CDP. By these standards, Ukudu could be considered marginalized. According to Burton et al. (201835), disasters result from the inequality and marginalization produced from political and economic systems that fail. Geographically, Ukudu nests inland in northern Guam and is mostly flat. The vulnerable housing structure should be considered in the event of a weather emergency, such as a typhoon. Furthermore, the findings in this report present an opportunity to visit the political and economic systems influencing the vulnerability of areas in Guam.
The most vulnerable county in the U.S. in 2018 was Brooks, Texas, and the least vulnerable county was Elbert, Colorado (CDC, 2018). When comparing Agat to Brooks, the Agat vulnerability was driven by a high proportion of elderly and disabled residents; whereas the Brooks vulnerability was driven by other factors such as a high proportion of minorities, residents who do not speak English well, and residents living below the poverty level.
Conclusions
Key Findings
Our preliminary findings provide the initial estimates of Guam SVI in multiple forms (i.e., municipality, CDP, SVI CDC, adjusted SVI). The adjusted SVI innovatively redefines minority in the context of Guam’s ethnic composition and incorporates additional themes relevant to Guam’s vulnerability, and therefore we recommend its use. The most vulnerable municipality and CDP were Agat and Ukudu, respectively. The least vulnerable municipality was Piti. The least vulnerable CDP was Nimitz Hill, which lies within the Piti municipality. SVI was negatively correlated with binge-drinking, but not after applying the adjusted-SVI. We encourage the use of the municipality-level indices for official local and national references to municipality boundaries. We recommend the use of CDP-level indices by local policymakers and public health practitioners, as these indices provide the granular data identifying which communities have the greatest public health needs.
Applied Public Health Implications
The SVI calculations provide important evidence-based information that local leaders, clinicians, and community stakeholders can apply to decision-making for policies, programs, and cost-effective solutions. Local policymakers have acknowledged the difficulty in finding reliable and concrete data that indicate which communities have the greatest public health needs, and that the Guam SVI results are an important step towards providing reliable insights into how to solve community issues. Furthermore, the SVI results provide justification for the allocation of funding and other resources in the development of targeted interventions to improve the health of the population. The information will help increase knowledge and awareness of vulnerable communities and inform strategies for disaster management. Updating measures of SVI calculations based upon the release of new census and survey data will allow for monitoring trends and patterns of vulnerability and environmental disaster risk areas in Guam.
Dissemination of Findings
Preliminary findings were shared with community stakeholders on March 26, 2021, via a virtual forum. The forum was attended by 24 stakeholders, including representatives from mayoral and senatorial offices, academic institutions, the health department, BSP, EPA, and other community members. Immediately following the presentation, 15 stakeholders were randomly assigned to one of five breakout sessions which lasted approximately 25 minutes. In the breakout sessions, stakeholders were invited to share how they may use the SVI in their work capacity and how the information can best be presented and disseminated to community members.
Two members of the SVI team utilized thematic analysis to analyze transcriptions from the recorded sessions. Thematic analysis is a qualitative research approach for identifying, organizing, analyzing, and reporting themes (Nowell et al., 201736). A basic codebook was developed based on the questions that were asked in the breakout sessions and was edited throughout the analysis process. Units of analysis or meaningful segments that could be a portion of a line or several lines were extracted for coding. Codes were then grouped into major themes and subthemes that helped answer whether participants found the SVI data informative; how the data may be utilized in various workforce capacities; and how the adjusted data can be appropriately presented and disseminated to the local community.
The SVI calculations from the 2010 Guam census will be made available to community leaders and stakeholders in their preferred format, (print, electronic, etc.), after their feedback is incorporated into results. While awaiting the availability of the 2020 census data, available information will be summarized and shared with the lay community, government, and local leaders, including in peer-reviewed publications and through presentations at professional meetings. Ultimately, the team would like the data to be accessible to the community through a publicly available website easily accessible for the community.
Limitations
An important limitation of the SVI is that the derivative methods used to construct the indices cannot sufficiently account for the multiplicative, nonlinear nature of vulnerability. It also does not take into consideration physical geography, such as proximity to eroding coastlines, or fire-prone areas. Reliance on cross-sectional data, like the census or nationally representative repeat-measure surveys for SVI calculation, often has a lag effect that can be a few years and even a decade behind. The census and survey data also tracks people and condition at a specific time, failing to account for movement and changing conditions (either positive or negative) over time. This time delay limits the ability to capture current information for action and intervention in vulnerable communities, particularly for disaster management. The Guam census, which is patterned after the U.S. census, lacks important data such as housing structure and materials used that assist in the accurate estimation of SVI. To address these limitations, an adjusted model of the SVI was adapted for the project to account for more nuanced information unique to the lived experiences and environment in Guam.
Future Research Directions
Discussions are underway for updating the SVI calculations when the 2020 Guam census data become available. At that time, the approach to constructing the social vulnerability of Guam may be aligned with other well-established methods (Cutter et al., 2003; Cutter et al., 201037; Mavhura et al., 2017). Similar analyses are planned for the application of the updated SVI estimates to the 2020 Guam BRFSS data. The current Guam SVI estimates will be promoted among academics at partnering institutions of higher education to promote further research using the SVI estimates. Potential research topics include: validating (Rufat et al., 201938) and evaluating (Spielman et al., 202039) the social vulnerability model for Guam; expanding the SVI calculations to include other population-based or social determinants of health data for Guam; leveraging of funding and resource opportunities to support local interventions and capacity-building in vulnerable communities and disaster management; developing new community-engaged research to develop strategies to improve conditions among socially vulnerable communities in Guam; and replicating the SVI calculations for other U.S. Affiliated Pacific Islands.
References
-
World Health Organization. (2002). Disaster & Emergencies Training Package. ↩
-
Adger, W. N. (2006). Vulnerability. Global Environmental Change, 16(3), 268–281. https://doi.org/10.1016/j.gloenvcha.2006.02.006 ↩
-
Birkmann J. (2005). Danger need not spell disaster but how vulnerable are we? https://www.files.ethz.ch/isn/21139/UNU-RB-1-2005-EHS.pdf ↩
-
Cutter, S.L., Carolina, S., Boruff, B.J., Shirley, W.L., 2003. Social vulnerability to environmental hazards. Soc. Sci. Q. 84, 242–261. ↩
-
Centers for Disease Control and Prevention. (2018). CDC SVI 2018 Documentation. https://svi.cdc.gov/Documents/Data/2018_SVI_Data/SVI2018Documentation.pdf ↩
-
Flanagan B.E., Gregory E.W., Hallisey E.J., Heitgerd J.L., & Lewis B. (2011). A Social Vulnerability Index for Disaster Management. Journal of Homeland Security and Emergency Management, 8(1). doi:10.2202/15477355.1792 http://www.bepress.com/jhsem/vol8/iss1/3 ↩
-
Flanagan B.E., Hallisey E.J., Adams E., & Lavery A. (2018). Measuring Community Vulnerability to Natural and Anthropogenic Hazards: The Centers for Disease Control and Prevention’s Social Vulnerability Index. Journal Environmental Health, 80(10), 34-36. ↩
-
Yee C.W., Cunnigham S.D., & Ickovics J.R. (2019). Identifying teen pregnancy intervention need in the United States. Maternal Child Health Journal, 23(11): 1516-1524. ↩
-
Nguyen T.N., Ngangue P., Bouhali T., Ryan B.L., Stewart M., & Fortin M. (2019). Social vulnerability in patients with multimorbidity: a cross-sectional analysis. International Journal of Environmental Research and Public Health, 16(7), 1244. doi:10.3390/ijerph16071244 ↩
-
An R. & Xiang X. (2015). Social vulnerability and leisure-time physical inactivity among U.S. adults. American Journal of Health Behavior, 39(6), 751-760. doi:10.5993/AJHB.39.6.2 ↩
-
Freitas I.C. & Moraes S.A. (2016). Social vulnerability effect over obesity anthropometric indexes: results from population-based epidemiological study. Revista Brasileira De Epidemiologia, 19(2), 433-450. doi:10.1590/1980-5497201600020018 ↩
-
Biggs, E., Maloney, P., Rung, A., Peters, E., & Robinson, W. (2021). The Relationship Between Social Vulnerability and COVID-19 Incidence Among Louisiana Census Tracts. Front Public Health. doi: 10.3389/fpubh.2020.617976. https://pubmed.ncbi.nlm.nih.gov/33553098/ ↩
-
Centers for Disease Control and Prevention. (2020). CDC's Social Vulnerability Index (SVI). Centers for Disease Control and Prevention. https://www.atsdr.cdc.gov/placeandhealth/svi/index.html. ↩
-
Guam Homeland Security Office of Civil Defense. (2016). The Territory of Guam Comprehensive Emergency Management Plan. ↩
-
U. S. Census Bureau. (2014). Guam Summary File 2010 Census of Population and Housing Technical Documentation. https://www.census.gov/prod/cen2010/doc/dpsfgu.pdf ↩
-
Bureau of Statistics and Plans. (2011). 2010 Guam Statistical Yearbook. https://spccfpstore1.blob.core.windows.net/digitallibrary-docs/files/a0/a0410b6d7fd5cfdb44fd6d3a033634d4.pdf?sv=2015-12-11&sr=b&sig=aAkwTqUyMiPyPBbACxhbQlk1dt%2FFF3hVGE%2B4YH4s5fg%3D&se=2021-12-27T01%3A44%3A37Z&sp=r&rscc=public%2C%20max-age%3D864000%2C%20max-stale%3D86400&rsct=application%2Fpdf&rscd=inline%3B%20filename%3D%22Guam_2010_Statistical_Yearbook.pdf%22 ↩
-
King, R., Bautista, K., Higgs, M., & Leon-Guerrero, E. (2019). Vulnerability Assessment of Built Infrastructure near Coastal Bays using three Sea Level Rise Scenarios- Guam. ↩
-
Barnett, J. (2001). Adapting to climate change in Pacific Island countries: The problem of uncertainty. World Development, 29, 977–993. ↩
-
Briguglio, L. (1995). Small island developing states and their economic vulnerabilities. World Development, 23, 1615–1632. ↩
-
Dahl, C. (1997). Integrated coastal resources management and community participation in a small island setting. Ocean & Coastal Management. 36, 23–45. [https://doi.org/10.1016/S0964-5691(97)00018-5](https://doi.org/10.1016/S0964-5691(97)00018-5) ↩
-
Hay, J., Suarez, A.G., Wong, P.P., Briguglio, L., Ragoonaden, S., Githeko, A., Ittekkot, V., Kaly, U., Klein, R. (2001). Small Island States. Climate Change 2001 Impacts, Adaptation, and Vulnerability Contribution Work Group Third Assessment Report, Intergovernmental Panel on Climate Change 843. ↩
-
Mimura, N. (1999). Vulnerability of island countries in the South Pacific to sea level rise and climate change. Climate Research, 12, 137–143. ↩
-
Adger, W.N., S. Agrawala, M.M.Q. Mirza, C. Conde, K. O’Brien, J. Pulhin, R. Pulwarty, B. Smit & K. Takahashi. (2007). Assessment of adaptation, practices, options, constraints and capacity. Climate Change 2007: Impacts, Adaptation and Vulnerability. Contribution of Working Group II to the Fourth Assessment Report of the Intergovernmental Panel on Climate Change. (pp. 717-743). Cambridge University Press. ↩
-
Guam State Data Center & Bureau of Statistics and Plans. (2012). Guam Demographic Profile Summary File. ↩
-
Hezel, F.X. (2013). Micronesians on the Move.(pp. 1–58). East-West Center https://scholarspace.manoa.hawaii.edu/bitstream/10125/30616/pip009.pdf ↩
-
Centers for Disease Control and Prevention. (2021). Behavioral Risk Factor Surveillance System. https://www.cdc.gov/brfss/index.html ↩
-
Collins S. E. (2016). Associations Between Socioeconomic Factors and Alcohol Outcomes. Alcohol Research: Current Reviews, 38(1), 83–94. https://www.ncbi.nlm.nih.gov/pmc/articles/PMC4872618/ ↩
-
Beard, E., Brown, J., West, R., Kaner, E., Meier, P., Boniface, S., & Michie, S. (2019). Correction: Associations between socio-economic factors and alcohol consumption: A population survey of adults in England. PLOS ONE, 14(4), e0216378. https://doi.org/10.1371/journal.pone.0216378 ↩
-
Cutter, S. & Finch, C. (2008). Temporal and spatial changes in social vulnerability to natural hazards. Proc Natl Acad Sci U S A. doi: 10.1073/pnas.0710375105. https://pubmed.ncbi.nlm.nih.gov/18268336/ ↩
-
Bureau of Statistics and Plans. (2019). 2018 Guam Statistical Yearbook. http://www.spc.int/DigitalLibrary/Doc/SDD/Statistical_yearbook/GU/Guam_2018_Statistical_Yearbook.pdf ↩
-
Mayors’ Council of Guam. (2021). https://mcog.guam.gov/ ↩
-
U. S. Census Bureau. (2013) Island Areas: Guam Dataset. https://www.census.gov/data/datasets/2010/dec/guam.html ↩
-
Uncangco A.A., Dizon J., Guerrero M.J., Camacho E.C., & Paulino Y.C. (2019). Creation of the Village Health Profiles of Guam. Behavioral Risk Factor Surveillance System Annual Meeting and Training Workshop, Atlanta, GA. ↩
-
U. S. Army Corps of Engineers. (2020). Agat Bay Regional Shoreline Assessment. https://www.portofguam.com/sites/default/files/agat_rsa_report_2020_0325_draftfinal_compressed.pdf ↩
-
Burton, C., Rufat, S., & Tate, E. (2018). Social Vulnerability: Conceptual Foundations and Geospatial Modeling. In S. Fuchs & T. Thaler (Eds.), Vulnerability and Resilience to Natural Hazards (pp. 53-81). Cambridge: Cambridge University Press. Retrieved from https://www.academia.edu/38672014/Social_Vulnerability_Conceptual_Foundations_and_Geospatial_Modeling ↩
-
Nowell, Lorelli S., et al. (2017). Thematic Analysis. International Journal of Qualitative Methods, vol. 16, no. 1, p. 160940691773384. Crossref, doi:10.1177/1609406917733847. ↩
-
Cutter, S.L., Burton, C.G., & Emrich, C.T., 2010. Disaster resilience indicators for benchmarking baseline conditions. J. Homel. Secur. Emerg. Manage. 7(article 51). ↩
-
Rufat, S., Tate, E., Emrich, C. T., & Antolini, F. (2019). How Valid Are Social Vulnerability Models? Annals of the American Association of Geographers, 109(4), 1131–1153. https://doi.org/10.1080/24694452.2018.1535887 ↩
-
Spielman, S. E., Tuccillo, J., Folch, D. C., Schweikert, A., Davies, R., Wood, N., & Tate, E. (2020). Evaluating social vulnerability indicators: Criteria and their application to the Social Vulnerability Index. Natural Hazards, 100(1), 417–436. https://doi.org/10.1007/s11069-019-03820-z ↩
Paulino, Y., Badowski, G., Chennaux, J., Guerrero, M., Cruz, C., King, R., & Panapasa, S. (2021). Calculating the Social Vulnerability Index for Guam (Natural Hazards Center Public Health Disaster Research Report Series, Report 12). Natural Hazards Center, University of Colorado Boulder. https://hazards.colorado.edu/public-health-disaster-research/calculating-the-social-vulnerability-index-for-guam