Impact of Infrastructure Disruptions on Puerto Rican Household Capabilities, Health, and Well-Being
Publication Date: 2022
Executive Summary
Overview
Critical infrastructure encompasses energy, water and wastewater, communications, transportation, food, health, and emergency services. When critical infrastructure is damaged or fails, essential services are interrupted and this can have severe health and well-being consequences. Our study examines how infrastructure disruptions, and hence infrastructure service interruptions, place a burden on households by impeding their capabilities, such as accessing drinking water, storing and preparing food, removing wastewater, and cooling or heating their homes. Because these household-level impacts of infrastructure disruptions are currently unmeasured, they are not adequately considered in infrastructure provision or public health planning. This study assessed the impacts of power outages on households in Puerto Rico to help inform disaster mitigation and preparedness strategies so that future power outages do not have such serious, and perhaps deadly, consequences.
Research Questions
These questions guided this research:
- What critical household capabilities were disrupted during recent power outages in Puerto Rico? How did these disrupted capabilities differ according to outage duration?
- What were the time, monetary, health, and well-being impacts and costs associated with these interrupted capabilities? How did these vary according to outage duration?
- What role (if any) did social factors such as social capital, community ties, and community cohesion have in mitigating household impacts?
- How did these disrupted household capabilities and costs differ across urban, rural, and suburban community types?
Research Design
The survey company, Qualtrics, was hired to administer an island-wide survey of Puerto Rican households (n=395) between December, 2021 and March, 2022. Sample recruitment sought to mirror census data on income and education, and to oversample rural households to ensure adequate data across community types. Respondents were asked to identify a significant power outage that occurred in the past three years and to answer questions about the impact of that outage on their household capabilities (e.g., cooling their homes, preparing food, etc.) and the physical, mental, and overall health and well-being of their household members. Other questions covered access to food, water, and healthcare, and social capital. Data analysis compared sample demographics to census data to gauge sample representativeness and used statistical techniques to explore relationships between key variables, such as outage duration and reported health impacts.
Findings
Disruptions to cooling and food refrigeration were the most frequently reported impacts, the most highly ranked impacts on the health and well-being of household members, and the most time and financially intensive disruptions. Respondents identified disruptions to communications and information access as negatively affecting their mental health in particular. The outage reduced life satisfaction for most respondents and was a significant factor in determining the severity of impacts. Aggregate measures of social capital did not have a significant impact on the number and types of disruptions, time and financial burdens, nor changes in well-being reported by households.
Rural households were most likely to report disruptions to the use of in-home health devices, whereas urban households were most likely to report disruptions in accessing healthcare outside the home. Urban households were more likely to report food refrigeration as having the single greatest impact, but rural and suburban were more likely to report issues with food access. Moreover, rural households were most likely to report accessing potable water as their greatest need. Results suggest that rural households, households with young children, and households reporting one or more illnesses or disabilities reported more health impacts from power outages than other household types. Also, households living below the poverty level, on average, reported less disruptions types but spent significantly more time and more money coping with each disruption. On the other hand, higher income households were associated with a greater number of disruptions types, resulting in more time burdens coping with disruptions overall.
Public Health Implications
The results suggest that providing cooling resources (i.e., fans and/or air conditioning at community centers with back-up power systems) and refrigeration (i.e., access to ice or community provided refrigeration for food and medicine) are important interventions to safeguard health and well-being outcomes during outages. For mental health, enhanced community outreach and diversified communication channels may be particularly impactful. Preparedness efforts focused on identifying households that depend upon electricity to power medical devices or to refrigerate medication should be prioritized and contingency plans developed. Because households with young children and/or disabilities were found to experience more severe health consequences from outages, interventions focused on providing childcare and dependent care during disruptions are recommended. The results indicated variations in impacts and vulnerabilities by community type (i.e., rural, suburban, urban), suggesting that strategies for mitigation and preparedness should be customized at the local level. In particular, efforts to address the challenges related to disruptions to in-home health services, food access, and potable water access in rural communities should also be prioritized.
Introduction
Infrastructure disruptions often have severe health and well-being consequences, as many households rely heavily upon infrastructure services (e.g., power and running water) and the capabilities they enable (e.g., ability to cook food and access drinking water). Since these household impacts of infrastructure outages are currently unmeasured, they are not adequately considered in infrastructure provision nor public health planning. This study focused on assessing the impacts of recent power outages experienced by households in Puerto Rico to help inform mitigation and preparedness strategies that might reduce household health and well-being burdens during future outages.
Study Site Description
Hurricane Maria hit Puerto Rico on September 20, 2017, causing catastrophic damage, high loss of life, and completely shattering the island’s electric power system. Even before the hurricane, the island was already significantly weakened by a long history of colonial exploitation, an economic downturn, a $73-billion debt crisis, federally imposed austerity, outdated power infrastructure, and Hurricane Irma, which had hit the Caribbean archipelago just two weeks before. Hurricane Maria caused a blackout which lasted longer than all U.S. blackouts in recorded history by threefold (Houser & Marsters, 20181). Six days after the hurricane’s landfall, the Secretary of Health for the Puerto Rican government at the time, Rafael Rodriguez Mercado, stated that only 18 out of the island’s 69 hospitals were functioning at in any capacity, and that most of these only had their emergency rooms available (Instituto Caribeño de Derechos Humanos, 20172). Moreover, Hurricane Maria had a long-lasting impact on the electric power system. Left without electricity for six months or longer (Ferré et al., 20193), many of the island’s 3.5 million residents lacked access to potable water and sewage treatment (Rodriguez, 20184), certain medical equipment could not be used, drugs could not be properly refrigerated, and diseases such as leptospirosis spread due to compromised sanitation systems (Irfan, 20185; Sutter & Pascual, 20186). While Puerto Ricans eventually recovered their electric service, the island's power grid has never fully recuperated. Consequently, the Puerto Rico population continues to experience frequent power outages.
Additionally, Puerto Ricans live under federally imposed austerity measures due to an economic crisis that negatively impacts their access to food, housing, water, electricity, education, and health care. The hurricanes of September 2017, earthquakes of December 2018 and January 2019, and the global Covid-19 pandemic (March 2020 through April 2022) have proven to be an extended “perfect storm,” and have significantly worsened the quality of life on the island (Lloréns & Stanchich, 20197).
Puerto Rican residents have poorer health outcomes than other U.S. citizens (Joseph et al., 20208). As shown by U.S. Census Bureau (2020)9, they also have lower incomes: Puerto Rico’s median income per household amounts to $20,474, and 43.5% of the population is under the U.S. poverty line. These challenges make households in Puerto Rico particularly vulnerable to additional adverse health and well-being challenges stemming from future power outages and other infrastructure disruptions.
Literature Review
Previous research has examined connections between disaster events, infrastructure disruptions, and health and well-being impacts. For example, Obolensky et al. (2019)10 completed a review of studies examining the effects of electricity, water, and transport disruptions on households and communities. Their findings showed that the indirect impacts of these disruptions, including effects on economic conditions and well-being, were harder to measure and typically underestimated (Obolensky, 2019). Another review of the literature examined the health impacts of power outages and highlighted the ways that outage frequency, duration, timing, and geographic range as well as prior mitigation measures, disaster preparedness, and knowledge affected the magnitude of social costs of power disruptions (Casey et al., 202011). The same review also identified how disparate household characteristics contribute to overall household outcomes, due to variations in risk factors (e.g., how older adults are medically at high-risk during power outages) and preparatory capacity.
The types of services lost during power outages have an important impact on household well-being. In a survey of households in Florida following Hurricane Wilma in 2005, for example, Chatterjee & Mozumber (2015)12 found that disruptions in electricity and water supply were the main drivers of decline in household well-being. They recommended subsidies that would encourage households to install window protections and purchase generators to reduce post-disaster impacts. More recently, Meng and Mozumder (2021)13 examined household recovery eight months after Hurricane Sandy and found that utility disruptions were an important determinant of household recovery and that the longer the period of disruption, the more likely respondents were to incur higher monetary losses and have more difficulty in the recovery process.
Social capital (i.e., the strength of relationships with family, friends, and neighbors) is also known to influence a household’s ability to cope with and recover from infrastructure disruption. Stronger social networks have been shown to provide households with increased support and resources during emergency events (Aldrich & Meyer, 201514; Aldrich, 201215). A recent study of the role of social capital in resiliency in two Puerto Rican communities following Hurricane Maria found that fostering social capital in everyday interactions prior to the hurricane facilitated recovery, even in households that were not sufficiently prepared for the degree of destruction wrought by the hurricane (Roque et al., 202016).
Building upon existing work, this study draws upon the capabilities approach to understand the household impacts of recent power outages in Puerto Rico. This approach describes the processes and systems supporting human development and the achievement of human well-being (Sen, 200117; Robeyns & Byskov, 202118). It emphasizes the need for enlarging personal freedoms and opportunities to achieve higher levels of human development. It is about the freedoms ordinary people have to decide who to be, what to do, and how to live (United Nations Development Programme, 201419). A key aspect of the capabilities approach is the concept of capabilities—the portfolio of possibilities that are available to an individual that enable them to achieve a life they consider valuable. Basic capabilities include good health, access to knowledge, and a decent standard of living (Osmani, 201620). Secondary capabilities are more specific precursors to, and support the achievement of, basic capabilities. Examples within a home include being able to heat and cool a home and being able to acquire and cook food (Day et al., 201621). Figure 1 outlines the capabilities approach and how it offers a way to measure well-being as what people are actually able to do with the resources they have. In other words, one’s capabilities are expanded (or constrained) by one’s own efforts and by the institutions and conditions of the surrounding society (known as conversion factors). People with well-developed capabilities have the tools they need to live “a good life,” whereas those poor in capabilities struggle to do so (Hick, 201222).
Figure 1. Capabilities Approach Framework Applied to Infrastructure Disruptions and Household Well-Being
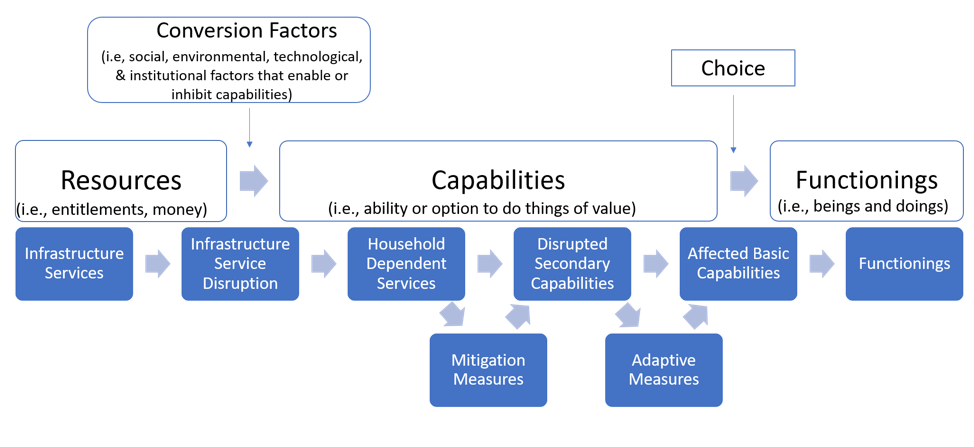 Note. The top of Figure 1 shows the general capabilities approach developed by Sen (2001). The bottom of Figure 1 shows how our study adapted the capabilities approach to study the impact of infrastructure disruptions on household capabilities and functioning following Day et al. (2016). Note that for this study, we focus on the disrupted secondary capabilities in the home during a power outage that enable the basic capabilities relevant to the achievement and maintenance of good health and well-being.
Drawing on previous literature which applied the capabilities approach to infrastructure services at the household level, we have adapted Figure 1 to show how infrastructure disruptions can impede household capabilities and functioning. Our framework incorporates insights from Day et al. (2016) which used the capabilities approach to understand how electricity-dependent household services relate to specific and contextual household activities, referred to as secondary capabilities, and energy poverty. We also drew from Dargin and Mostafavi (2020)23 who applied the capabilities approach to inform subjective well-being impacts (i.e., measures of emotional well-being) of infrastructure disruptions in Houston, Texas following Hurricane Harvey in 2017. They found varying self-reported well-being impacts (i.e., feelings of anxiousness or helplessness) related to general infrastructure disruption types (i.e., transportation, food, solid waste) across households with different demographic characteristics.
The capabilities approach is used more frequently in the public health literature than in the infrastructure planning literature. Entwistle and Watt (2013)24 used insights from the capabilities approach to characterize person-centered health care that considers diverse patients and situations, emphasizing the importance of adopting context-specific—rather than universal, prescriptive—approaches to health. In consideration of mental health, White and colleagues (2016)25 suggest using the capabilities approach to address the limitations of current mental health interventions that focus on reducing symptoms, rather than addressing more holistic well-being. However, as Mitchell and colleagues (2017)26 note in their review of the capabilities approach application in health, one of the challenges in applying capabilities approach is its relatively “underspecified” nature (p. 346); while there is a relative consensus that the concept of health reflects a “sufficiency” of capabilities (p. 357), there is less consensus regarding what those capabilities are or should be.
Current Study
This research goes beyond prior work by augmenting the capabilities approach (see Figure 1) to assess the health and well-being impacts of power outages on households in Puerto Rico. It focuses on understanding the impacts of infrastructure disruption types (based on the services and secondary capabilities disrupted) on a household’s ability to fulfill basic capabilities related to maintaining health and well-being, including access to food, potable water, sanitation, and other critical services. This framework incorporates mitigation measures (i.e., preparation efforts) that a household may benefit from, including access to a generator or the stockpiling essential goods that may allow them to cope with disrupted services and capabilities. The augmented framework also includes adaptive measures, which reflect the unplanned coping mechanisms a household might take to fulfill secondary capabilities during outages, such as ordering take-out if their ability to cook was disrupted or buying bottled water to drink if their access to drinking water is interrupted. Mitigation and adaptation measures, which are distinguished by the point at which they are undertaken (mitigation being proactive, adaptation being reactive), may provide varying degrees of quality and quantity of services. Moreover, they often require additional time and/or money to utilize—purchasing bottled water and takeout meals may provide households with food and potable water, but doing so may require households to spend additional time and money, such as traveling to the store or restaurant or waiting in line. This application of the capabilities approach to the study of infrastructure disruptions enables a clear articulation of how the disruption of particular infrastructure services, and dependent secondary capabilities, may hinder the achievement of maintaining health and well-being for households and communities. The results of which will inform planning strategies and interventions that may mitigate the impacts on households during future infrastructure disruptions.
Methods
Research Design
A cross-sectional, digital survey of Puerto Rican households was conducted on a sample (n=395) that was recruited from December 2021 through March 2022 in a manner to be representative of the population according to income and education, but which oversampled rural populations (a small minority of the actual Puerto Rico population) to ensure adequate data to answer the research questions and identify and understand the differentiating impacts across household and community types as well outage duration. The sample included particularly at-risk populations (i.e., low-income, households in rural communities, and households with seniors, young children, and/or disabled members).
Community Stakeholders
This project involved stakeholder engagement and collaboration with two community organizations in Puerto Rico. The first organization was the Corporación de Servicios de Salud y Desarrollo Socio-económico del OTOAO (COSSAO). COSSAO is a non-profit in Utuado focused on community health and well-being which helps to represent a rural municipality of about 30,000 people located in the central mountainous region. The second organization was the Corporación del Proyecto ENLACE del Caño Martín Peña (ENLACE). ENLACE is a public corporation focused on community development in densely populated and vulnerable communities located along the Caño Martín Peña tidal channel in San Juan. The project team established strong relationships with these community organizations that helped them develop a survey instrument relevant and appropriate for Puerto Rico. The organizations also provided feedback on the study’s public health implications.
Research Questions
This research aimed to answer the following research questions:
- What critical household capabilities were disrupted during recent power outages in Puerto Rico? How did these disrupted capabilities differ according to outage duration?
- What were the time, monetary, health and well-being costs associated with these interrupted capabilities? How do these costs vary according to outage duration?
- What role (if any) did social factors such as social capital, community ties, and community cohesion have in mitigating household impacts?
- How did these disrupted household capabilities and costs differ across urban, rural, and suburban community types?
Data, Methods, and Procedures
Procedure
The Institutional Review Board (IRB) at the University at Buffalo granted approval for research on human subjects on November 1, 2021. The survey instrument was developed in English and translated into Spanish using DeepL, an online neural network translator. The Puerto Rican members of the research team reviewed both survey versions to ensure the accuracy and appropriateness of the Spanish translation; which was then reviewed by COSSAO and ENLACE. The survey instrument was finalized on December 15, 2021.
Sampling
Qualtrics, a survey company, was hired to implement the survey instrument. Participants were mainly recruited from opt-in survey panels using emails and social media advertisements in both Spanish and English. Some phone interviews were also conducted. Eligible participants were (a) at least 18 years of age, (b) had lived primarily in Puerto Rico for the past three years, and (c) had experienced one or more power outages in the past three years. The intention was to recruit a sample that mirrors Puerto Rico household census data in terms of income and education, but with oversampling of rural and suburban households.
Respondents accessed the survey using provided links and self-administered it on their electronic devices. The digital dissemination of the survey enabled widespread distribution in a relatively short period of time; the resultant sample, however, is constrained to primarily households with access to reliable internet and electronic devices. In accordance with IRB regulations, prior to the survey, the participants were provided with study information and contact information for study personnel and were asked to indicate their informed consent to participate in the survey. The survey was distributed between December 22, 2021 and March 15, 2022. We screened all responses for quality and completion, resulting in a total of 395 valid responses.
The demographic characteristics of the survey sample were reasonably similar to those of the Puerto Rican population, as reported in U.S. Census Bureau (2020) estimates. For example, the average household size of survey respondents was 2.9 people, only slightly higher than the average household size of 2.7 people estimated for the overall Puerto Rican population. Similarly, the median income of survey respondents was between $20,000 and $25,000, the same median income found in the census estimates. The education level of survey households in the survey sample was generally higher than the population, but this result was expected, because the survey asked respondents to indicate the highest level of education obtained in their household, whereas the census data captures the education level of each individual. The most significant difference between the survey sample and the overall Puerto Rican population was in the split between urban or rural residence locations. In our survey sample, 46.2% of survey respondents reported residing in urban areas, 30.6% in rural areas and 19.2% in suburban areas. The share of the urban population in our sample was much smaller than the estimated 93.6 % of Puerto Ricans who live in urban areas (World Bank, 201827). The sample also had an unexpectedly large number of households (60%) reporting that someone requires the use of an electricity-dependent in-home medical device. This may indicate a response bias towards individuals with chronic conditions, or simply a misunderstanding of the question. We did not ask respondents to specify the types of medical devices their household member used. (See Appendix A for a full statistical table comparing of the demographic characteristics of the survey sample to the overall population in Puerto Rico).
Measures
Respondents were asked to identify a particularly impactful power outage that they experienced during the past three years and to use that experience to answer questions about the effect of outages on household capabilities. Participants were provided with a list of twelve secondary capabilities (e.g., ability to light home, cook food, access information, etc.) and asked to identify all that were disrupted by the outage. Respondents were also provided an option to fill in other activities that were not on the predetermined list. Participants were then asked to identify which (if any) of the disruptions they experienced had affected their household's physical health and mental health. Finally, participants ranked affected secondary capabilities from the greatest to the least impact on their household’s health and well-being.
Respondents were then presented with additional detailed questions corresponding only to the top ranked interrupted secondary capabilities and asked to provide estimates of additional time (in hours) and monetary expenses (in dollars) incurred to cope with each disruption over the duration of the outage. Respondents were also asked to use a scale of zero (no impact) to 10 (significant impact) to identify the degree to which each disruption impacted their household’s physical and mental health. If respondents indicated that a disruption had a significant impact on physical and/or mental health (i.e., a score of six or greater), they were asked to explain how the disruption impacted their health specifically. Overall well-being outcomes were measured by asking participants to indicate how their “overall life satisfaction changed as a result of the outage” on a seven-point Likert scale, with options ranging from “much lower than before the outage” (a score of one) to “much higher than before the outage” (a score of seven). See Appendix B for list of all survey questions which were analyzed in this report.
The survey instrument also included questions relating to four different categories of social capital, including strength of association, community ties, social trust, and frequency of formal connection. For the first three types, participants were asked to indicate the extent of their agreement with statements such as “I know my neighbors well,”, “Community events are an important part of my life,” and “In case of an emergency, community members would work together with each other to solve the problem” on a five-point Likert scale ranging from “strongly disagree” to “strongly agree”. For the frequency of formal connection category, respondents were asked to indicate their frequency of participating in religious and cultural events and how frequently they volunteer in their community. These social capital questions were adapted from previous social capital survey studies (i.e., Cho & Kang, 201728). The analysis includes the consideration of overall social capital scores and the average score for each specific category of social capital, listed above.
Data Sample and Analysis
The data preparation and analyses conducted in this study was completed in the statistical analysis program R, with final data visualization completed using Microsoft Excel. Of the responses used in the analysis, 133 (33.7%) were completed in English, while 262 (66.3%) were completed in Spanish. Data analysis involved the use of descriptive statistics, chi-squared analyses, Pearson’s and Spearman’s correlation tests, Analysis of Variance (ANOVA), and multiple linear regression analysis. (Appendix C provides summaries of multivariate regression analysis).
Ethical Considerations, Researcher Positionality, Reciprocity, and Other Considerations
The project team reviewed the CONVERGE Broader Ethical Considerations Training Module to ensure that the team members are aware of—and sensitive to—broader ethical concerns of conducting disaster research. These considerations have informed the way in which the research team has designed and implemented this study, from the initial conception of the research idea to the presentation and dissemination of the research results. In addition, all members of the project team have completed community-based research in Puerto Rico previously. To ensure the work is culturally sensitive and relevant to the local challenges and context of Puerto Rico, co-author Ralph Rivera Gutiérrez, who resides in Puerto Rico, guided the work on the public health consequences of recent power outages on the island (having experienced many himself in recent years). As noted above, the team also has strong relationships with community organizations.
Findings
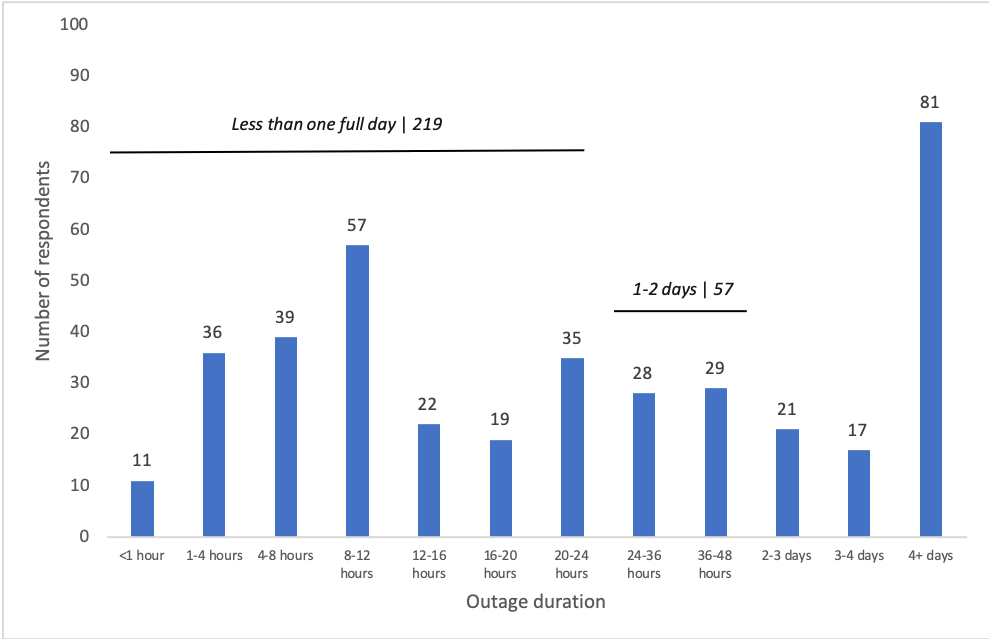
Research findings are organized below according to the topic of each of our research questions. As mentioned above, participants based their responses on their personal experience with a “particularly impactful” power outage during the previous three years (2019-2021). As displayed in Figure 2, the duration of outages that respondents identified largely follow a bimodal distribution; while the median outage duration was between 20 and 24 hours, 86 respondents reported an outage lasting less than 12 hours, while another 81 respondents reported an outage lasting four or more days.
Figure 2. Duration of the Most Impactful Power Outage Experienced by Survey Respondents
Household Capabilities Disrupted During Recent Power Outages
Respondents reported an average of 4.51 disrupted secondary capabilities per household. Cooling the home and food refrigeration were the most commonly reported disruptions, with 250 respondents (63.3%) reporting disruptions in keeping their homes cool and 248 respondents (62.8%) reporting disruptions in keeping their food properly chilled. Another impact widely reported by respondents was an inability to operate important medical devices inside the home, such as continuous positive airway pressure (CPAP) machines, ventilators, or dialysis machines. Respondents also mentioned that the outage affected their ability to light the home and access potable water.
As shown in Figure 3, respondents identified two secondary capabilities—cooling and food refrigeration—as having the most significant household impacts, with 69 households (17.5%) and 68 households (17.2%) ranking this disruption as having the “greatest impact” on their household health and well-being. By comparison, fewer respondents reported capability disruptions to refrigerating medication (42 households; 10.6% of respondents) or water-related sanitation activities such as keeping clean, using the toilet, or washing dishes, etc. (76 households; 19.2% of respondents). However, respondents who experienced these two disruptions frequently ranked them as having the greatest impact on household health and well-being; with approximately 35.7% of respondents ranking medication refrigeration first and 32.9% of respondents ranking sanitation disruptions first.
Figure 3. Disrupted Capability Causing Most Harm to Household Health and Well-Being
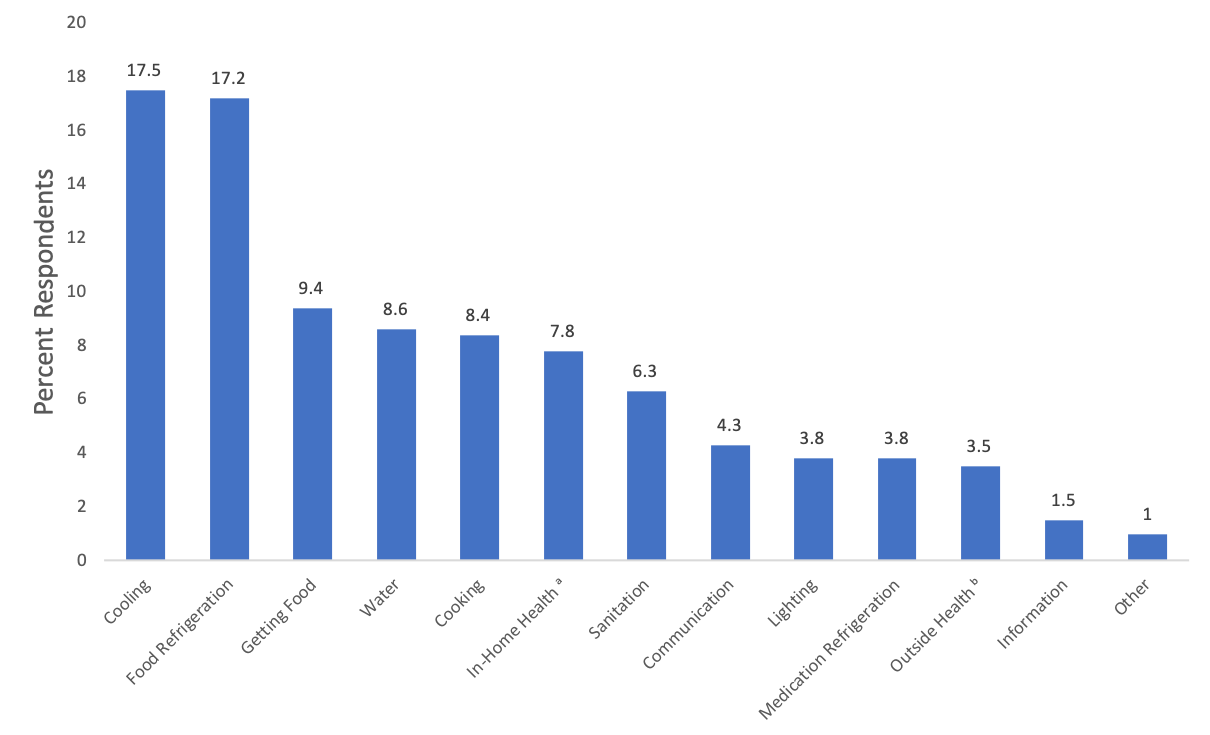 Note. Survey respondents were asked to rank which secondary capability disruptions caused the most impacts on their household health and well-being (refer to Appendix B, question 4.5). The chart depicts the percent of respondents who ranked each item first.*
a"In-Home Health" refers to disruptions in the use of in-home medical devices.
b"Outside Health" refers to disruptions in accessing medical care outside the home.
Effect of Outage Duration on Number of Disrupted Secondary Capabilities
Our statistical analysis showed a significant but weak positive correlation between the duration of the outage and the number of disrupted secondary capabilities. As Table 1 reports, the correlation between the two was relatively weak (Spearman’s rho=0.200) but highly significant (p-value=.0000297) (see Table 1). We observed a similar relationship in our multiple linear regression results (see Model 1 in Appendix C). After controlling for other variables (e.g., income, urban/rural community, generator access, etc.), the number of disrupted household capabilities increased significantly with outage duration (p = 0.00161). While the number of disruptions increased as the outage time increased, our results did not indicate that the types of interruptions, nor the rankings of disruption types, varied based on the duration of the outage.
Table 1. Correlations Between Outage Duration and Household Outcomes
| Effects of Outage on Households | Outage Duration (hours)a | Relative Outage Durationb |
| Number of disrupted capabilities | (Pearson’s) r = 0.143** |
(Spearman’s) rho = 0.201*** |
| Number of disrupted capabilities requiring additional time | (Pearson’s) r = 0.155** |
(Spearman’s) rho = 0.174*** |
| Number of disrupted capabilities requiring additional money | (Pearson’s) r = 0.173*** |
(Spearman’s) rho = 0.193*** |
| Well-being (change in life satisfaction) | (Pearson’s) r = -0.001 |
(Spearman’s) rho = -0.018 |
| Physical Health Impacts (0-10 scale) | (Pearson’s) r = 0.005* |
(Spearman’s) rho = 0.035 |
| Mental Health Impacts (0-10 scale) | (Pearson’s) r = 0.099* |
(Spearman’s) rho = 0.111* |
Note. Table reports the results of univariate analysis between outage duration and household outcomes. Refer to Appendix B, question 3.4 to see categories of power outage durations used in the survey. Statistically significant correlations are noted in bold.
aUsing Pearson’s correlation coefficient (r) statistical test to measure the association between outage duration (midpoint of outage duration categories in hours) and household outcomes.
bUsing Spearman’s rank correlation coefficient (rho) statistical test to measure the strength of association between relative outage duration (as ordinal or ranked categories) and household outcomes.
* p <.05. ** p <.01. *** p <.001.
Time, Monetary, Health, and Well-Being Costs Associated with Disrupted Capabilities
As a consequence of an outage, respondents reported on average 2.8 disrupted secondary capabilities. For each disrupted secondary capability, respondents reported spending an average of 2.8 hours trying to cope with each disruption, resulting in an average total of 11.6 additional hours spent adapting to all disrupted household capabilities over the duration of the outage. For example, if one of the disrupted secondary capabilities was accessing drinking water, a household may have reported additional time needed to travel or wait in line at a store to buy bottled water. Efforts to keep food cool during disruptions and replace food that was lost to spoilage resulted in the highest burdens, both in terms of additional hours per household and aggregate hours across the sample. Similarly, respondents also reported an average of 2.8 disrupted secondary capabilities which required additional money. Respondents estimated that they spent $46.50 addressing each disruption on average. In total, households spent an average of $195.35 to address all disrupted secondary capabilities during the duration of the outage. The monetary burdens of disruptions closely reflected the time burdens, as efforts to keep food cool and replace spoiled food resulted in the highest per-household and cumulative expenses, indicating that these activities are not only time and financially intensive, but are also widely felt.
As Figure 4 depicts, disruptions to cooling the home, refrigerating food, and using important in-home medical equipment were the interruptions most frequently cited by respondents as affecting the physical health of household members. This is unsurprising, as insufficient capacity to sustain these secondary capabilities can have direct consequences on physical health (e.g., heat stroke, food spoilage, and health crises resulting from nonfunctional medical devices). In regard to mental health, disruptions to secondary capabilities to cool the home and refrigerate food were also cited by respondents as having negative effects. But, in addition, lost communication capabilities also harmed the mental health of respondents and their household members. The percent of respondents reporting mental health consequences from communication disruptions (24.1%) was nearly double that of respondents reporting physical health consequences from communication disruptions (12.9%).
Figure 4. Number of Respondents Reporting Physical and Mental Health Impacts from Disrupted Household Capabilities
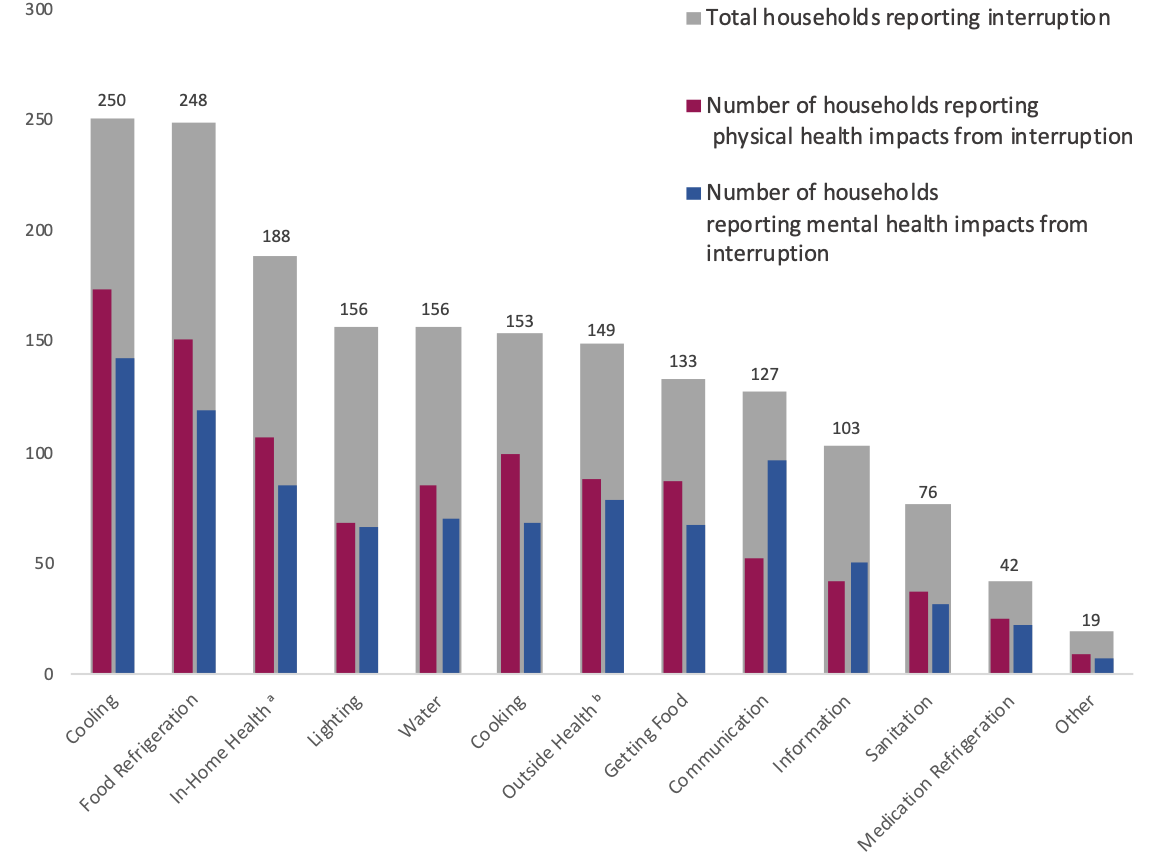 Note. The chart shows the total number of respondents who indicated disrupted household capabilities during recent power outages (gray bars) and the number of respondents who reported these interruptions affected the physical (red) and/or mental (blue) health of household members. Note that health impacts included in this figure may include both direct and indirect health impacts.*
aIn-home health refers to disruptions in the use of in-home medical devices.
bOutside health refers to disruptions in accessing medical care outside the home.
Most respondents and their households suffered well-being losses as a result of the outages, but responses varied. Approximately 13.4% of respondents declined to answer the question. Of respondents who did answer, more than half (56.7%) reported having lower life satisfaction as a result of the outage. On the other hand, nearly one-third (31.6%) of respondents reported the outage had no effect on their well-being and slightly more than one in ten respondents (11.7%) reported it increased their life satisfaction.
Variation in Disruption Impacts by Outage Duration
We expected that longer-duration outages would result in more disrupted household activities, which, in turn, would cause households to spend additional time and money. As reported in Table 1 above, our results revealed a highly significant (p-value = 0.00000544), but weak (Spearman’s rho = 0.193), correlation between the duration of the outage and the number of interrupted secondary capabilities requiring additional time. We also found a statistically significant relationship between the duration of the outage and the number of interrupted secondary capabilities requiring additional money; the correlation was relatively weak (rho=0.175), but highly significant (p-value=0.0002393). There was no significant correlation, however, between outage duration and changes in well-being (in terms of reported life satisfaction). A full summary of these results is provided in Table 1. We also found that the findings summarized in Table 1 were supported by our multivariate regression analysis which is available in Appendix C.
The Effects of Social Capital, Community Ties, and Community Cohesion on Mitigating Household Impacts
We hypothesized that households with higher levels of social capital would be able to mitigate the impacts from power outages. This hypothesis was suggested by previous studies of social capital and community resilience (Aldrich & Meyer, 2015; Aldrich, 2012; Roque et al.,2020). However, our results did not find a statistically significant relationship between overall social capital and the types of interruptions households experienced, nor did we find any kind of statistically significant relationship between the aggregate social capital levels and the types of disrupted activities that had the greatest impact on households. Moreover, the study did not find any relationship between overall social capital and the time or monetary costs associated with mitigating outage impacts. This surprising result contradicts findings of resilience studies that have strongly linked social capital with increased adaptive capacity and resilience. This finding may be partially explained by the influence of the timing of this study being completed during the COVID-19 pandemic, resulting in lower reported social capital scores. The study did however find a slight positive relationship between aggregate social capital and change in reported life satisfaction values (Spearman’s rho=0.106, p-value=0.05).
In terms of the influence of specific types of social capital on household outcomes, univariate analysis revealed statistically significant negative relationships between social trust and the count of interruptions (Pearson’s r=-0.12, p=0.009), and between community ties and the count of interruptions (Pearson’s r=-0.11, p=0.035). However, when controlling for other variables (see Appendix C, Model 1), only social trust was statistically significant (r2= -0.309, p=0.091). Results also showed a weak positive correlation between well-being outcomes and strength of association (Spearman’s rho= 0.095, p=0.042). However, the multiple regression analysis (see Appendix C, Model 8) did not reveal any statistically significant relationships between social capital types and changes in reported well-being. The univariate correlation results related to social capital are summarized in Table 2, and the multiple linear regression results are provided in Appendix C, Model 1.
Table 2 . Correlations Between Social Capital and Household Outcomes
| Effects of Outage on Households | Frequency of Formal Connectiona | Strength of Associationb | Social Trust c | Community Ties d | Overall Social Capital Meane |
| Number of disrupted capabilitiesf | r = 0.044 |
r = -0.035 |
r = -0.119** |
r = -0.011* |
r = 0.059 |
| Number of disrupted capabilities requiring additional timef | r = 0.124 |
r = -0.007 |
r = 0.017 |
r = -0.022 |
r = 0.039 |
| Number of disrupted capabilities requiring additional moneyf | r = 0.130 |
r = -0.004 |
r = -0.011 |
r = -0.027 |
r = 0.037 |
| Well-being (change in life satisfaction)g | rho = 0.064 |
rho = 0.095* |
rho = 0.06 |
rho = 0.051 |
rho = 0.106* |
Note. Correlations of statistical significance are noted in bold. Refer to Appendix B, section 1 to view survey questions related to social capital.
aFrequency of formal connection is a type of social capital that refers to the frequency that respondents participate in religious, cultural, or community events and/or volunteer within their community (evaluated in this study using a 7-point Likert scale).
bStrength of association is a type of social capital that refers to the importance of community gatherings or events to the respondent (evaluated in this study using a 5-point Likert scale).
cSocial trust is a type of social capital that refers to the respondents’ trust in people living in their neighborhood (evaluated in this study using a 5-point Likert scale).
dCommunity ties is a type of social capital that refers to how well the respondent relates to people living in their neighborhood (evaluated in this study using a 5-point Likert scale).
eOverall social capital mean is calculated by taking the mean of the Likert scale values for each of the four social capital types evaluated. Note that the values for the Frequency of Formal Connection were scaled to ensure equal influence across all four social capital types.
fUsing Pearson’s correlation coefficient (r) statistical test to measure the association between two sets of continuous variables.
gUsing Spearman’s rank correlation coefficient statistical test to measure the strength of association between two sets of ordinal or ranked variables.
p <.05. ** p <.01. *** p <.001.
Variation in Disrupted Household Capabilities and Costs Across Community Types
Our chi-square tests did not indicate significant differences in the types of secondary capability disruptions reported by rural, urban, and suburban households. However, our results did show notable differences in the types of healthcare service disruptions that most affected households in each community type. In particular, suburban households were less likely than rural or urban households to report disruptions to in-home health devices—36.0% of suburban households reported these kinds of disruptions, as compared to 49.0% of urban households and 54.0% of rural households. This difference was statistically significant (X2 = 6.37, p = 0.041). Conversely, urban households were more likely to report disruptions to accessing healthcare outside the home, with 45.0% of urban households reporting disrupted capability in this area compared to 35% of rural households and 32% of suburban households. These differences were also statistically significant, albeit at a lower level (X2 = 5.01, p = 0.081).
Our results also revealed differences in how outages impacted the secondary capabilities of accessing and storing food and accessing water between urban, rural, and suburban communities. Urban households were twice as likely as other households to report the lack of food refrigeration as having the single greatest impact on their household (23%, compared to 13% of rural households and 12% of suburban households). Conversely, urban households were slightly less likely to report food access as being their single greatest impact (7%, as compared to 11% of rural and suburban households). Urban and suburban households were also slightly less likely than rural households to report accessing potable water as their greatest impact; 12% of rural households reported this as their greatest impact, as compared to 8% of suburban households and 9% of urban households. While none of these differences were statistically significant on their own, these differences collectively suggest that rural households faced more challenges in accessing important goods than other households, likely as a result of relatively low resource density in rural areas.
Our analysis of the physical and mental health impacts resulting from the most impactful disrupted capabilities revealed that urban and suburban residents most commonly mentioned the lack of food refrigeration, whereas rural households most commonly reported interruptions with cooling. Table 3 shows the percentage of respondents who reported mental and/or physical health impacts from their top three most impactful capability disruption types (based on the number of households of each community type reporting significant impacts from each disruption, denoted by the ‘n’ column for each community type). As shown in Table 3, 75.9% (82 out of 108) of urban households and 78.7% (37 out of 47) of suburban households indicated Food Refrigeration disruptions caused mental health impacts while 71.3% (77 out of 108) of urban households and 74.5% (35 out of 47) suburban households said it caused physical health impacts. In contrast, disruptions to in-home cooling were most commonly reported by rural households with 76.2% (48 out of 63) of rural households reporting an impact on mental health, and 77.8% (49 out of 63) indicating an impact on physical health.
Table 3. Respondents Reporting Mental and Physical Health Impacts Resulting from Most Impactful Disrupted Capabilities
| % | n | % | n | % | n | % | n | % | n | % | n | |
| Accessing Food | 93.3 | 60 | 60.0 | 20 | 90.0 | 30 | 88.3 | 60 | 61.9 | 20 | 90.0 | 30 |
| Cooking | 82.1 | 67 | 73.1 | 26 | 77.8 | 27 | 77.3 | 67 | 68.0 | 26 | 67.9 | 27 |
| Watera | 75.8 | 62 | 73.9 | 23 | 80.0 | 40 | 69.8 | 62 | 65.2 | 23 | 72.5 | 40 |
| Sanitationb | 76.0 | 25 | 76.5 | 17 | 75.0 | 16 | 72.0 | 25 | 70.6 | 17 | 75.0 | 16 |
| Food Refrigeration | 75.9 | 108 | 78.7 | 47 | 65.3 | 49 | 71.3 | 108 | 74.5 | 47 | 69.4 | 49 |
| Medication Refrigeration | 70.6 | 17 | 100.0 | 8 | 28.6 | 7 | 66.7 | 17 | 100.0 | 8 | 14.3 | 7 |
| Cooling | 73.5 | 102 | 81.8 | 44 | 76.2 | 63 | 74.5 | 102 | 71.1 | 44 | 77.8 | 63 |
| Lighting | 80.4 | 56 | 75.9 | 29 | 73.2 | 41 | 73.2 | 56 | 55.2 | 29 | 63.4 | 41 |
| Information | 76.9 | 26 | 57.1 | 14 | 88.5 | 25 | 73.1 | 26 | 42.9 | 14 | 73.1 | 25 |
| Communication | 91.4 | 35 | 70.6 | 17 | 78.8 | 33 | 62.9 | 35 | 58.8 | 17 | 54.5 | 33 |
| Outside Healthc | 51.9 | 52 | 47.1 | 17 | 48.4 | 31 | 48.1 | 52 | 47.1 | 17 | 45.2 | 31 |
| In-Home Healthd | 39.6 | 53 | 35.3 | 17 | 47.9 | 48 | 39.2 | 53 | 33.3 | 17 | 43.8 | 48 |
Note. The number of urban, suburban, and rural households in our sample totaled 182, 76, and 121, respectively. The percentage columns were calculated based on the number of households reporting a mental and/or physical health impact from each disruption type out of the number of households indicating that disrupted capability had a significant impact on their household (as denoted in the ‘n’ column) for each community type.
aWater refers to disruptions in accessing potable water specifically.
bSanitation refers to disruptions in water-related sanitation activities such as bathing, using the toilet, and washing dishes.
cOutside health category refers to disruptions in accessing medical care outside the home.
dIn-home health refers to disruptions in the use of in-home medical devices.
While disruptions to food refrigeration and cooling caused the greatest number of households to experience physical and mental impacts, these disruptions did not cause the most severe health impacts. In the survey, we asked respondents to rate the severity of disrupted capabilities on their physical and mental health on a scale of zero to 10, with zero being “no impact” and 10 being “significant impact”. Our results are reported in Table 4. Urban households reported that restricted access to food resulted in the most severe consequences for both mental health (average severity = 5.95) and physical health (average severity = 5.96). For suburban households, disruptions to using in-home medical devices caused the most severe mental (average severity = 5.50) and physical (average severity = 6.50) impacts. Lastly, for rural households, restricted access to food caused the most severe physical health impacts (average severity = 5.37), while disruptions to communication systems resulted in the most severe mental health impacts(average severity = 5.23).
Table 4. Average Severity of Mental and Physical Health Impacts by Community Type
| Accessing Food | 5.95 | 5.33 | 5.00 | 5.96 | 4.54 | 5.37 |
| Cooking | 4.78 | 4.79 | 4.43 | 4.73 | 5.00 | 4.42 |
| Water | 4.30 | 3.94 | 4.28 | 4.09 | 4.00 | 4.00 |
| Sanitation | 5.58 | 5.08 | 4.92 | 4.67 | 4.50 | 4.67 |
| Food Refrigeration | 4.88 | 4.14 | 4.50 | 4.08 | 3.63 | 4.06 |
| Medication Refrigeration | 4.67 | 3.88 | 4.50 | 4.33 | 3.13 | 5.00 |
| Cooling | 4.99 | 4.36 | 4.77 | 4.58 | 4.34 | 4.06 |
| Lighting | 5.71 | 4.50 | 4.23 | 4.37 | 4.44 | 4.08 |
| Information | 4.45 | 2.88 | 4.39 | 3.58 | 3.67 | 3.68 |
| Communication | 4.91 | 4.42 | 5.23 | 3.09 | 4.70 | 4.17 |
| Outside Health | 3.89 | 4.00 | 4.07 | 3.56 | 3.88 | 4.07 |
| In-Home Health | 5.24 | 5.50 | 4.43 | 5.05 | 6.50 | 3.48 |
Note. The number of urban, suburban, and rural households in our sample totaled 182, 76, and 121, respectively. Respondents rated the severity of secondary capability disruptions on their physical and mental health on a scale of zero to 10, with zero being “no impact” and 10 being “significant impact.” Average severity score was calculated using only those responses that indicated some degree of physical or mental impact. The highest severity score for mental and physical health impacts across community types are bolded in the table.
Although not every respondent indicated specific health concerns, some commonly reported acute physical health concerns included heat-related issues (ranging in severity from discomfort and sleep disruption to heat stroke), and complications from pre-existing conditions (notably asthma, high blood pressure, and sleep apnea). One respondent noted health impacts related to a substance abuse relapse. More chronic (or “delayed-impact”) physical health concerns focused around health impacts of disrupted diets, including some specifically tied to diabetes, others related to eating pre-packaged and/or non-perishable foods. The most common mental health concerns were stress and anxiety, with specific causes of these emotions including concerns about the functioning of health care devices, the ability to maintain hygiene and health, and fear over the ability to take care of dependents. Some also mentioned depression and sadness, and frustration and anger (specifically, frustration over watching their resources go to waste and anger over-paying for services that they did not receive).
Overall, rural respondents reported slightly more severe health and well-being impacts due to outages than other respondents, and were more likely to decline to answer the question about health and well-being (14.8% of rural households, compared to 10.9% of urban households and 11.5% of suburban households). Multiple regression analysis did not reveal statistically significant differences in overall well-being or mental health outcomes by community type, but it did indicate that after controlling for other variables, the physical impacts reported by urban households were slightly less than those experienced by households in either rural or suburban communities (p = 0.057; see Appendix C, Model 9 for additional details).
Conclusions
Results of this study contribute to the existing body of literature that reviews the connections between disasters, infrastructure disruptions, and the impacts on households. This study aligns with the impacts as reviewed by Obolensky (2019), including important economic and health consequences. The results also agree with Meng and Mozumder (2021) and Chatterjee and Mozumber (2015), by providing additional evidence that infrastructure disruptions have significant impacts on households, including financial burdens, well-being losses, and health consequences. More specifically, this study found that:
Households experienced more monetary burdens as outage durations increase, and that the number of disruptions to household capabilities and the time households spent to cope with disruptions also increased with outage duration.
Electricity outages resulted in well-being losses for a majority of households but there were no statistically significant increases in well-being loss associated with longer duration outages.
Access to a generator had little influence on mitigating household impacts. This finding aligns with the findings of Chatterjee and Mozumber (2015), who discuss caveats of gasoline-powered generators including dependence on availability of fuel (which likely increase time and cost burdens) and noise pollution, which may negate household benefits.
Social capital had only small, specific influences on household impacts from a power outage. This result does not align with previous studies such as Aldrich and Meyer (2015) and Roque et al. (2020), which emphasize the beneficial role of social networks in enhancing recovery and resilience. These findings may be partially explained by the COVID-19 pandemic which may have reduced the levels of social capital reported by respondents.
Specific household types suffered more severe consequences from outages. For example, households with a member with a disability reported more types of household disruptions and more severe mental health impacts. Additionally, households with children under age 5 reported more severe physical and mental health impacts. Also, households with incomes below the poverty line, on average, reported less disruption types, but spent significantly more time and money addressing each disrupted capability, whereas higher income households experienced a greater number of disruptions types requiring more additional time and very slightly greater monetary burdens overall.
Rural households experienced more health and well-being impacts from power outages than urban and suburban households.
Public Health Implications
This study suggested several public health consequences of power outages in Puerto Rico and its results should be used to inform emergency preparedness and mitigation strategies for Puerto Rican communities. The main implications are discussed below.
Disruptions to cooling and food refrigeration were the most impactful. Interventions and strategies focused on providing cooling resources (e.g., fans and/or air conditioning at community centers with back-up power systems) and refrigeration (i.e., access to ice or centralized refrigeration for food and medicine) would provide the greatest opportunities for reducing the health and well-being impacts experienced by most households.
Disruptions to in-home health devices, refrigeration of medication, and challenges with sanitation were very impactful for affected households. Preparedness efforts focused on identifying households that depend upon electricity to power medical devices or to refrigerate medication should be prioritized and contingency plans developed. Particularly for sanitation disruptions, providing access to facilities (i.e., restrooms and washrooms with back-up power systems) may be appropriate.
Communication disruptions had disproportionate impacts on mental health. A quarter of households reported that communication and information disruptions resulted in mental health impacts. Therefore, measures to increase the flow of information to households and communities will likely be beneficial. Such measures may include enhancing community outreach by community organizations and external agencies or infrastructure providers to increase the amount of information sharing as well as transparency during emergency events. Also, diversifying communication channels and methods, and ensuring that communication means are not so easily disrupted (e.g., by providing back-up power supplies) may also be beneficial.
Households with young children were significantly more likely to report physical and mental health impacts from an outage. Providing items for young children (e.g., baby formula, milk, diapers, medications for young children) should be prioritized, and pediatric mental health services should be provided for families with young children. More generally, prioritizing the maintenance of childcare services or refuge centers (with back-up power) for families to bring young children to play, learn, and socialize during outages would likely mitigate the anxiety, frustration, and stress reported by these families.
Households with a disability reported a higher number of disruption types and more severe mental health impacts. Preparedness efforts specific to disability type, and opportunities for dependent care will likely be important for mitigating burdens by these households.
Rural households reported more health and well-being impacts than urban and suburban households. Rural households were more likely than other households to report problems maintaining the use of electricity-dependent in-home healthcare devices and were more likely to identify challenges related to accessing food and potable water relative to other household types. For these communities, households would benefit from stockpiling essential goods such as water, non-perishable food supplies, and medicine in case of power outages.
Strategies for mitigation and preparedness should be customized by local context and location. Although rural households reported worse impacts overall, suburban and urban households also reported significant impacts. Suburban homes reported challenges with accessing food and healthcare outside the home. Streamlining access to distribution centers may make sense in these communities, as higher population densities may provide additional justifications for doing so. Urban households, on the other hand, were twice as likely as households in rural or suburban communities to report food refrigeration as having the single greatest impact. Increasing availability of ice or strategies to provide centralized refrigeration capacity with back-up systems may be helpful.
Although the implications highlighted here are geared toward the household and community level, the findings of this study may also be used to inform interventions and investments by larger scale governmental organizations and infrastructure providers. For example, understanding the most disrupted secondary capabilities may inform prioritization of government or provider-funded resilience investments for particular facilities and/or service providing entities. This study also provides public health justifications for more information and reliable communication flows, as well as increased transparency, across all levels and organization types. More generally, the implications of this research emphasize the significant toll that infrastructure disruptions cause households and communities, further justifying the social value of resilience investments.
References
-
Houser, T. & Marsters, P. (2018, April 18). The World’s Second Largest Blackout. Rhodium Group. https://rhg.com/research/puerto-rico-hurricane-maria-worlds-second-largest-blackout/ ↩
-
Instituto Caribeño de Derechos Humanos (ICAHD). (2017, December 7). Justicia Ambiental, desigualdad y pobreza en Puerto Rico: Informe multisectorial sobre las violaciones de derechos económicos, sociales y medio-ambientales tras el paso de los huracanes Irma y María en Puerto Rico. https://noticiasmicrojuris.files.wordpress.com/2018/05/final-informe-cidh-audiencia-pr-dic-2017.pdf ↩
-
Ferré, I. M., Negrón, S., Shultz, J. M., Schwartz, S. J., Kossin, J. P., & Pantin, H. (2019). Hurricane Maria's impact on Punta Santiago, Puerto Rico: community needs and mental health assessment six months postimpact. Disaster Medicine and Public Health Preparedness, 13(1), 18–23. https://doi.org/10.1017/dmp.2018.103 ↩
-
Rodriguez, C. H. (2018, June 14). Water quality in Puerto Rico remains unclear months after Hurricane Maria. PBS. Retrieved from https://www.pbs.org/newshour/health/water-quality-in-puerto-rico-remains-unclear-months-after-hurricane-maria ↩
-
Irfan, U. (2018, July 3). Puerto Rico’s deadly record blackout is almost over. Vox. Retrieved from https://www.vox.com/2018/7/3/17530814/puerto-rico-power-blackout-over-hurricane-maria ↩
-
Sutter, J. D., & Sosa Pascual, O. (2018). Deaths from bacterial disease in Puerto Rico spiked after Maria. CNN. Available at: https://www.cnn.com/2018/07/03/health/sutter-leptospirosis-outbreak-puerto-rico-invs/index.html ↩
-
Lloréns, H., & Stanchich, M. Water is life, but the colony is a necropolis: Environmental terrains of struggle in Puerto Rico. Cultural Dynamics, 31(1-2), 81–101. https://doi.org/10.1177/0921374019826200 ↩
-
Joseph, S. R., Voyles, C., Williams, K. D., Smith, E., & Chilton, M. (2020). Colonial neglect and the right to health in Puerto Rico after Hurricane Maria. American Journal of Public Health, 110(10), 1512-1518. https://doi.org/10.2105/AJPH.2020.305814 ↩
-
U.S. Census Bureau (2020). Puerto Rico QuickFacts, 2016-2020. American Community Survey 5-year estimates. https://www.census.gov/quickfacts/PR ↩
-
Obolensky, M. A. B., Erman, A. E., Rozenberg, J., Maruyama Rentschler, J. E., Avner, P., & Hallegatte, S. (2019). Infrastructure Disruptions: How Instability Breeds Household Vulnerability. World Bank Policy Research Working Paper, (8902). ↩
-
Casey, J. A., Fukurai, M., Hernández, D., Balsari, S., & Kiang, M. V. (2020). Power outages and community health: a narrative review. Current environmental health reports, 7(4), 371-383. ↩
-
Chatterjee, C., & Mozumder, P. (2015). Hurricane Wilma, utility disruption, and household well-being. International Journal of Disaster Risk Reduction, 14, 395-402. ↩
-
Meng, S., & Mozumder, P. (2021). Hurricane sandy: damages, disruptions and pathways to recovery. Economics of Disasters and Climate Change, 5(2), 223-247. ↩
-
Aldrich, D. P., & Meyer, M. A. (2015). Social capital and community resilience. American Behavioral Scientist, 59(2), 254-269. https://doi.org/10.1177/0002764214550299 ↩
-
Aldrich, D. P. (2012). Building resilience. Social Capital in Post-Disaster Recovery, 1-166. ↩
-
Roque, D., A., Pijawka, D., & Wutich, A. (2020). The role of social capital in resiliency: Disaster recovery in Puerto Rico. Risk, Hazards & Crisis in Public Policy, 11(2), 204-235. ↩
-
Sen, A. (2001). Development as freedom. Oxford Paperbacks. ↩
-
Robeyns, I. & Byskov, M.F. (2021). The Capability Approach, The Stanford Encyclopedia of Philosophy (Winter 2021 Edition), Edward N. Zalta (ed.). Retrieved from https://plato.stanford.edu/archives/win2021/entries/capability-approach/ ↩
-
United Nations Development Programme. Human development report 2014: Sustaining human progress-reducing vulnerabilities and building resilience, (New York: United Nations, 2014), http://hdr.undp.org/en/content/human-development-report-2014 ↩
-
Osmani, S. R. (2016). The Capability Approach and Human Development: Some Reflections. Retrieved from UNDP http://hdr.undp.org/en/content/capabilityapproach-and-humandevelopment-some-reflections ↩
-
Day, R., Walker, G., & Simcock, N. (2016). Conceptualising energy use and energy poverty using a capabilities framework. Energy Policy, 93, 255-264. https://doi.org/10.1016/j.enpol.2016.03.019 ↩
-
Hick, R. (2012). The capability approach: insights for a new poverty focus.* Journal of social policy, 41*(2), 291-308. ↩
-
Dargin, J. S., & Mostafavi, A. (2020). Human-centric infrastructure resilience: Uncovering well-being risk disparity due to infrastructure disruptions in disasters. PloS one, 15(6), e0234381. https://doi.org/10.1371/journal.pone.0234381 ↩
-
Entwistle, V. A., & Watt, I. S. (2013). Treating patients as persons: a capabilities approach to support delivery of person-centered care. The American Journal of Bioethics, 13(8), 29-39. https://doi.org/10.1080/15265161.2013.802060 ↩
-
White, R. G., Imperiale, M. G., & Perera, E. (2016). The Capabilities Approach: Fostering contexts for enhancing mental health and well-being across the globe. Globalization and health, 12(1), 1-10. https://doi.org/10.1186/s12992-016-0150-3 ↩
-
Mitchell, P. M., Roberts, T. E., Barton, P. M., & Coast, J. (2017). Applications of the Capability Approach in the Health Field: A Literature Review. Social Indicators Research, 133(1), 345–371. https://doi.org/10.1007/s11205-016-1356-8 ↩
-
The World Bank. (2018). Urban Population (% of Total Population) -- Puerto Rico. https://data.worldbank.org/indicator/SP.URB.TOTL.IN.ZS?locations=PR ↩
-
Cho, S., & Kang, H. (2017). Putting behavior into context: Exploring the contours of social capital influences on environmental behavior. Environment and Behavior, 49(3), 283-313. ↩
Clark, S., Peterson, S., Rivera-Gutiérrez, R., Zambrana-Rosario, A. C., & Shelly, M. (2022). Impact of Infrastructure Disruptions on Puerto Rican Household Capabilities, Health, and Well-Being (Natural Hazards Center Public Health Disaster Research Report Series, Report 21). Natural Hazards Center, University of Colorado Boulder. https://hazards.colorado.edu/public-health-disaster-research/impact-of-infrastructure-disruptions-on-puerto-rican-household-capabilities-health-and-well-being