Strengthening Disaster Preparedness
Assessing Risk Perception and Early Warning for Flash Flooding
Publication Date: 2025
Abstract
This report describes a study of risk perception, protective action, and early warning systems for flash floods in Mayfield, Kentucky. Using a mixed-methods approach, including interviews and surveys, we examined how residents responded to warnings issued during the July 18-19, 2023, flash flood event. The results showed that most residents relied on traditional media sources—such as local television and the Weather Channel—for information about the risk of flash flooding and what they should do. Despite the availability of early warnings, many residents reported receiving them only shortly before the flood, which limited their preparedness. Risk perception and access to diverse information sources were significant predictors of protective actions. We also found demographic factors, such as ethnicity to influence protective action, with Hispanic or Latino residents less likely to engage in protective action. These findings highlight the need for more inclusive and targeted early warning systems that improve the timeliness and clarity of risk communication to enhance disaster preparedness across diverse communities.
Introduction
Globally, flash floods continue to be a severe and life-threatening hazard despite significant progress in flood detection, forecasting, and early warning systems. Flash floods can occur after intense and short-duration rainfall, which is an issue across diverse communities in the United States (Morss et al., 20161; Khajehei et al., 20202; Smith, 20243; National Weather Service [NWS], n.d.-a4). Due to extreme weather patterns, flash floods have increased in frequency and intensity across the United States (Alipour et al., 20205). Flash flood events affect millions of individuals and communities annually, causing substantial economic and non-economic losses, as well as damage to life and infrastructure (Allen et al., 20206; Stablein et al., 20227). For instance, between 1980 and 2023, inland floods were responsible for losses and damage totaling $196.6 billion (Smith, 2024).
Flash floods can result in severe consequences for individuals and communities, particularly when warnings issued by authorities such as the National Weather Service or local emergency managers are not acted upon. People may fail to respond to these warnings due to a combination of factors including underestimation of flood risk, overconfidence in personal safety, social influence, or limitations in how and when warnings are communicated. These challenges are especially acute during fast-onset events like flash floods (Alipour et al., 2020; Becker et al., 20158; Drobot & Parker, 20079). Therefore, it is essential to issue timely early warnings about flash floods that can effectively influence risk perception and protective actions. By understanding how individuals and communities perceive and respond to risk information, we can improve existing response systems and public outreach (Morss et al., 2016). The increasing impact of flash floods also highlights the need to improve community preparedness, as preparing for disasters is critical to adapting to and mitigating their impact (Bodoque et al., 201910; Kellens et al., 201311; Perera et al., 202012).
Literature Review
As extreme events continue to cause severe damage, the critical role early warning systems play in promoting protective action cannot be overemphasized. Previous research on flood and early warning systems has highlighted their critical role in shaping response actions and reducing disaster impacts (Cools et al., 201613; Perera et al., 2020). Early warning systems' effectiveness relies on predictive models, real-time data analyses, and communication channels, which inform timely evacuation, mobilization of resources, and community engagement in protective measures (De Elia et al., 202414; Merz et al., 202015). Studies have shown that when early warnings are effectively communicated and understood, they positively influence risk perception and motivate preemptive actions among at-risk populations (Keller et al., 200616; Kuller et al., 202117; Potter et al., 201818; Wachinger et al., 201319).
Risk perception is “the process of collecting, selecting, and interpreting signals about uncertain impacts of events, activities, or technologies” (Wachinger et al., 2013, p. 1049). In the process, individuals perceive the likelihood and severity of a potentially harmful event. Scholars, including Lindell (201320), Lindell and Perry (200021), Solberg et al. (201022), and MacPherson-Krutsky et al. (202323), have highlighted the critical role of risk perception in motivating preparedness actions. However, research in disaster risk reduction has revealed that risk perception does not always directly lead to protective actions, such as structural changes or readiness for emergencies. While many studies have supported a positive link between heightened risk perception and proactive responses, others have reported weak or inconsistent relationships. This inconsistency may be due to varying definitions and measures of risk perception (MacPherson-Krutsky et al., 2023; Peers et al., 202124). Additionally, risk perception is dynamic and can evolve during the protective action decision process (Weinstein & Nicolich, 199325). Notably, elevated risk perception may not increase preparedness if individuals view the costs of preparing as too high or do not feel personally responsible for reducing the risks (Wachinger et al., 2013).
Individuals’ risk perceptions inform their willingness to take preventative measures against potential threats (Becker et al., 2015; Rana et al., 202026; Khajehei et al., 2020). People with higher risk perceptions are more likely to take protective actions against natural hazards (Becker et al., 2015). This, in turn, leads to increased climate change adaptation and disaster preparedness initiatives taken by communities (Birkholz et al., 201427; Rana et al., 2020). Risk perception is often assumed to lead directly to protective actions; however, empirical evidence has suggested a more complex relationship. While individuals with high levels of risk awareness may be inclined to consider protective measures, their actions often depend on additional factors like coping appraisals, which assess the perceived effectiveness of these actions and one's capability to perform them (Bubeck et al., 201228). Thus, high risk perception alone may not prompt protective behavior unless individuals also believe that specific measures can effectively reduce risks (Bubeck et al., 2012). By understanding how people perceive risk, we can better predict how they will respond to potential disasters, which can inform the effective design of early warning and risk communication strategies. Extant literature on risk perception indicates that several factors influence disaster preparedness. These factors are associated with individual sensory experiences, which can be influenced by knowledge, personal attributes, past experiences, and environmental conditions (Alipour et al., 2020; Harlan et al., 201929; Lazrus et al., 201630).
The protective action decision model (PADM) has been developed as a theoretical model to conceptualize protective actions that people take to protect themselves from natural hazards. The PADM lens provides insights into how people perceive risk, respond to alerts and warnings, and decide whether to take action to protect themselves. More specifically, it explores how people’s perceptions and other factors influence their information-seeking behaviors and other responses to hazard risk (Lindell & Perry, 201231; Terpstra & Lindell, 201332). The model incorporates information from a person's social and environmental surroundings, available social cues, and personal experience with a hazard. It helps to clarify how individuals evaluate threats, decide if they need more information, choose protective actions, and determine when they will take those actions (Lindell & Perry, 2012; Terpstra & Lindell, 2013). Previous studies have analyzed the perception of risk and early warning systems for natural hazards like hurricanes that occur gradually over time (Lazo et al., 201533; Huang et al., 201634). However, there is a lack of studies examining risk perception and early warning for flash floods (Morss et al., 201535; Lazarus et al., 2016; Zinda et al., 202136). Flash floods emerge suddenly, causing challenges for communication and disaster response. With the increasing likelihood of these events, research is needed to address gaps in knowledge concerning how people perceive risks, take protective measures, and prepare for flash floods.
Research Questions
This study examined the following research questions:
- What are the most effective communication strategies for reaching diverse community members with flash flood preparedness information, warnings, and alerts?
- How do risk perception and early warning systems influence preparedness for flash flooding?
Research Design
We used a mixed-methods approach consisting of semi-structured interviews and surveys to investigate individual risk perception of flash flooding, knowledge of early warning, and how these factors influence disaster preparedness. We chose a mixed methods approach to allow for triangulation, or, in other words, using multiple data sources to develop a holistic and nuanced understanding of the study topic (Thurmond, 200137; Creswell & Poth, 201638).
Study Site and Access
We chose Mayfield, Kentucky, for this research because it has experienced several disasters in recent years, including a tornado in December 2021 and a flash flood on July 18-19, 2023. This flash flood event led to severe damage, including washed-out roads and inundated homes and businesses. Hundreds of people experienced property damage, including waterlogged cars and fallen trees on homes; many of those affected were still recovering from the December 2021 tornado (NWS, n.d.-b39). Mayfield is a small, rural town with a population of approximately 10,075 in 2023 (U.S. Census Bureau, n.d.40). We use Mayfield as a case study to understand how rural contexts shape people’s risk perception, preparedness behaviors, and communication needs regarding flash flood hazards.
Semi-Structured Interviews
Sampling Strategy and Interview Sample
We used a snowball sampling technique to select participants for semi-structured interviews. We recruited participants who were adult residents affected by the July 18-19 flash flood and personnel who played a role in communicating with the public during the flash flood event. Potential participants were first identified using internet searches of local government websites and news media. These participants then recommended other prospective participants. We conducted semi-structured interviews with 14 participants that included adult residents, emergency responders, and representatives from governmental and non-governmental organizations (see Table 1; Creswell, 200941). We first contacted participants via email or telephone to request interviews. The interviews lasted a maximum of 50 minutes and were conducted in person or by videoconferencing. All interviews were recorded and transcribed for accuracy.
Table 1. Interview Participants by Category
| Residents | |
| Non-Governmental Organization Representatives | |
| Local Government Representatives | |
| Emergency Managers | |
| Total |
Interview Guide
We used an interview guide containing open-ended questions about participants’ experiences with the July 2023 flash flood in Mayfield. Topics included disaster response roles, preparedness, and risk perception. Participants were encouraged to describe their experiences in detail with questions such as:
- “How would you rate the effectiveness of communication efforts aimed at raising awareness of the risks associated with flash floods in Mayfield?”
- “How timely and accurate did you find the early warnings or alerts about the flash flood event?”
- “Did you encounter any challenges in accessing or understanding the early warning information provided for the flash flood?”
- “What, if anything, could be done to improve public understanding and perception of the risks posed by flash floods in Mayfield and similar areas in the future?”
These questions enabled us to gain a comprehensive understanding of the effectiveness of early warning communication in Mayfield during the July 2023 flash flood event.
Interview Data Analysis Procedures
We adopted a qualitative interpretive approach to analyzing interview transcripts. This approach allowed themes and concepts to emerge from transcripts (Yanow, 200042). In investigating individuals' risk perception of flash flooding, their knowledge of early warning, and how these factors influence disaster preparedness, we identified meaningful themes from the transcripts (Braun & Clarke, 200643, 202044). We used NVivo (Version 12) to code and manage the data.
Survey
Sampling Strategy and Survey Sample
Collecting data through surveys allowed us to quantify respondents’ experience of risk perception, the effectiveness of the early warning system, and how both influence their disaster preparedness. We used two purposive sampling techniques to recruit a diverse survey sample which varied across age, gender, socioeconomic status, race or ethnicity, and the severity of flood experience (Palinkas et al., 201545). First, the Mayfield Long-Term Recovery Group, a non-governmental organization, provided us with the contact information of residents who were affected by the flash flood. We mailed 100 surveys to this group.
Second, we identified specific areas affected by the flash flood using online searches and information from government agencies, which yielded three streets that were heavily impacted. To increase participation, the two lead authors went door-to-door on the identified streets and personally distributed an additional 100 surveys to residents in the area. We knocked on doors and, when residents were available, briefly explained the purpose of the study and asked if they would be willing to participate. In some cases, we left the survey and arranged to return later that day to collect the completed form. Others preferred to mail the survey back to us due to time constraints. For a few residents who agreed to participate on the spot, we administered the survey ourselves by reading the questions aloud and recording their responses. This personalized approach allowed us to accommodate different preferences and increase the likelihood of survey completion, and to recruit participants who had firsthand experience of the flash floods (Patton, 200246).
Across the two sampling strategies, we distributed a total of 200 surveys to Mayfield residents, and received 112 surveys in return, yielding a strong response rate of 56%. This high response rate was largely attributed to the door-to-door distribution approach, during which the two lead authors directly engaged with residents, asking residents to complete it and collecting it later the same day. This personal engagement helped foster trust and increased the likelihood of participation. In contrast, the response rate from the 100 surveys mailed using the NGO mailing list was significantly lower. Many surveys were not returned, likely due to relocation following the disaster, which reduced the effectiveness of this method. Of the 112 surveys returned, most were fully completed. A few were partially completed; however, they were retained for analysis because they met our predefined inclusion criterion of being at least 50% complete. Overall, the in-person approach proved far more effective, suggesting the value of direct community engagement when conducting survey research in similarly affected areas.
We prepared two versions of the survey—a paper version and an online version—to accommodate respondent preference. Both the online and paper versions were available to those participants whom we recruited door-to-door. To access the online version, respondents could click on a hyperlinked URL which we emailed to them during our conversation at their doorstep or scan a QR code from a flyer that we provided. In total, we received 92 completed paper surveys and 20 completed electronically.
Survey Measures
We adapted survey questions from previous studies that had used surveys to investigate residents’ risk perceptions and protective decision-making during flash flooding (i.e., First et al., 2022a47, 2022b48; Morss, 2015, 2016). In addition to demographic characteristics such as age, race, gender, income, and education, we adapted measures to capture risk perception and sources residents used to gain information and early warnings about flash flood. To measure flood protection actions, we asked respondents to describe to what extent they engaged in four proactive behaviors to protect themselves from flash floods on July 18-19, 2023. For each of the four questions, respondents used a 5-point Likert scale, ranging from 1 (strongly disagree) to 5 (strongly agree), to record their response. The specific questions used to measure flood protection behaviors are itemized in Table 2. We employed factor analysis to measure flash flood protective actions (Yong & Pearce, 201349). The Kaiser-Meyer-Olkin (KMO) measure of sampling adequacy was 0.752, and Bartlett's Test of Sphericity was significant (p < 0.001), indicating that the items were suitable for constructing a reliable measure. The final measure yielded a Cronbach's Alpha of 0.792, demonstrating acceptable internal consistency.
Table 2. Exploratory Factor Analysis of Flash Flood Protective Action Index
| I paid close attention to the weather forecasts and warnings because I was aware of the potential for flash floods that day | |||
| I searched for more information on flash flood threats' forecasted timing and severity (using, e.g., TV, social media, and online apps | |||
| I confirmed the threat of flash floods by checking for environmental cues, such as looking outside. | |||
| I took action to protect myself or my loved ones against the threat of flash flooding that day (e.g., I went to higher ground and avoided flooded areas). | |||
To measure residents’ flash flood risk perception, we asked respondents to describe the extent to which they felt that flash flooding posed a risk to their home, community, personal health, the health of family members, and their financial wellbeing. Respondents were asked to select from a scale of 1 (strongly disagree) to 5 (strongly agree), their level of agreement with the seven questions listed in Table 3. We employed factor analysis to construct the flash flood risk perception measure. The KMO value was 0.845, and Bartlett's Test of Sphericity was significant (p < 0.001), indicating the suitability of the data for constructing a measure. The resulting measure had a Cronbach's Alpha of 0.85, demonstrating strong internal consistency.
Table 3. Exploratory Factor Analysis of Flash Flood Risk Perception Index
| I think that a flash flood can cause major damage to my home | |||
| I think a flash flood can cause injury to me or other family members | |||
| I think that a flash flood is unpredictable | |||
| I think that flash floods can pose a great financial threat | |||
| Thinking about the possibility of a flash flood makes me feel fearful or worried | |||
| I consider my community to be at risk of flooding | |||
| I consider my home to be at risk of flooding. | |||
To measure early warning information sources, respondents were asked to indicate which of the following sources of information they accessed to learn about flash flooding:
- Local television news channel
- Local radio station
- The Weather Channel
- National Weather Service (NWS) Website
- NWS flash flood warnings(Wireless emergency alerts and warnings)
- Environmental cues (e.g., heavy rainfall, water on the street)
- NOAA Weather Radio
- Flood area barricades
- “Dip: Do not enter when flooded” signs
- Neighbors, friends, or family
- City or county officials
- Police officers
- Firefighters
- Emergency responders
- Social media (e.g., Facebook, X [Twitter], Instagram)
- Mobile weather apps.
The scores from these items were summed to create an index of early warning information sources, with a total score ranging from 1 to 15. A higher score indicates access to a greater number of hazard information sources.
Survey Data Analysis Procedures
We analyzed survey data using descriptive statistics such as frequencies, percentages, and cross-tabulation where appropriate. To explore how risk perception and early warning systems influence preparedness for flash flooding in Mayfield, we employed factor analysis to create the dependent and independent variables (risk perception and information sources), as described in section above. We used multiple regression to explore how these variables influence protective action in the face of a flood (Mallakpour & Villarini, 201650). Multiple regression showed how risk perception and early warning systems influence protective action.
Ethical Considerations
We offered survey participants $5 in compensation for completing the survey. The Murray State University Institutional Review Board granted exempt approval for all procedures related to interviewing and surveying participants about the flash flood in Mayfield on April 4, 2024.
Results
We present preliminary findings from our study in two parts. The first part outlines the demographic characteristics of survey respondents and provides descriptive statistics on the effectiveness of early warning communication before the flash flood event in Mayfield. The second part of the results reports the relationship between individual risk perception, early warning, and protective action against flash floods. Because this report is intended to be a preliminary analysis, we have focused here on our quantitative results. We will analyze the qualitative findings in more depth in a follow-up publication.
Survey Respondent Characteristics
Table 4 presents the descriptive characteristics of 112 survey respondents, showing their demographic and socioeconomic backgrounds. Among respondents who completed the survey, females represented the majority (56.2%), while males were 43.8%. Racially, the sample was predominantly White (72.3%), with Black or African American respondents making up 25%. Only 15.2% of respondents identified their ethnicity as Hispanic or Latino. Age distribution was relatively even across adult groups, with the two largest age groups being respondents ages 26-35 or 36-45 (19.6% each). Income levels varied widely, with the most common income groups being $10,000-$24,999 or $25,000-$49,999 (28.2% each). Education levels were mixed, with 32.7% having some college or technical school education. Homeownership was prevalent (61.7%) among the sample. Only 16.8% of survey respondents had national flood insurance.
Table 4. Descriptive Characteristics of Survey Respondents
| Gendera | |||
| Male | 43.8 | 46 | |
| Female | 56.2 | 59 | |
| Raceb | |||
| American Indian or Alaska Native | 2 | 2 | |
| Black or African American | 25 | 26 | |
| White | 72.3 | 73 | |
| Ethnicitya | |||
| Hispanic or Latino | 15.2 | 16 | |
| Non-Hispanic or Latino | 84.4 | 89 | |
| Agec | |||
| 18-25 | 8.8 | 9 | |
| 26-35 | 19.6 | 20 | |
| 36-45 | 19.6 | 20 | |
| 46-55 | 16.7 | 17 | |
| 56-65 | 16.7 | 17 | |
| 66-74 | 12.7 | 13 | |
| 75 and older | 5.9 | 6 | |
| Incomed | |||
| Less than $10,000 | 20.4 | 21 | |
| $10,000 - 24,999 | 28.2 | 29 | |
| $25,000 - 49,999 | 28.2 | 29 | |
| $50,000 - $74,999 | 12.6 | 13 | |
| $75,000 - $124,999 | 6.8 | 7 | |
| More than $125,000 | 3.9 | 4 | |
| Educatione | |||
| Less than high school | 17.8 | 19 | |
| High school diploma/GED | 31.8 | 34 | |
| Some college/technical school | 32.7 | 35 | |
| College degree | 15.9 | 17 | |
| Post-graduate degree | 1.9 | 2 | |
| Home Ownershipe | |||
| Own | 61.7 | 66 | |
| Rent | 38.3 | 41 | |
| Length of Residencee | |||
| Less than 2 years | 18.7 | 20 | |
| 2-5 years | 20.6 | 22 | |
| 6-10 years | 26.2 | 28 | |
| 11-15 years | 13.1 | 14 | |
| More than 15 years | 21.5 | 23 | |
| National Flood Insurancee | |||
| Yes | 16.8 | 18 | |
| No | 89 | 83.2 | |
| Household Properties Insurede | |||
| Yes | 50.5 | 54 | |
| No | 49.5 | 53 | |
Effectiveness of Early Warning for Flash Flooding
Our first objective was to understand the effectiveness of early warnings about flash floods in Mayfield before July 18-19, 2023. We used various descriptive techniques and interview excerpts to explore this research question.
Sources of Information for Flash Flooding
As described above, we asked survey respondents to indicate what sources of information they consulted about flash flooding prior to the event. The results represented in Figure 1 illustrate the diverse sources of information about flash floods that Mayfield residents reported accessing. The data reveals that traditional media outlets remain predominant, with the local television news channel being the most frequently cited source (approximately 80% of respondents), followed closely by the Weather Channel (about 60%). Social media platforms and mobile weather apps also played a significant role, each used by roughly 50% of respondents.
Figure 1. Percentage of Residents Using Communication Source for Information About Flash Flooding
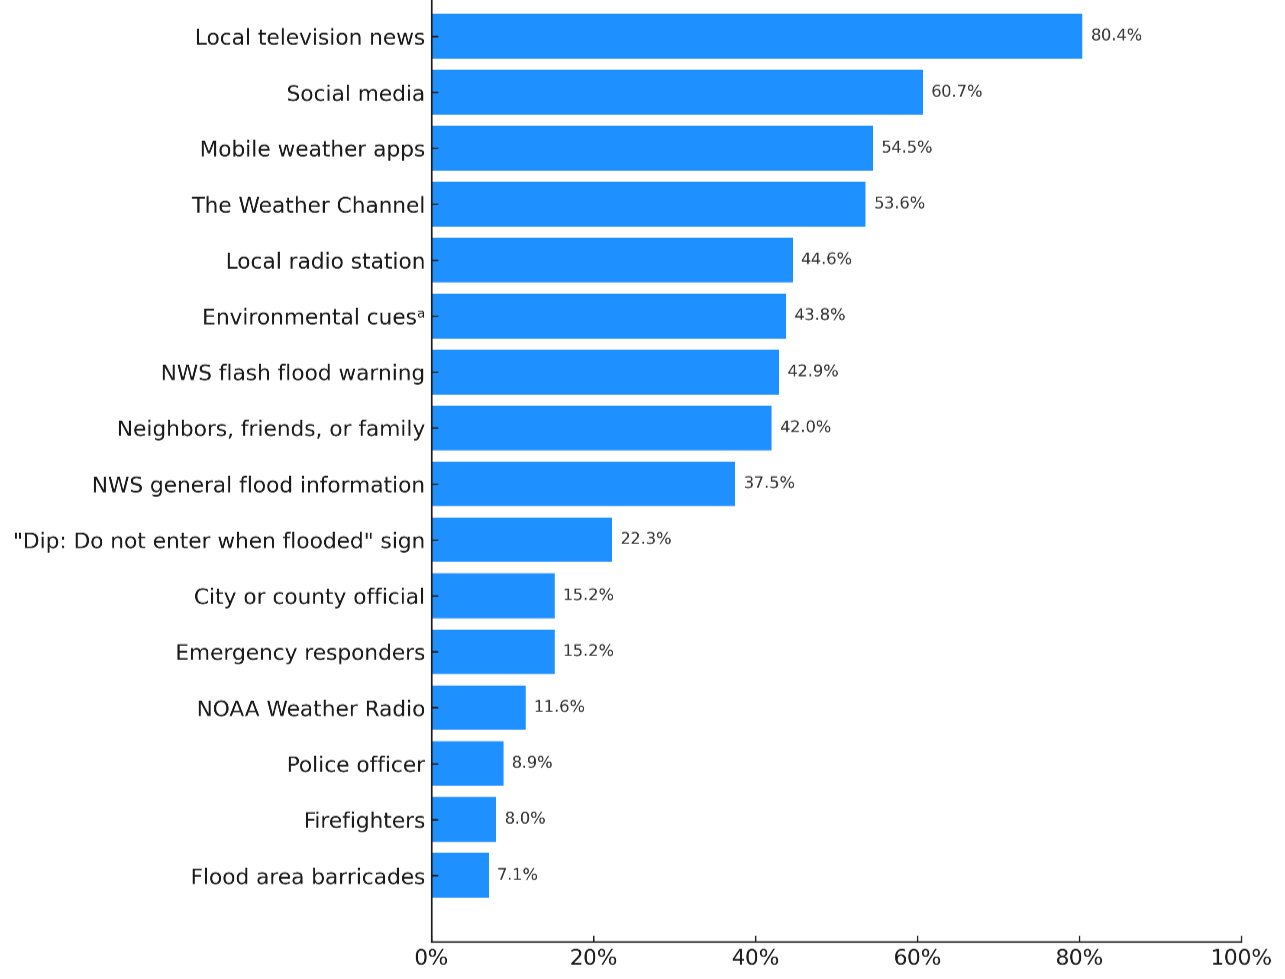
Interestingly, a substantial portion of the population (around 45%) relied on environmental cues such as heavy rainfall and visible water on streets to perceive flood risk, indicating the importance of personal observation in flood awareness. A smaller subset (30-40%) consulted official sources like the NWS or local authorities for flood information. Less than 20% of participants reported using sources such as NOAA Weather Radio, flood area barricades, and emergency responders to indicate flood risk.
Perceived Accuracy and Communication of Flash Flood Warnings
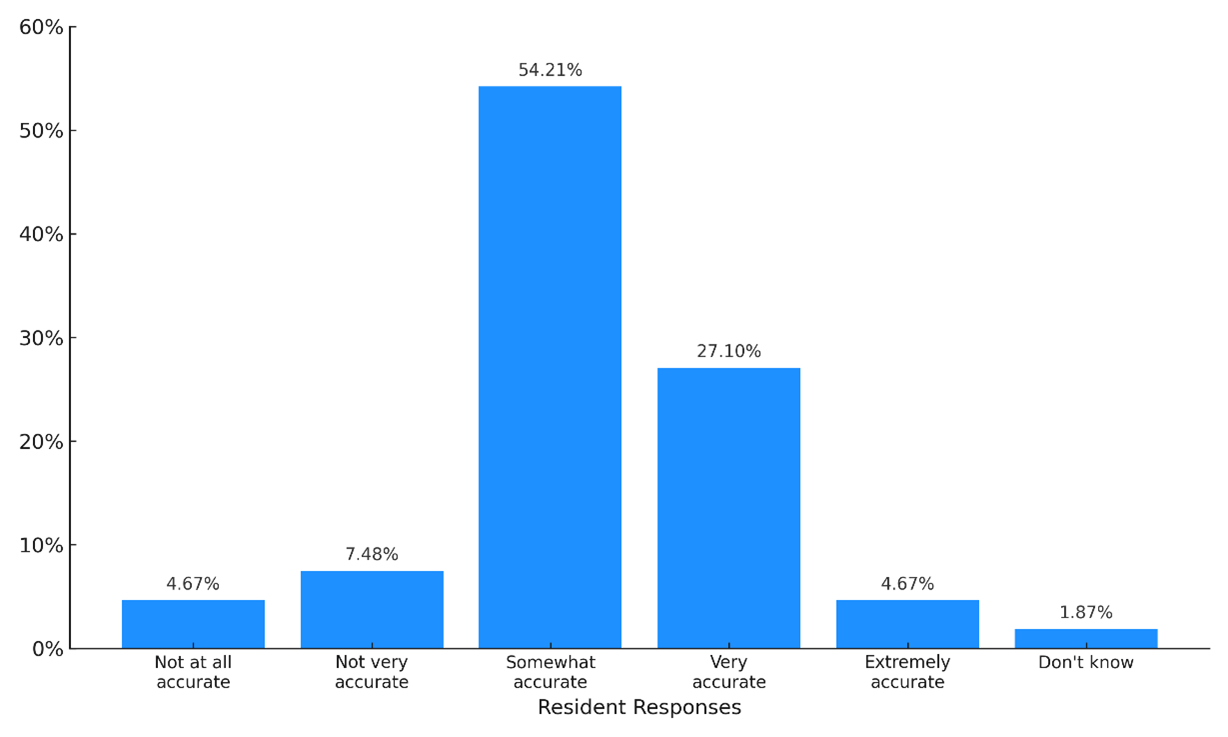
To understand how accurate flash flooding warnings were for Mayfield before the event on July 18-19, 2023, we asked respondents to rate the effectiveness of the early warnings they received. As Figure 2 shows, the survey revealed a nuanced view among respondents. About 54.21% of the respondents characterized the forecasts and warnings as somewhat accurate, indicating a moderate confidence level in current prediction methods. This is followed by 27.10% who considered them very accurate, suggesting that a significant portion of the population trusts the information in the warning messages. Notably, the extreme ends of the spectrum—not at all accurate and extremely accurate—were only about 4.67% of responses, demonstrating that very few individuals hold absolute views on the subject. The data also showed that roughly 7.48% find the forecasts and warnings “not very accurate,” while about 1.87% responded, “Don't know.” These findings underscore a cautiously positive public perception of flash flood forecasting and warning system capabilities, highlighting both the progress made in meteorological predictions and the persistent challenges in achieving widespread public confidence in their accuracy.
Figure 2. Residents’ Perceptions of the Accuracy of Flash Flood Forecasts and Warnings
One resident expressed that communication and warnings about the flash flood risk were ineffective in conveying the situation's seriousness. This resident felt that the warnings overemphasized the need to take precautions while driving and road safety, particularly the “turn around, don't drown” message, but failed to highlight the significant threat of water entering homes and damaging properties. The warnings did not clearly communicate the potential for major property damage or the need for residents to prepare their homes and take protective measures. As a result, the warnings did not reflect the actual severity of the flooding in residential areas. As the resident said:
I don't feel like they communicated at all the high risk we were facing with the water. I don't think they stressed the danger enough. They emphasized that you could drown in your car if you drove through floodwaters, but they didn't mention that people could literally drown in their own yards. They didn't warn us that we could have several feet of water on our properties. At no point did I hear anyone say, “Be careful in your own home. Your property could flood, your animals could be in danger, and there could be significant damage.” In the end, I wondered if they even knew how bad it was going to be. Maybe they weren't as informed as we thought they were.
Prior Knowledge of Flash Flooding and Time Warning Message Was Received
We asked survey respondents two questions to assess their level of awareness of the potential for flash flooding prior to the event: “Did you know about the possibility of a flash flood on July 18-19, 2023?” and “How long before the flash flood on July 18-19, 2023, were you informed about it?” While the first question assessed respondents’ prior awareness of flash flood risk in general, the second question aimed to capture whether they received a specific warning immediately before the event. The results are shown in Table 5.
Table 5. Cross-Tabulation of Knowledge and Early Warning About Flash Flooding Among Mayfield Residents
| Did you have knowledge of the possibility of the July 18-19, 2023, flash flooding? | How long before the flash flood of July 18-19, 2023, were you informed about it? | ||||
|---|---|---|---|---|---|
| 1-3 hours | 4-7 hours | 8-10 hours | 12-48 hours | Total | |
| Yes | 32 | 17 | 11 | 9 | 69 |
| No | 25 | 3 | 1 | 4 | 33 |
| Total | 57 | 20 | 12 | 13 | 102 |
The cross-tabulation of knowledge and early warning about the July 18-19, 2023, flash flood in Mayfield reveals that 69 residents had prior knowledge; among this group, 32 (46%) respondents received the flash flood warning 1-3 hours before the event. A large number (n=28, 41%) received the warning 4-10 hours ahead. Among the 33 respondents who had no prior knowledge of the flash flood risk, 25 (76%) received the warning just 1-3 hours before. Very few people without prior knowledge (n=8, 24%) reported receiving warnings 4 or more hours before the event. This pattern shows that those with prior knowledge were more likely to receive earlier warnings, while those unaware were mostly informed at the last minute. The early warning system was more effective for informed residents, highlighting the need for broader, earlier dissemination of flood risk and warnings.
Risk Perception and Early Warning in Flash Flood Preparedness
Our second research question examined how risk perception and early warning contribute to flash flood preparedness. Table 6 presents multiple regression results of the relationship between risk perception and early warning systems and their influence on protective action.
Table 6. Multiple Regression Analysis of Risk Perception and Information Sources on Protective Action
| Coefficients (β) | Standard errors | T-statistics | P-value | |
|---|---|---|---|---|
| Constant | -13.120 | 13.839 | -0.948 | 0.346 |
| Risk perception | 0.323 | 0.091 | 3.537 | 0.001*** |
| Information source diversity | 0.089 | 0.033 | 2.669 | 0.009*** |
| Age | 0.006 | 0.007 | 0.918 | 0.362 |
| Gender (ref: female) | 0.124 | 0.198 | 0.626 | 0.533 |
| Education | 0.026 | 0.109 | 0.241 | 0.810 |
| Race | -0.018 | 0.105 | -0.167 | 0.866 |
| Household income | 0.054 | 0.084 | 0.637 | 0.526 |
| Previous flood experience | 0.323 | 0.248 | 1.301 | 1.970 |
| Length of stay in residence | 0.231 | 0.086 | 2.680 | 0.009*** |
| Homeownership (ref: rent) | 0.215 | 0.236 | 0.909 | 0.367 |
| Occupation | 0.200 | 0.058 | 3.457 | 0.001*** |
| Ethnicity (ref: Not Hispanic or Latino) | -1.004 | 0.362 | -2.773 | 0.007*** |
| N 112 | ||||
| Adjusted R2 0.322 | ||||
*** p < 0.01
The results show that risk perception had a significant positive effect on protective action (β = 0.323, p = 0.001), indicating that individuals who perceive higher levels of risk are more likely to engage in protective behaviors. Similarly, information source diversity is a significant predictor (β = 0.089, p = 0.009), suggesting that access to information increased the likelihood of taking protective measures. People with more diverse sources of information about flash flooding (e.g., TV news, radio, NWS warnings) were more likely to take protective action. Length of stay in residence also significantly influenced protective action (β = 0.231, p = 0.009), with longer-term residents being more likely to act protectively. Furthermore, occupation (β = 0.058, p = 0.001) highlights that a resident’s occupational status played a role in preparedness. Specifically, residents' occupational status can significantly affect access to resources, knowledge sets, and skills to promote disaster and emergency preparedness for flash floods. Identifying as neither Hispanic nor Latino corresponded with a significant negative relationship with protective action (β = -1.004, p = 0.007), suggesting that individuals from Hispanic or Latino backgrounds were less likely to take protective measures. However, other variables, such as age, gender, education, race, household income, and homeownership were not significant predictors. Previous flood experience approached significance (β = 0.323, p = 0.097), hinting at a potential influence but falling short of statistical significance. The model explains 32.2% of the variance in protective action (adjusted R² = 0.322), demonstrating that while factors like risk perception, access to information, and length of residence are important, other demographic characteristics had limited predictive power in this context. The findings suggest that enhancing risk communication and targeting certain demographic groups, particularly Hispanic or Latino populations, could improve protective actions in flood-prone areas.
Discussion
This study highlights the critical role of early warning systems in flash flood preparedness. Our study identified that traditional media, including local television news and the Weather Channel, were respondents’ most common sources of information, consistent with previous studies (Cook, 201551; Feldman et al., 201652), while social media platforms and mobile weather apps also played significant roles. However, the effectiveness of early warnings was inconsistent across the population, with a substantial portion of respondents receiving information just hours before the flood event. This suggests that while the existing communication strategies are functional, they may not provide adequate lead time for all community members, particularly those less attuned to media outlets or lacking access to diverse information sources.
Respondents’ perception of the accuracy of flash flood warnings further underscores the challenges in risk communication. Although more than half of the respondents rated the warnings as “somewhat accurate,” there remains considerable room for improvement. The limited number of individuals who considered the warnings “"extremely accurate” or “not at all accurate” indicates a general trust in the system but also highlights the variability in how people interpret or receive these warnings. The qualitative interviews revealed that, in some cases, warnings failed to adequately convey the severity of the situation, focusing more on road safety than the potential for property damage or personal harm. This discrepancy suggests the need for a more comprehensive communication strategy that addresses the full scope of flood risks and personalizes the risks for people and property impacts. Our analysis is consistent with previous studies such as Mores (2016) and Zinda et al. (2021), which reveal critical insights into the factors influencing protective action during flash floods. Risk perception and access to information were significant predictors, meaning that individuals who recognized the threat or had access to diverse sources of information were more likely to take proactive measures. Other factors, such as length of residence and occupation, also contributed to preparedness, with longer-term residents being more likely to act protectively. Notably, ethnicity was a significant factor, as individuals from Hispanic or Latino backgrounds were less likely to engage in protective actions. The Hispanic or Latino population, some of whom do not speak English, may prefer risk information and early warning communication in Spanish, which is not widely available in some jurisdictions. This finding underscores the importance of providing multilingual risk and warning information, tailoring risk communication strategies to reach and resonate with diverse demographic groups, particularly those who may be less likely to receive or act on early warnings.
Conclusions
This study demonstrates that while early warning systems for flash flooding are generally effective in informing the public, significant gaps remain regarding timely dissemination and the clarity of risk communication. Traditional media remains the dominant source of information, but reliance on social media and environmental cues suggests a growing diversification of information channels. The findings highlight that individuals with higher risk perceptions and access to varied information sources are more likely to take protective actions. However, disparities persist among certain demographic groups, emphasizing the need for more inclusive and targeted communication strategies that better convey the severity of flooding risks and reach vulnerable populations early enough to enhance overall community preparedness.
Implications for Practice or Policy
The findings of this study have important implications for both practice and policy in the area of flood risk communication and preparedness. To enhance community-wide preparedness, policymakers should prioritize the development of more inclusive early warning systems that reach diverse populations, particularly underserved groups like Hispanic or Latino communities, who were found to engage less in protective actions. This can be achieved by using a wider range of communication platforms, including social media and mobile apps, alongside traditional media and ensuring that warnings are delivered in multiple languages. Moreover, warnings should provide clearer and more comprehensive information on the full scope of risks, focusing less on road safety and emphasizing potential property damage and personal harm. Additionally, policies should focus on increasing public awareness and providing education on proactive flood protection measures, particularly for long-term residents who have demonstrated higher levels of preparedness. Such measures would help strengthen resilience and reduce the impact of flash floods across vulnerable communities.
Limitations and Future Research Directions
The primary limitation of this study is the small number of Hispanic or Latino survey respondents, which accounted for only 16 of our 112 survey participants. According to the U.S. Census Bureau (n.d.), 15% of the population in Mayfield identifies as Hispanic. Of the 105 survey participants who answered the question, 15.2% said they were Hispanic; this roughly the same as the overall population. But the small number of Hispanic respondents (n=16) mean we cannot study subgroups within the Hispanic population, such as those varying in age, socioeconomic status, or geographic region. Further work should explore alternative ways to engage the Hispanic population to ensure diverse representation that can provide inclusive solutions.
Acknowledgments. We want to thank Dr. Traci Byrd and Ms. Darlena Jones for facilitating our connection with responders. Additionally, we sincerely appreciate Ms. Amy Chicoine, Director of the Mayfield Long-Term Recovery Group, and her navigators for their invaluable assistance in distributing the survey to the affected individuals.
References
-
Morss, R. E., Mulder, K. J., Lazo, J. K., & Demuth, J. L. (2016). How do people perceive, understand, and anticipate responding to flash flood risks and warnings? Results from a public survey in Boulder, Colorado, USA. Journal of Hydrology, 541, 649-664. ↩
-
Khajehei, S., Ahmadalipour, A., Shao, W., & Moradkhani, H. (2020). A place-based assessment of flash flood hazard and vulnerability in the contiguous United States. Scientific Reports, 10(1), Article 448. https://doi.org/10.1038/s41598-019-57349-z ↩
-
Smith, A. B. (2024, January 8). 2023: A historic year of US billion-dollar weather and climate disasters. Climate.gov, National Oceanic and Atmospheric Administration. https://www.climate.gov/news-features/blogs/beyond-data/2023-historic-year-us-billion-dollar-weather-and-climate-disasters ↩
-
National Weather Service. (n.d.-a). Flood related hazards: Frequently asked questions: Flash flooding. United States Department of Commerce, National Oceanic and Atmospheric Administration. Retrieved March 1, 2024, from https://www.weather.gov/safety/flood-hazards ↩
-
Alipour, A., Ahmadalipour, A., & Moradkhani, H. (2020). Assessing flash flood hazard and damages in the southeast United States. Journal of Flood Risk Management, 13(2), Article e12605. https://doi.org/10.1111/jfr3.12605 ↩
-
Allen, D. C., Datry, T., Boersma, K. S., Bogan, M. T., Boulton, A. J., Bruno, D., & Zimmer, M. (2020). River ecosystem conceptual models and non‐perennial rivers: A critical review. Wiley Interdisciplinary Reviews: Water, 7(5), Article e1473. https://doi.org/10.1002/wat2.1473 ↩
-
Stablein, M. J., Cruz, J. G., Fidan, E. N., Talbot, J., Reed, S. P., Walters, R. S., Ogunyiola A, & Rodríguez, L. F. (2022). Compound[ing] disasters in Puerto Rico: Pathways for virtual transdisciplinary collaboration to enhance community resilience. Global Environmental Change, 76, Article 102558. https://doi.org/10.1016/j.gloenvcha.2022.102558 ↩
-
Becker, J. S., Taylor, H. L., Doody, B. J., Wright, K. C., Gruntfest, E., & Webber, D. (2015). A review of people's behavior in and around floodwater. Weather, Climate, and Society, 7(4), 321-332. ↩
-
Drobot, S., & Parker, D. J. (2007). Advances and challenges in flash flood warnings. Environmental Hazards, 7(3), 173-178. https://doi.org/10.1016/j.envhaz.2007.09.001 ↩
-
Bodoque, J. M., Díez-Herrero, A., Amérigo, M., García, J. A., & Olcina, J. (2019). Enhancing flash flood risk perception and awareness of mitigation actions through risk communication: A pre-post survey design. Journal of Hydrology, 568, 769-779. https://doi.org/10.1016/j.jhydrol.2018.11.007 ↩
-
Kellens, W., Terpstra, T., & De Maeyer, P. (2013). Perception and communication of flood risks: A systematic review of empirical research. Risk Analysis, 33(1), 24-49. https://doi.org/10.1111/j.1539-6924.2012.01844.x ↩
-
Perera, D., Agnihotri, J., Seidou, O., & Djalante, R. (2020). Identifying societal challenges in flood early warning systems. International Journal of Disaster Risk Reduction, 51, Article 101794. https://doi.org/10.1016/j.ijdrr.2020.101794 ↩
-
Cools, J., Innocenti, D., & O’Brien, S. (2016). Lessons from flood early warning systems. Environmental Science & Policy, 58, 117-122. https://doi.org/10.1016/j.envsci.2016.01.006 ↩
-
De Elia, R., Ruiz, J. J., Francce, V., Lohigorry, P., Saucedo, M., Menalled, M., & D'Amen, D. (2024). Early warning systems and end‐user decision‐making: A risk formalism tool to aid communication and understanding. Risk Analysis, 44(5), 1128-1142. https://doi.org/10.1111/risa.14221 ↩
-
Merz, B., Kuhlicke, C., Kunz, M., Pittore, M., Babeyko, A., Bresch, D. N., Domeisen, D. I. V., Feser, F., Koszalka, I., Kreibich, H., Pantillon, F., Parolai, S., Pinto, J. G., Punge, J. G., Rivalta, E., Schröter, K., Strehlow, K., Weisse, R., & Wurpts, A. (2020). Impact forecasting to support emergency management of natural hazards. Reviews of Geophysics, 58(4), Article e2020RG000704. https://doi.org/10.1029/2020RG000704 ↩
-
Keller, C., Siegrist, M., & Gutscher, H. (2006). The role of the affect and availability heuristics in risk communication. Risk Analysis, 26(3), 631-639. https://doi.org/10.1111/j.1539-6924.2006.00773.x ↩
-
Kuller, M., Schoenholzer, K., & Lienert, J. (2021). Creating effective flood warnings: A framework from a critical review. Journal of Hydrology, 602, Article 126708. https://doi.org/10.1016/j.jhydrol.2021.126708 ↩
-
Potter, S. H., Kreft, P. V., Milojev, P., Noble, C., Montz, B., Dhellemmes, A., Woods R.J., & Gauden-Ing, S. (2018). The influence of impact-based severe weather warnings on risk perceptions and intended protective actions. International Journal of Disaster Risk Reduction, 30, 34-43. ↩
-
Wachinger, G., Renn, O., Begg, C., & Kuhlicke, C. (2013). The risk perception paradox—implications for governance and communication of natural hazards. Risk Analysis, 33(6), 1049-1065. ↩
-
Lindell, M. (2013). North American cities at risk: Household responses to environmental hazards. In Cities at risk: Living with perils in the 21st century (pp. 109-130). Dordrecht: Springer Netherlands. https://doi.org/10.1007/978-94-007-6184-1_7 ↩
-
Lindell, M. K., & Prater, C. S. (2000). Household adoption of seismic hazard adjustments: A comparison of residents in two states. International Journal of Mass Emergencies & Disasters, 18(2), 317-338. https://doi.org/10.1177/028072700001800203 ↩
-
Solberg, C., Rossetto, T., & Joffe, H. (2010). The social psychology of seismic hazard adjustment: Re-evaluating the international literature. Natural Hazards and Earth System Science, 10(8), 1663–1677. https://doi.org/10.5194/nhess-10-1663-2010 ↩
-
MacPherson‐Krutsky, C., Lindell, M. K., & D. Brand, B. (2023). Residents’ information seeking behavior and protective action for earthquake hazards in the Portland Oregon Metropolitan Area. Risk Analysis, 43(2), 372-390. ↩
-
Peers, J. B., Lindell, M. K. K., Gregg, C. E., Reeves, A. K. K., Joyner, A. T. T., & Johnston, D. M. (2021). Multi-hazard perceptions at Long Valley Caldera, California, USA. International Journal of Disaster Risk Reduction, 52, Article 101955. https://doi.org/10.1016/j.ijdrr.2020.101955 ↩
-
Weinstein, N. D., & Nicolich, M. (1993). Correct and incorrect interpretations of correlations between risk perceptions and risk behaviors. Health Psychology, 12(3), 235–245. https://doi.org/10.1037/0278-6133.12.3.235 ↩
-
Rana, I. A., Jamshed, A., Younas, Z. I., & Bhatti, S. S. (2020). Characterizing flood risk perception in urban communities of Pakistan. International Journal of Disaster Risk Reduction, 46, Article 101624. https://doi.org/10.1016/j.ijdrr.2020.101624 ↩
-
Birkholz, S., Muro, M., Jeffrey, P., & Smith, H. (2014). Rethinking the relationship between flood risk perception and flood management. Science of The Total Environment, 478, 12-20. https://doi.org/10.1016/j.scitotenv.2014.01.06 ↩
-
Bubeck, P., Botzen, W. J. W., & Aerts, J. C. (2012). A review of risk perceptions and other factors that influence flood mitigation behavior. Risk Analysis: An International Journal, 32(9), 1481-1495. https://doi.org/10.1111/j.1539-6924.2011.01783.x ↩
-
Harlan, S. L., Sarango, M. J., Mack, E. A., & Stephens, T. A. (2019). A survey-based assessment of perceived flood risk in urban areas of the United States. Anthropocene, 28, Article 100217. https://doi.org/10.1016/j.ancene.2019.100217 ↩
-
Lazrus, H., Morss, R. E., Demuth, J. L., Lazo, J. K., & Bostrom, A. (2016). "Know what to do if you encounter a flash flood": Mental models analysis for improving flash flood risk communication and public decision making. Risk Analysis, 36(2), 411-427. ↩
-
Lindell, M. K., & Perry, R. W. (2012). The protective action decision model: Theoretical modifications and additional evidence. Risk Analysis, 32(4), 616-632. ↩
-
Terpstra, T., & Lindell, M. K. (2013). Citizens' perceptions of flood hazard adjustments: An application of the protective action decision model. Environment and Behavior, 45(8), 993-1018. ↩
-
Lazo, J. K., Bostrom, A., Morss, R. E., Demuth, J. L., & Lazrus, H. (2015). Factors affecting hurricane evacuation intentions. Risk Analysis, 35(10), 1837-1857. ↩
-
Huang, S. K., Lindell, M. K., & Prater, C. S. (2016). Who leaves and who stays? A review and statistical meta-analysis of hurricane evacuation studies. Environment and Behavior, 48(8), 991-1029. https://doi.org/10.1177/0013916515578485 ↩
-
Morss, R. E., Demuth, J. L., Bostrom, A., Lazo, J. K., & Lazrus, H. (2015). Flash flood risks and warning decisions: A mental models study of forecasters, public officials, and media broadcasters in Boulder, Colorado. Risk Analysis, 35(11), 2009-2028. https://doi.org/10.1111/risa.12403 ↩
-
Zinda, J. A., Williams, L. B., Kay, D. L., & Alexander, S. M. (2021). Flood risk perception and responses among urban residents in the northeastern United States. International Journal of Disaster Risk Reduction, 64, 102528. https://doi.org/10.1016/j.ijdrr.2021.102528 ↩
-
Thurmond, V. A. (2001). The point of triangulation. Journal of Nursing Scholarship, 33(3), 253-258. ↩
-
Creswell, J. W., & Poth, C. N. (2016). Qualitative inquiry and research design: Choosing among five approaches. Sage. ↩
-
National Weather Service. (n.d.-b). Summary of historic flash flooding on July 19, 2023. Retrieved September 1, 2024, from https://www.weather.gov/pah/FloodingJuly19_2023 ↩
-
U.S. Census Bureau (n.d.). QuickFacts: Mayfield City, Kentucky. U.S. Department of Commerce. Retrieved September 1, 2024, from https://www.census.gov/quickfacts/fact/table/mayfieldcitykentucky/PST045223 ↩
-
Creswell, J. W. (2009). Research designs: Qualitative, quantitative, and mixed methods approaches. Sage. ↩
-
Yanow, D. (2000). Seeing organizational learning: A "cultural" view.Organization, 7(2), 247-268. https://doi.org/10.1177/135050840072003 ↩
-
Braun, V., & V. Clarke. (2006). Using thematic analysis in psychology. Qualitative Research in Psychology, 3(2), 77–101. https://doi.org/10.1191/1478088706qp063oa ↩
-
Braun, V., & V. Clarke. (2020). One size fits all? What counts as quality practice in (reflexive) thematic analysis? Qualitative Research in Psychology, 18(3), 328-352. https://doi.org/10.1080/14780887.2020.1769238 ↩
-
Palinkas, L. A., Horwitz, S. M., Green, C. A., Wisdom, J. P., Duan, N., & Hoagwood, K. (2015). Purposeful sampling for qualitative data collection and analysis in mixed method implementation research. Administration and Policy in Mental Health and Mental Health Services Research, 42, 533-544. ↩
-
Patton, M. Q. (2002). Qualitative research and evaluation methods(3rd ed.). Sage. ↩
-
First, J. M., Ellis, K., & Strader, S. (2022a). Double trouble: Examining public protective decision-making during concurrent tornado and flash flood threats in the US Southeast. International Journal of Disaster Risk Reduction, 81, Article 103297. https://doi.org/10.1016/j.ijdrr.2022.103297 ↩
-
First, J.M., Ellis, K., & Strader, S. (2022b). Examining Public Response and Climate Conditions During Overlapping Tornado and Flash Flood Warnings. Natural Hazards Center Weather Ready Research Report Series, Report 1. Natural Hazards Center, University of Colorado Boulder. https://hazards.colorado.edu/weather-ready-research/examining-public-response-and-climate-conditions-during-overlapping-tornado-and-flashflood-warnings ↩
-
Yong, A. G., & Pearce, S. (2013). A beginner's guide to factor analysis: Focusing on exploratory factor analysis. Tutorials in Quantitative Methods for Psychology, 9(2), 79-94. ↩
-
Mallakpour, I., & Villarini, G. (2016). Investigating the relationship between the frequency of flooding over the central United States and large-scale climate. Advances in Water Resources, 92, 159-171. ↩
-
Cook, B. (2015). Flood of images: Media, memory, and Hurricane Katrina. University of Texas Press. https://doi.org/10.7560/771345 ↩
-
Feldman, D., Contreras, S., Karlin, B., Basolo, V., Matthew, R., Sanders, B., Houston, D., Cheung, W., Goodrich, K., Reyes, A., Serrano, K., Schubert, J., & Luke, A. (2016). Communicating flood risk: Looking back and forward at traditional and social media outlets. International Journal of Disaster Risk Reduction, 15, 43-51. https://doi.org/10.1016/j.ijdrr.2015.12.004 ↩
Ogunyiola, A., & Dada, O. (2025). Strengthening Disaster Preparedness: Assessing Risk Perception and Early Warning for Flash Flooding. (Natural Hazards Center Weather Ready Research Report Series, Report 16). Natural Hazards Center, University of Colorado Boulder. https://hazards.colorado.edu/weather-ready-research/strengthening-disaster-preparedness