The Social Vulnerability of Farmworker Communities in North Central Florida
Challenges and Opportunities for Mapping Vulnerable Populations
Publication Date: 2024
Abstract
An essential aspect of disaster preparedness and response includes identifying vulnerable populations and tailoring services and resources to their specific needs. Farmworkers in North Central Florida work in a diverse set of agricultural and forestry operations, including seasonal crop harvests, livestock farming, and plant nurseries. They also frequently live together in tight-knit communities located in hazard-prone areas. Farmworkers are highly vulnerable to disasters, however, there are few public health tools or data available that can identify where these populations are living and what their needs are in a disaster context. This project—conducted in close collaboration with farmworker-serving community-based organizations—was designed to address this gap. It had two primary objectives: (1) To develop a contextualized set of social vulnerability indicators tailored to farmworker communities in North Central Florida and (2) To explore approaches to mapping agricultural areas where farmworkers work and live. We formed two Community Advisory Boards (CABs) with 15 representatives from farmworker- and migrant-serving organizations, county health departments, agricultural extension offices, and other nonprofit organizations to provide oversight of research design, data collection, and analysis. The transcripts of the 10 CAB meetings became a rich data source alongside four semi-structured key informant interviews that we conducted with six staff members at organizations serving farmworkers. The interviews and meetings allowed us to develop the social vulnerability indicators, while at the same time our geospatial mapping analysis of the places where farmworkers work and live allowed us to examine the empirical and ethical challenges of mapping populations that are often targeted by public authorities. Through illustrative examples, this report highlights specific action steps for developing indicators and maps of farmworkers’ social vulnerability that are grounded in relevant local contexts. Findings from this study underline the need for public health research to more systematically integrate community-level indicators into social vulnerability assessments as well as the need for a greater role for farmworker- and migrant-serving organizations, programs, and churches in disaster planning.
Introduction
On August 30, 2023, Hurricane Idalia made landfall on Florida’s Gulf Coast as a Category 3 storm. As it traveled through the rural northeastern part of the state known as the Big Bend and into Georgia, the storm’s wind speeds reached above 57 miles per hour, a pounding that devastated the region’s agricultural operations (Court et al., 20231). North Central Florida has a relatively low historical experience with hurricanes compared to other parts of the state (Emrich & Cutter, 20112), which left many residents and institutions unprepared for the storm and struggling to recover in its aftermath. Agricultural losses from Idalia are estimated to be between $78.8 million and $447 million (Court et al., 2023; Rusnak, 20233).
Many of the hired laborers working on agricultural operations were surprised by the storm, having not received evacuation orders or advisories in their native languages. Others who were aware of the oncoming danger were hesitant to leave their mobile homes to seek shelter for fear of contact with immigration enforcement or English-only assistance. In some cases, they were required to report to work rather than prepare for the coming hurricane. After the storm, many farmworkers lost jobs or had their hours reduced. Their families also faced barriers to receiving assistance due to language access issues, undocumented immigration status, or both.
Networks of community organizations stepped in to help fill the gaps in assistance left by public agencies. Still, the available resources were not sufficient to meet the demand. As with other disasters including California wildfires (Méndez et al., 20204) and the COVID-19 pandemic (Handal et al., 20205; Ramos et al., 20206), Hurricane Idalia both exposed and exacerbated the farmworkers’ vulnerabilities, especially among those who had limited English proficiency, came from Indigenous communities, or had undocumented legal status.
This is a quintessential example of social vulnerability to disasters, but one which existing public datasets are currently unequipped to measure. The Centers for Disease Control and Prevention (CDC) Social Vulnerability Index (SVI) is one such example. It uses indicators organized into four themes: (1) socioeconomic status; (2) household characteristics; (3) racial and ethnic minority status; and (4) housing type and transportation (Centers for Disease Control and Prevention [CDC], 20227). The only employment-based indicator in the socioeconomic status theme is unemployment, though agricultural labor in and of itself creates social vulnerability (Fielding-Miller et al., 20208; Keeney et al., 20229; Navarro-Gambín & Jansen, 202410; Ramos, 201711). Moreover, none of the measures are related to the experience of immigration, a factor known to exacerbate social vulnerability, including among agricultural workers (Méndez et al., 2020; Navarro-Gambín & Jansen, 2024; Willen et al., 201712).
With this project, we aimed to expand the CDC SVI by identifying additional variables that shape farmworker communities’ disaster vulnerability and to determine their relative importance to the experiences of this population in North Central Florida. Much existing research has focused specifically on migrant and seasonal farmworkers who are employed in agriculture on a temporary basis and may establish a separate domicile for that time. However, it quickly became clear to us that understanding the lived experiences of the often tight-knit communities in which migrant and seasonal farmworkers are embedded requires consideration of a more inclusive range of agriculture and forestry employment, such as year-round work in livestock and nursery operations as well as select forestry industries such as pine straw baling.
Our findings demonstrate the complex and context-dependent nature of social vulnerability to natural hazards, illuminating some of the key limitations of standardized data tools intended to measure and map it. In other words, we confirm how widely used tools such as the CDC SVI are not one-size-fits-all, especially when they focus on characteristics of individual households and fail to measure the community- and society-level inequities that make it harder for specific populations to prepare for and recover from hazard events. Efforts to identify areas of high social vulnerability among farmworker communities must therefore incorporate sets of locally specific indicators paired with narratives explaining why they matter. This study has important implications for public health research by underlining the importance of collecting qualitative data in partnership with community organizations who have deep place-based knowledge. It also has implications for disaster preparedness and response efforts in that it highlights the importance of strengthening local and regional service networks both for assessing existing social vulnerabilities and for working toward eliminating the structural root causes of those social vulnerabilities.
Literature Review
Social Vulnerability to Natural Hazards
Hazards and disaster researchers grapple with characterizing the complex and abstract concept of vulnerability, or “the potential for harm” (Emrich & Cutter, 2011, p. 194). Investigations into the causes of adverse outcomes from hazards such as heat waves, fires, or hurricanes have revealed that vulnerability reflects not only the exposure of a person or community to the hazard, but also the factors that influence the likelihood of feeling the effects of that exposure, as well as the capabilities and available resources to cope with those effects (Mac & McCauley, 201713; Romero Lankao & Qin, 201114). One prominent concept framing these factors is social vulnerability (Emrich & Cutter, 2011; Mac & McCauley, 2017; Spielman et al., 202015). As Cutter et al. (2003)16 explain:
Social vulnerability is partially the product of social inequalities—those social factors that influence or shape the susceptibility of various groups to harm and that also govern their ability to respond. However, it also includes place inequalities—those characteristics of communities and the built environment, such as the level of urbanization, growth rates, and economic vitality, that contribute to the social vulnerability of places. (p. 243)
Social vulnerability researchers have thus acknowledged that one’s risk of adverse health outcomes is determined in large part by one’s life circumstances—the social determinants of health (Emrich & Cutter, 2011; Flanagan et al., 202117; Healthy People 2030, n.d.18).
Hazards and disaster researchers applying this lens have highlighted the importance of accounting for these factors across the disaster management cycle, such as in the allocation of resources, emergency communications, and policymaking (Adams et al., 201919). For instance, factors ranging from material resource inequalities to sociocultural modes of communicating knowledge can affect whether and how people are willing and able to evacuate an area in the path of a hurricane (Cutter et al., 2003; Flanagan et al., 201120; Thomas et al., 201921). Post-disaster, socially vulnerable communities require additional and targeted human services to support recovery (Cutter et al., 2003; Flanagan et al., 2011). This perspective is also crucial for informing governance and actions to identify and ameliorate the causal pathways that result in disparate health and safety outcomes, especially in the context of anthropogenic climate change (Ribot, 201422; Thomas et al., 2019).
Measuring Vulnerability
Moving from these critical theoretical insights to measuring and comparing social vulnerabilities across places and populations, however, is not a straightforward task. Recognizing that social vulnerability is a human-constructed phenomenon that cannot be objectively measured (Flanagan et al., 2021; Spielman et al., 2020), researchers grapple with the question of how to produce disaster planning tools that are both reliable and valid. A key challenge is the tension between the desire for standardized, scalable planning tools for large agencies like the Federal Emergency Management Agency (FEMA) and the need for contextualized recommendations and tailored supports for vulnerable groups within specific communities (Méndez et al., 2020; Romero Lankao & Qin, 2011; Spielman et al., 2020).
Social vulnerability indexing, or using multiple indicators to generate—and often map—overall quantitative vulnerability scores, is an approach whose popularity has increased exponentially since the early 2000s (Painter et al., 202423). Research using this approach has illuminated several important limitations, even beyond the inherent limitation of data quality and availability (e.g., Emrich & Cutter, 2011). In particular, the connections between theorized social vulnerability drivers and the selected indicators have been unclear in many research applications of this approach thus far (Painter et al., 2024; Spielman et al., 2020). Labeling racial or ethnic minority populations as vulnerable without explicitly discussing racism, xenophobia, or ethnocentrism, for example, gives the false impression that social vulnerability is an inherent characteristic of minoritized groups rather than a circumstance arising from past and present structural violences (Méndez et al., 2020; Painter et al., 2024; Quesada et al., 201124).
Relatedly, many of the indicators commonly used in SVIs have been more descriptive (e.g., demographics) than explanatory. This pattern has prompted questions about the practical utility of these tools, especially when multiple indicators are combined into a single summative score (Reckien, 201825; Spielman et al., 2020; Wood et al., 202126). For example, Wood et al. (2021) pointed out that such aggregation of variables can obscure the importance of poverty—a key determinant—as well as obfuscate the complex intersections between individual factors. And Reckien (2018) has pointed out that regions with similar overall vulnerability scores may have very different vulnerability drivers and thus require distinct supports and services despite appearing alike on a map.
These and other critiques have led some researchers to adapt SVIs with contextualized sets of indicators derived from local knowledge and experiences. Paulino et al. (2021)27, for example, adjusted the CDC SVI for Guam by adapting the racial/ethnic minority category to the local context as well as adding a set of Guam-specific themes and variables. Similarly, in their study of COVID-19 across zip codes in New Mexico, Yellow Horse et al. (2020)28 compared CDC SVI variables to a set of historically embedded indicators that the researchers had drawn from their own Indigenous knowledge and localized experiences. They found that the historically embedded variables—which included tribal land status and the presence of abandoned uranium mines, among others—explained more of the variance in confirmed COVID-19 cases than the existing CDC themes. These studies demonstrate the importance of selecting indicators based on specific place-based contexts as well as the local experiences of specific populations (Méndez et al., 2020; Painter et al., 2024; Park & Xu, 202229; Paulino et al., 2021; Spielman et al., 2020; Yellow Horse et al., 2020).
Farmworker Vulnerability
As a group, farmworkers have long faced numerous circumstances known to increase the likelihood of adverse physical, mental, and emotional health outcomes (Fan & Pena, 202130; Gares & Montz, 201431; Pagán-Santana et al., 202332; Quesada et al., 2011; Ramos, 2017). Multiple studies have demonstrated that farmworkers typically have low socioeconomic status characterized by high job insecurity, low levels of education, and major gaps in health insurance coverage (Fan & Pena, 2021; Gold et al., 202233; Pagán-Santana et al., 2023; Ramos, 2017). Housing research has shown that farmworkers and their families often live in crowded, substandard homes; they also have high rates of living in mobile homes (Accorsi et al., 202034; Gold et al., 2022; Handal et al., 2020; Pagán-Santana et al., 2023). Studies have shown that farmworkers’ working conditions expose them to extreme heat, poor air quality, insects, pesticides, and abrasions, often simultaneously (Austin et al., 202135; Cheney et al., 202236; Pagán-Santana et al., 2023).
Legal and political contexts create additional challenges. Federal worker regulations, including the Fair Labor Standards Act, exclude agricultural workers from labor protections (Pagán-Santana et al., 2023; Ramos, 2017). In addition, many agricultural workers in the United States have immigrated, largely from Mexico, and have limited English proficiency (Gold et al., 2022; Ramos, 2017). This kind of migration—the process and its outcomes—is a key determinant of vulnerability to adverse health worldwide (Navarro-Gambín & Jansen, 2024; Willen et al., 2017). Studies and commentaries emerging from the COVID-19 pandemic illuminated this by documenting examples of anti-immigrant and racial discrimination (Handal et al., 2020; Martinez et al., 202137).
A first step in measuring and mapping the social vulnerability of farmworkers as a group was conducted by Gares and Montz (2014) in North Carolina and Texas. These researchers created a map of farmworker population estimates overlaid with a county-level multi-hazard index. Their approach identified counties that were highly exposed to hurricanes, tornados, and/or extreme heat and where a high number of vulnerable migrant and seasonal farmworkers lived. While a useful start for identifying areas that need additional resources to protect farmworker populations from hazards, this approach had two key limitations. First, it omitted undocumented workers and made a tenuous assumption that the ratio of documented to undocumented workers was consistent across space and place (p. 45). Second, it omitted important within-group factors that have impacts on individual lives and experiences and whose recognition could inform more specific and targeted interventions.
While it is true that farmworkers overall can be considered a socially vulnerable population, the level and nature of that vulnerability varies within this large group according to intersectional factors, social hierarchies, and diverse backgrounds. For instance, there is a growing recognition within the farmworker health and safety literature of the heightened inequities faced by farmworkers from Indigenous communities in Mexico and Central America such as Mixtec, Zapotec, and Triqui ethnic groups (Binational Center for Indigenous Oaxacan Community Development et al., 202138; Holmes, 201139; Martinez et al., 2021). For instance, Martinez et al. (2021) found that Indigenous workers in Oregon whose native languages were not Spanish faced extra barriers to receiving health information and were more likely than other farmworkers to lose work and wages during the COVID-19 pandemic. In addition, the heightened barriers faced by undocumented immigrants are key determinants of disaster vulnerability. For instance, Méndez et al. (2020) highlighted that people with undocumented legal status were excluded from receiving assistance following the Thomas Fire in California. Therefore, it is important to acknowledge not only the locations where the farmworker population is living and working but also the varied supports and structural changes that within-group heterogeneity necessitates to ensure the safety and well-being of all its members.
Research Questions
As described above, previous research established that (a) upstream structural, economic, and political factors predispose certain groups to adverse outcomes from extreme weather events; (b) attempts to quantify and visualize the complexity of disaster vulnerability present both challenges and opportunities; and (c) the complexity and heterogeneity of backgrounds and experiences within the socially vulnerable population of farmworkers highlight some of those challenges and opportunities. In this pilot feasibility study, we aimed to assess whether a potentially scalable set of farmworker-specific indicators could be assembled to map spatial variations in social vulnerabilities and produce data tools valid enough to inform the allocation of resources and services at the regional, county, or municipal levels. We therefore explored three research questions:
- What factors shape the vulnerability of farmworker households to major storms?
- Can this vulnerability be mapped using existing data resources?
- How can agencies and organizations account for this vulnerability in disaster preparedness and response planning?
Research Design
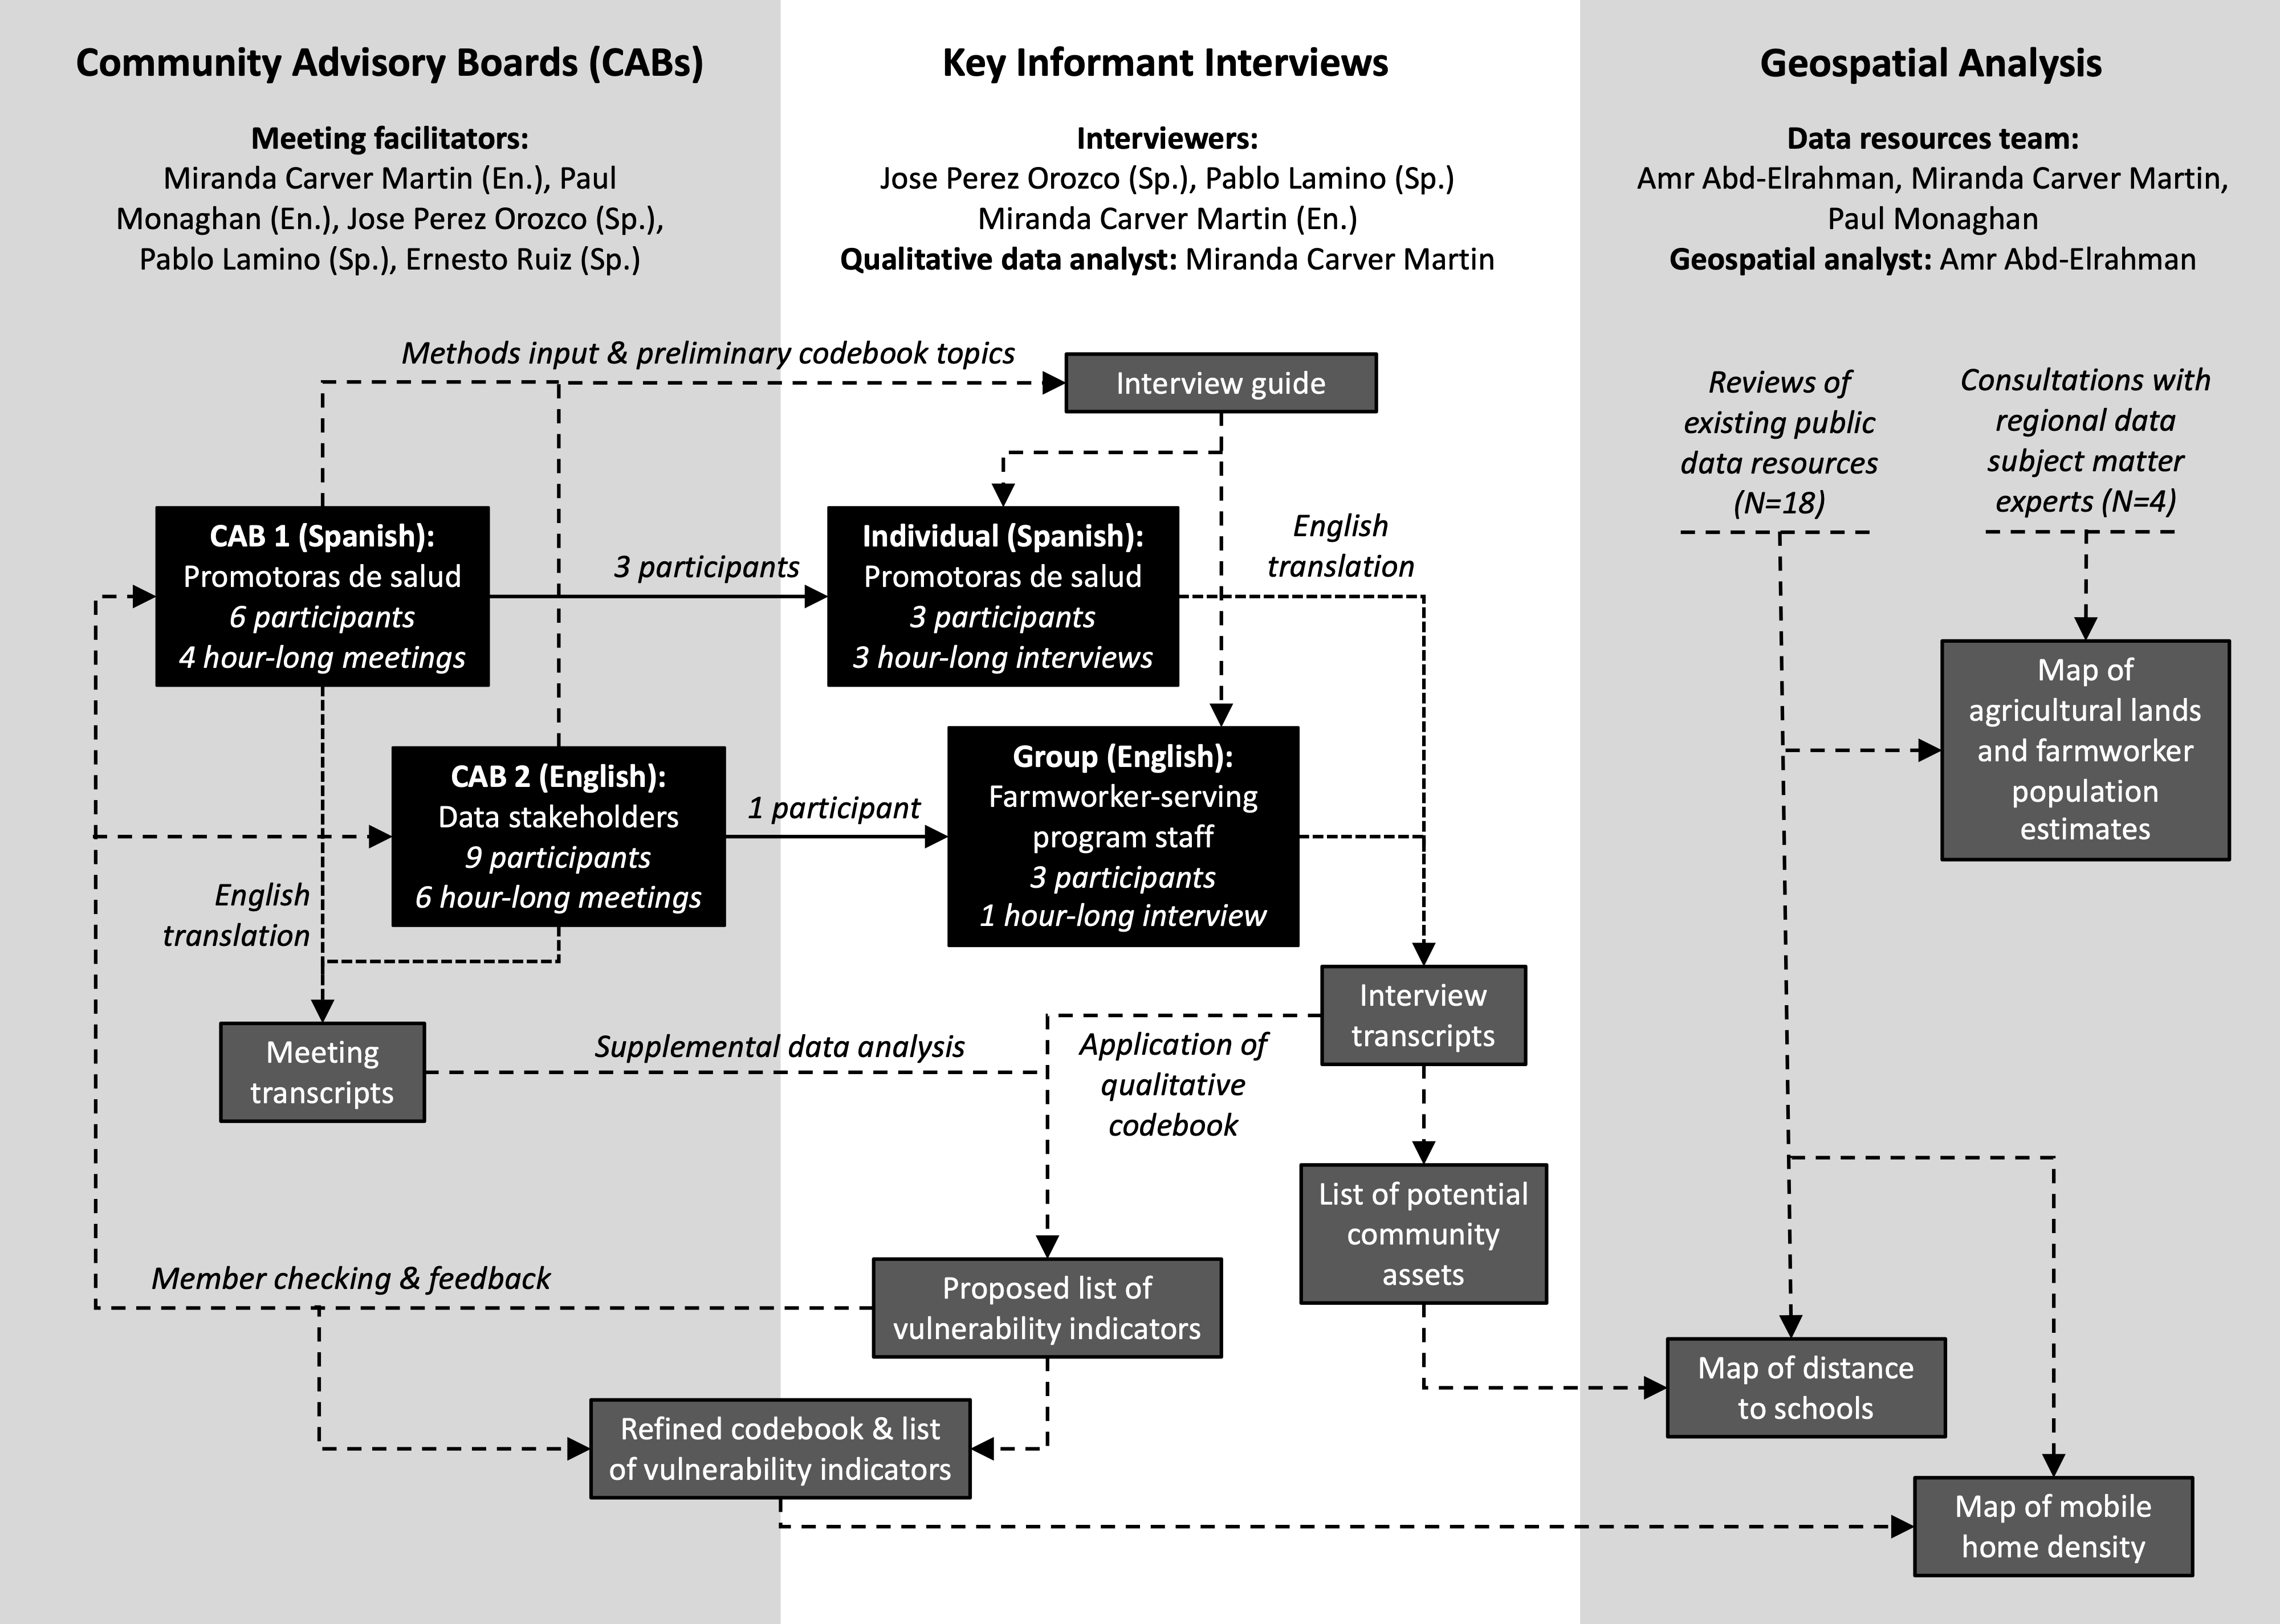
This project represented a collaboration of farmworker advocates, social and geospatial scientists, and local and regional agency staff. We used qualitative methods to better understand the range of social vulnerability drivers relevant to farmworker communities in the North Central Florida area, and we used geospatial analysis to explore possibilities for pinpointing specific places needing additional informational and material resource access services. Two community advisory boards provided iterative feedback on research design and analysis, with early conversations forming the basis for a key informant interview guide and thematic qualitative codebook. In-depth interviews with farmworker-serving staff focused on comparing case examples of client households’ hurricane experiences to illuminate the factors that have made it easier and harder to prepare for and recover from hurricanes in this area. Concurrently, we assessed existing data resources to identify geospatial datasets that could be used to visualize the spatial distribution of the factors uncovered by the qualitative techniques. Figure 1 provides a visualization of the groups, methods, and research products used in this project.
Figure 1. Research Design Diagram
Study Site and Access
We chose to focus on North Central Florida for three main reasons. First, this region is a predominantly agricultural area where relatively few studies of farmworker health and safety have been conducted compared to more southern regions of the state where agricultural operations are more highly concentrated. Second, the agricultural industry in the region was recently devastated by Hurricane Idalia, with 3.3 million acres of agricultural land affected by the storm (Court et al., 2023). Third, our primary community partner, the Rural Women’s Health Project (RWHP), has strong existing relationships within North Central Florida and has long advocated for the well-being of farmworkers and other members of the immigrant community in the area.
The RWHP is North Florida’s only health justice organization and has been serving community members using Spanish and Mesoamerican Indigenous languages. Through numerous health justice projects, they have connected community members to health, legal, and social services, including through collaborations with other organizations to distribute post-disaster relief funds to households affected by Hurricane Idalia. This project has also benefitted from the participation of staff at the Farmworker Association of Florida (FWAF) whose work, however, tends to focus on the central and southern part of the state. This slightly different regional perspective has provided a useful point of comparison to identify variations in farmworker living and working conditions in different parts of Florida as well as common threads.
One common thread shaping the immigrant experience across Florida includes the recent string of statewide legislative measures that were expected to detrimentally affect farmworker well-being. These measures include SB 1718 which requires employers to use E-Verify, exacerbating undocumented workers’ employment insecurity (Immigration, 202340). Another new law, HB 433, seeks to prohibit local governments from enacting their own heat stress protection regulations for outdoor workers in their jurisdictions (Employment Regulations, 202441).
This sociopolitical climate and its unfolding impacts on farmworker and immigrant communities is a key example of the upstream determinants of social vulnerability to disasters. Given the urgency of addressing this issue, our ongoing communications efforts will focus on generating specific tools for North Central Florida advocates and municipal agencies to use in their efforts to support communities affected by this heightened vulnerability. Upon the writing of this report, we are in the process of building a strategic dissemination plan targeting key regional decision-makers in collaboration with RWHP, FWAF, and groups of local stakeholders.
Community Advisory Boards
Members of RWHP made key decisions in the methodological planning process, with input from FWAF, across a series of informal check-ins with the research team as well as within two Community Advisory Boards (CABs) across a total of ten formal meetings facilitated by the research team between December 2023 and May 2024. The ten formal CAB meetings were recorded and then transcribed and translated into English as needed using AI-assisted software.
The transcripts for these meetings provided qualitative data to supplement the analysis of key informant interviews, described below. One CAB was held in Spanish and was comprised of six community-based health workers who live alongside and build relationships with farmworker and immigrant communities. This CAB met four times. The other was held in English and included nine data stakeholders including county health department staff, civil servants, educators, and agricultural extension agents. This CAB met six times. Leaders from RWHP and FWAF were present during meetings of both CABs, and meetings will continue through the implementation of a strategic dissemination plan with local agencies and service providers.
The first CAB, held in Spanish, focused on ethical and methodological decision-making as well as discussions related to our first research question: What factors shape the vulnerability of farmworker households to major storms? The community health workers on this CAB—also known as promotoras de salud—are residents who serve as peer health promoters in connection with a non-governmental organization and/or specific health project. They build upon their existing social networks and gain the trust of the community through word-of-mouth and presence in communal spaces. Their duties include disseminating informational materials, connecting households to the health, economic, and social support they might be seeking, and occasionally collecting data with client households for organizational or research use. These promoters contributed linguistic and cultural expertise and deep levels of knowledge about the experiences of the people they support, including methodological techniques that have and have not worked well with this population. Our research team (see Figure 1) built upon their expertise, insights, and continuous feedback to design research instruments, collect and analyze qualitative data, write up findings, and refine targeted messages for key local decision-makers.
The second CAB, held in English, focused mainly on the other two research questions. Discussions centered around assessing the opportunities and limitations of varying approaches to mapping community assets, service gaps, and areas of high need. Members of this CAB also provided connections to additional key contacts and assisted in brainstorming dissemination channels and mechanisms for pursuing attainable action steps. In addition, these regular meetings enabled members to share their varied perspectives and strengthen the linkages between their agencies and organizations to coordinate emergency-related actions.
Key Informant Interviews
We conducted one-hour semi-structured interviews with key informants in farmworker-serving organizations to gain a deeper understanding of the contextual information we needed to inform the identification of key indicators of farmworker disaster vulnerability and its variations. Based on guidance from our community partners, we spoke with staff serving farmworkers rather than interviewing farmworkers themselves as we had originally planned. The promotors advised us that farmworkers tend to be more comfortable with close-ended rather than open-ended questions and would likely be nervous about audio recording regardless of the data security and confidentiality measures in place. They also advised us that even a 30-minute open-ended interview would be too much for the busy schedules of many farmworkers.
Taking the alternative approach of interviewing staff in farmworker-serving organizations had several important benefits as well as some limitations worth noting. Key benefits included the ability to hold longer conversations and to record audio for later transcription and translation. In addition, more than one of the interview participants mentioned that many immigrants do not want to complain about their conditions, may not realize how substandard their housing is, and are amazingly resilient in the face of adversity. Thus, by speaking with community support staff who have worked with households in a range of different circumstances, it is likely that this approach more readily elicited information about key risk and protective factors. At the same time, what we were able to learn from staff about hurricane experiences of farmworkers and their families was secondhand and inevitably filtered through the staff members’ personal lenses. They may have focused on some topics or missed others that the farmworkers themselves would not have. In addition, the staff members sometimes noted that they had incomplete knowledge of some of the examples that they discussed and were occasionally hesitant to draw firm conclusions about those cases.
Participant Recruitment and Consent
We spoke individually with three promoters who were serving on the Spanish-language CAB and conducted a group interview with three staff providing comprehensive and education-focused supports to migrant families. Interviews were conducted via Zoom, in Spanish for the promoter interviews and in English for the group interview. All participants provided informed consent to participate in the interview and to record the discussion. They also agreed to the use of direct quotes from transcriptions during an end-of-interview data consent check-in.
Interview Guide
The interview guide had three main sections. The first section asked participants about what a typical week looks like for them in their position serving farmworkers, to gain a contextual understanding of their community-based work. We then asked participants to think of two specific households they knew of who had different experiences with the recent hurricane or another major storm. For each household, we asked about employment and demographic factors including children living in the home and the industries in which the adults worked. We then asked participants to describe each household’s experiences before, during, and after the storm event to the best of their knowledge. The third interview section asked participants for recommendations to improve services for farmworker communities, including what agricultural employers and public agencies can do better.
Data Analysis
Carver Martin, the lead author and primary qualitative analyst for the project, cleaned each audio file and used AI-assisted transcription and translation services provided by HappyScribe to produce and clean up a preliminary transcript using a clean verbatim approach. Native Spanish-speaking team members reviewed the side-by-side English and Spanish transcript files for transcription and translation accuracy. Carver Martin then coded each file using MAXQDA qualitative analysis software. Structural codes reflected stages of a process model of events leading up to and following a major storm event (Bernard et al., 2017, p. 18642) and profile codes organized the household case studies participants described (Bernard et al., 2017, p. 165). Thematic codes incorporated both a priori codes derived from the variables in the CDC SVI and emergent codes from the CAB meetings and interviews.
The thematic code categories were framed as factors hypothesized to increase social vulnerability (e.g., low household income, limited English proficiency, seasonal industry, anti-immigrant polices). Carver Martin evaluated these hypotheses using a weighting system in the form of an ordinal variable indicating the extent to which the segment of text indicated an increase or decrease in disaster vulnerability. She then proposed a list of key indicators and refined it based on feedback from the Spanish-speaking CAB (see Appendix A). In addition, Carver Martin created two lists of potential community assets using open coding of the interview transcripts. The first list includes assets mentioned repeatedly and/or mentioned alongside examples of how they have supported farmworker communities before, during, or after hurricanes. The second list includes assets that interview participants mentioned less frequently and/or that were mentioned alongside both positive and negative examples of disaster preparedness and response for farmworkers (see Appendix B).
Geospatial Mapping
Alongside the key informant interviews and CAB discussions, we inventoried and assessed a range of existing state- and federal-level data resources for potential utility in geospatial visualization. We established two foundational tasks for this effort: (1) identify areas where farmworkers and their families live and (2) identify potential sites for distributing resources tailored to the needs of this population. Our findings from this process are discussed below. In addition, our qualitative discussions with CAB members and interview participants illuminated both the large gaps in access to key services and the important role that certain community services play in disaster preparedness and response for farmworker communities. We therefore tested and assessed a strategy for mapping distances to select services, including schools, healthcare facilities, and a subset of religious institutions, to illuminate areas with fewer community-based assets.
We summarized distances to assets in each selected category (religious institutions and schools) to generate a measure of vulnerability for each census tract using the following steps in ArcGIS: (a) compute the distance (Euclidean) to the nearest facility for each cell (30m resolution) across the state of Florida; (b) compute the mean distance within each census tract polygon using the census tracts map adopted by the CDC SVI dataset; and (c) transform the computed mean distances for all the tracts using percentile rank and min/max normalized values. For both datasets, we assigned a range between 0 and 1 to each census tract.
Ethical Considerations and Researcher Positionality
This study was approved by the Institutional Review Board at the University of Florida under exempt protocol #ET00021234 on 11/03/2023 and under exempt revision #ET00022896 on 02/19/2024. Two key ethical issues are of note for this study. First, as indicated above, providing a means by which farmworkers can participate meaningfully in shaping the research while prioritizing their safety and comfort has proven challenging. The message we received from staff at farmworker-serving organizations advising the project is clear: farmworkers, their families, and communities have suffered repeated harms or exploitation by the agricultural industry and government agencies of all levels. Extractive academic projects which make little or no effort to use their results to improve the lives of farmworkers do not help. As one promoter put it, “the system has beaten them so badly.” These circumstances take certain methodological approaches off the table, and for good reason. This is why our university-based research team is especially grateful to our community partners and collaborators for providing their time, insights, and passion for facilitating the learning process and turning research into action.
The second key ethical issue inherent to this work is the paradox of trying to find people who do not want their whereabouts known. This project certainly has not solved the fundamental tension of the need for precise data to inform decision-making and the need to protect the privacy and safety of individuals. However, by working closely with community partners who have intimate knowledge of the local sociopolitical context, we have attempted to achieve the appropriate balance of place-based recommendations for impactful action and the protection of specific locations where vulnerable populations may be discovered and victimized. The safety of the people whose labor feeds our nation, their families, and their communities is paramount.
Findings
We present our findings in two sections. In the first section, we address our first research question by presenting an expanded list of factors relevant to farmworker social vulnerability to hurricanes in North Central Florida. We developed this list based on qualitative data from CAB meetings and key informant interviews, building upon the themes and indicators presented in the CDC SVI. In addition, we highlight some key community assets that these qualitative discussions have revealed as important sites for adaptive capacity before, during, or after hurricanes. As we have found that there is currently insufficient data to comprehensively map farmworker social vulnerability and the important community-level factors that reflect its structural causes, the second section presents several different approaches to using geospatial techniques to inform targeted intervention strategies.
Indicators of Farmworker Social Vulnerability
Conversations with CAB members and interview participants illuminated the importance of understanding not only the individual household-level factors that account for variation in social vulnerability but also the community-level factors that shape social vulnerability for households with certain characteristics. This section presents an overview of the final qualitative codebook of indicators that appear to increase farmworker communities’ social vulnerability to hurricanes. (The full version of the Codebook of Social Vulnerability Themes and Indicators is available in Appendix A.) First, we present four household-level themes derived from the themes in the CDC SVI and, where relevant, selected indicators within those themes that are relevant to the focus of this study. We expanded those themes to include additional key indicators not captured in the CDC SVI. Then, we propose four community-level themes reflecting the context that make the household-level factors matter for disaster vulnerability. Finally, we discuss how additional assets-based community-level factors such as proximity to institutions that farmworkers may interact with can also be used to identify possible intervention strategies to improve adaptive capacity.
Household-Level Indicators of Farmworker Social Vulnerability
When applying the CDC SVI indicators to the interview transcripts, several emerged as relevant. In particular, housing cost burden, low educational attainment, limited English proficiency, mobile homes, and lack of a personal vehicle received particular focus in discussion. However, it quickly became clear that the existing CDC SVI indicators were insufficient to encompass the key factors that increase social vulnerability among North Central Florida farmworkers. For instance, instead of using the CDC SVI indicator ‘unemployment,’ we propose ‘job precarity’ as an indicator of employment-related barriers to safety for this population. In addition, the experience of migrating to a new area is also important to understand, especially when households do not yet have a full familiarity with the locations of local resources or the hazards associated with hurricanes. We also found it important to modify the “Racial and Ethnic Minority Status” theme to “Minority Status,” accounting for the inequities associated with diverse legal statuses as well as the heterogeneous experiences associated with different racial and ethnic identities. Table 1 presents the selected CDC SVI indicators as well as the proposed additions to each theme. A member of the data stakeholders CAB also emphasized that the effects of social stigma cut across all of these themes and contribute to the barriers households experience.
Table 1. Household-Level Indicators of Farmworker Social Vulnerability in North Central Florida
| Household-Level Theme | Indicators Derived from CDC SVI | Indicators Added Based on Qualitative Data |
| Socioeconomic Status | ● Housing cost burden ● Low educational attainment ● Low household income/poverty ● No health insurance |
● Job precarity ● No housing insurance |
| Household Characteristics | ● Limited English proficiency ● More children than adults ● Disability/special health needs ● Internet access barriers |
● Short time in country ● Limited hurricane knowledge/experience ● Limited Spanish proficiency ● Short time in county/local area ● Young children |
| Minority Status | ● Legal status (in-process, undocumented, mixed-status, etc.) ● Hispanic/Latino ● Indigenous (Mixteco, Zapoteco, etc.) |
|
| Housing Type & Transportation | ● Mobile homes ● No personal vehicle ● Crowding |
● Substandard housing condition ● Rental status |
Community-Level Indicators of Farmworker Social Vulnerability
Even with the expansion of the CDC SVI themes presented in Table 1, this list of indicators did not reflect the full context for why each factor explains variations in social vulnerability. Several quotes from the interviews demonstrate how household-level factors must be understood in relationship to community-level factors. For example, a promoter pointed out how patterns within specific agricultural and forestry industries create job precarities for certain workers: “Those in nurseries and dairies in the Trenton and Bell areas are more stable in their jobs unless they do field work, like seasonal ones.” This comment references the fact that nursery and dairy jobs tend to be year-round, while field crop jobs such as watermelon and blueberry harvesting are highly seasonal and temporary. Group interview participants explained how families with schoolchildren may be more or less able to understand English-only public-school communications depending on their children’s ages and their ability to translate for the household. And another promoter described how legal status was used as a basis for denying government assistance to a hurricane survivor: “They went to a place in Fanning Springs [where] FEMA was there at that time. […] And they denied her help because she didn't have a social security number, so they told her that she didn't qualify.” Table 2 presents proposed community-level themes and indicators as well as the most closely related household-level themes.
Table 2. Community-Level Indicators of Farmworker Social Vulnerability in North Central Florida
| Community-Level Theme | Community-Level Indicators Added Based on Qualitative Data | Corresponding Household-Level Theme |
| Labor-Intensive Agriculture and Forestry Industries | ● Seasonality ● Low earning potential ● Lack of worker safety protection oversight ● Scheduling demands ● Restricted access to work sites ● H-2A guestworker visa program ● Workplace hazards ● Exclusion from ag-earmarked assistance a |
Socioeconomic Status |
| Communications Barriers | ● English-only emergency management ● English-only healthcare services ● English-only public media ● English-only public school communications ● English-only municipal services |
Household Characteristics |
| Sociopolitical Environment | ● Anti-immigrant policies ● Fear of public entities ● Anti-immigrant sentiment ● Race- and class-based discrimination |
Minority Status |
| Economic & Material Support Service Gaps | ● Rurality ● Lack of low-cost health services ● Lack of public transportation ● Disconnection between and among social service agencies and community-based orgs |
Housing Type & Transportation |
The qualitative discussions also illuminated the complexities of how indicators across the different themes in Tables 1 and 2 intersect. For example, a promoter gave an eloquent explanation of the interactions between rurality, legal status, the low earning potential of agricultural employment, and housing cost burden:
There is such a thing as geographic fatalism. I am talking about a family in [a town in Hamilton County that is] like a desert town. The only thing there is a gas station and a Dollar Tree, basically, and a little Mexican food store. The rest is nothing. […] It's an extremely small town, with a little school and nothing else. Where I live is a small town. If you compare it to Gainesville or a city, this is a country town. It is still a very small town, very basic in many ways, but not to the extreme of [that town in Hamilton County]. This is a town that has grown, that has other services, that has other resources, that has other alternatives, that has a larger information network, a larger mechanism. So, we have to take into account that geographic fatalism exists and that […] undocumented people, agricultural workers, are generally located in these places because they are more economical—that is, paying rent or buying a house in a place like that does not compare to buying a house, for example in Gainesville or in a larger city. Because they are not paid the way they should be. Any one of them can work a full day in the field, and they would be getting paid $80 a day […] Sometimes they're paid $6, $7 an hour. So that's the point.
This quote illustrates the importance of gaining a comprehensive and multi-level understanding of social vulnerability that considers factors across multiple themes. It also underlines how the presence of community-level assets such as social networks and supportive institutions can improve adaptive capacities.
Community Asset-Based Indicators of Adaptive Capacity
In addition to community-level factors that increase social vulnerability, the interviews highlighted ways in which community-level factors can support adaptive capacity. (The full list is available in Appendix B.) Key supportive community assets that interview participants described included interpersonal social networks, farmworker- and migrant-serving community organizations and programs, Hispanic/Latino food stores, and churches with Spanish-language services and/or farmworker ministries. These assets were mentioned repeatedly, often in ways that clearly linked to disaster preparedness, response, or recovery capacities. One promoter described how drawing upon her own social network and a local church helped a family find shelter during Idalia:
The schools were already full, but there was a church […] in Gilchrist County that was open. And the person who coordinates there is also Hispanic. And that person had already passed the information to me that if there were any last-minute emergency families, they were going to receive them before six o'clock that day. So I spread the word […] And this family went to [the church] to take refuge because it was much closer to them.
The interviewees mentioned other community assets serving farmworkers less frequently or described them as having a mixed record of success. These assets included engaged crew leaders who took steps to connect workers with information and resources, public schools, libraries, community centers, neighborhood organizations, farmworker-serving and mobile health clinics, and a subset of agricultural employers who offered strong structures as shelters and/or checked in on the safety of their employees. For example, the group interview participants had the following exchange about variation in the amount of support that agricultural employers provide for workers’ safety:
[Speaker 1]: During the storm, [some of the horse farms] opened up housing where the families could go and stay on the stable that was block walls, opposed to being in the flimsy trailers. So that would be wonderful if we had more nursery owners and farmers checking up on their people. And I can think of one nursery that, when the storm happened, they were reaching out, “Is everybody okay?” afterwards. And it was a group text, and everybody was checking on everybody.
[Speaker 2]: But we also have nurseries who won’t allow us even at the gate.
Public schools are another example of resources that have had mixed success in reaching farmworker communities. While they may be the only public entity with which households with children have regular contact, many do not offer communications in Spanish and are thus limited in their effectiveness at providing timely information during disaster situations.
Mapping Social Vulnerability Indicators
We explored several possibilities for visualizing the vulnerability of farmworker communities as well as community-level assets that support their adaptive capacity. First, we sought a reliable way to map where farmworkers are likely to be living and working. Second, we tested a possible approach to presenting the selected indicators with available geospatial data alongside qualitative findings to contextualize the visualizations. And third, we tested a possible approach to mapping selected community assets that may contribute to adaptive capacity, thereby illuminating areas that do not have these resources and thus may require more intensive intervention.
Mapping Farmworker Vulnerability—Empirical Challenges
We identified two datasets that could be used to map areas and their estimated farmworker populations, each with benefits and drawbacks. The first, and the most comprehensive dataset that we identified, is a dashboard by the National Center for Farmworker Health (n.d.)43. Integrating 11 different data sources, the dashboard helps to fill some of the data gaps left by each individual dataset, such as the fact that the National Agricultural Workers Survey (NAWS) does not include H-2A workers, and only provides regional-level estimates. The dashboard, however, has two main limitations. First, its population estimates are provided at the county level rather than the census tract level, and thus the data are insufficiently granular to inform within-county interventions such as the siting of services. Second, the dashboard is only updated every five years when the Census of Agriculture is conducted, and thus the estimates cannot stay up to date with the rapid shifts in the local population both seasonally and year-over-year as migrant workers move into and out of the area and as new immigrants arrive.
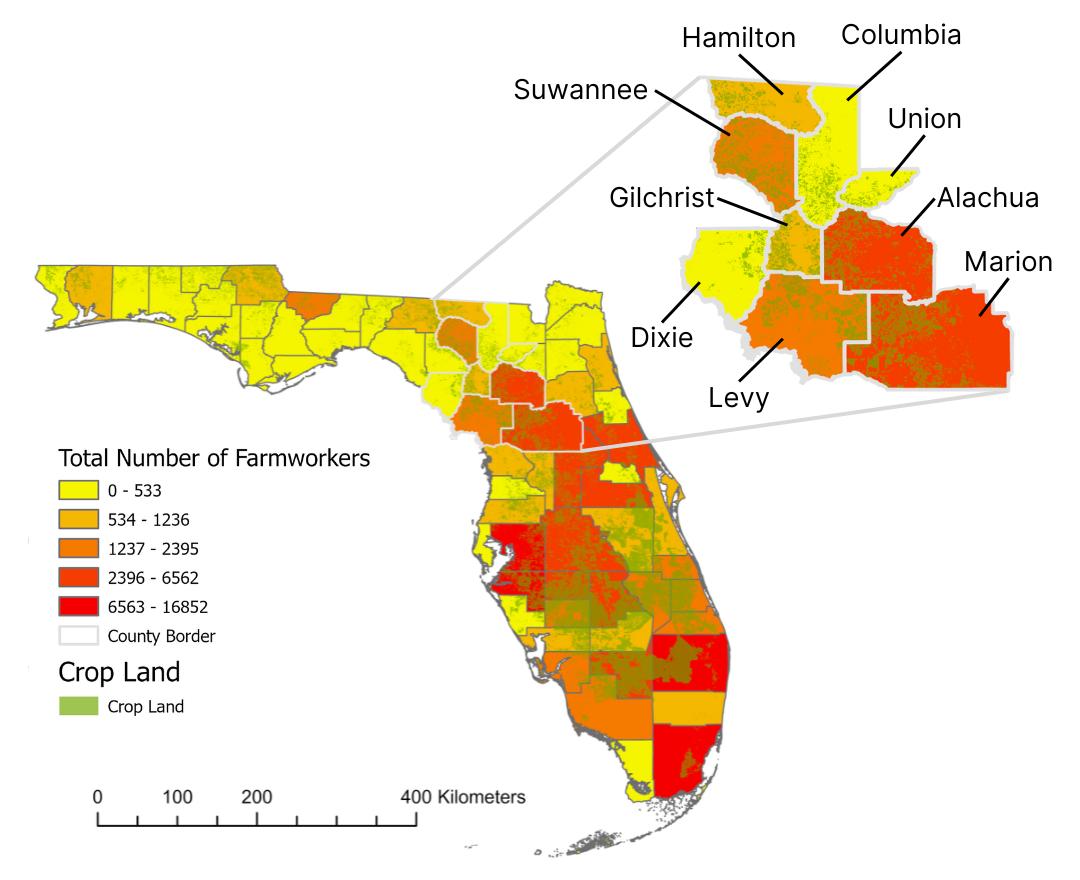
The second dataset we evaluated was a database of agricultural water permitting maintained by the Florida Department of Agriculture and Consumer Services (Dourte, 202344). This dataset provides a more fine-grained view not only of the specific locations of agricultural operations but also of the specific agricultural products. However, it remains a challenge to determine the per-acre labor need for each area, and conversations with an agricultural extension agent raised some questions about the year-over-year reliability of this dataset given the need to rotate crops seasonally or to leave some lands fallow every few years. This dataset also does not identify forestry operations relevant to the experiences of farmworker communities in this area—specifically pine straw baling. Despite these limitations, we have found the cropland overlay useful for identifying locations where agricultural workers may be working. Figure 2 integrates both the National Center for Farmworker Health population estimates and the Florida cropland map. This figure shows that while agricultural land is not as dense in the North Central Florida area as it is in the more agriculturally intensive South Central area, the focal counties in this study nevertheless have relatively high concentrations of both cropland and farmworker populations. Areas of particular interest include the western parts of Alachua and Marion Counties, northern Levy County, the Dixie-Gilchrist County border, Suwannee County, and western Hamilton County.
Figure 2. Florida Croplands and 2017 Farmworker Population Estimates by County
Contextualizing Social Vulnerability Indicators
Interview participants suggested that living in mobile homes was both highly prevalent among the North Central Florida farmworker community and an important factor in shaping families’ hurricane risks and experiences. A promoter explained that legal-status related fears prevented families from leaving mobile homes to access shelter, leaving them vulnerable to storm hazards:
Many fear that they won't be accepted because they don't have documents. Or because they don't have any identification. I think that's one of the things that limits people from going to a shelter, to take the steps to go to a shelter. […] I have like two families that have children with disabilities. […] But because they are afraid, they're just waiting for whatever happens. […] They stayed there in their house. And they live in mobile homes.
Another promoter described the traumas to which a family was exposed as they weathered the storm from within their own mobile home:
They have a mobile home that they had bought […] they were paying for a regular home purchase and, they had a tree that completely fell on their home. […] And it was a super negative experience for them, a big trauma for the children.
A group interview participant also described how emergency management communications were inadequate as they did not alleviate families’ concerns regarding losing economic resources located in their homes:
We have quite a few trailer parks, and so of course we went around and were letting people know that they had to be evacuated. The county had said if you are in a trailer park you have to go to a shelter. […] A lot of them were fearful. Sometimes they don't have their money in banks; a lot of them keep their money in homes. So they don't want to leave their home.
A third promoter explained that even those who did seek shelter during the storm returned to homes without running water because their mobile homes ran on electric pumps that did not function until electrical power was restored:
[After the storm] they didn't have food, they didn't have electricity, they didn't have... In the mobile home, the water doesn't work with city water, but it works with a pump you have for your household that runs on electricity.
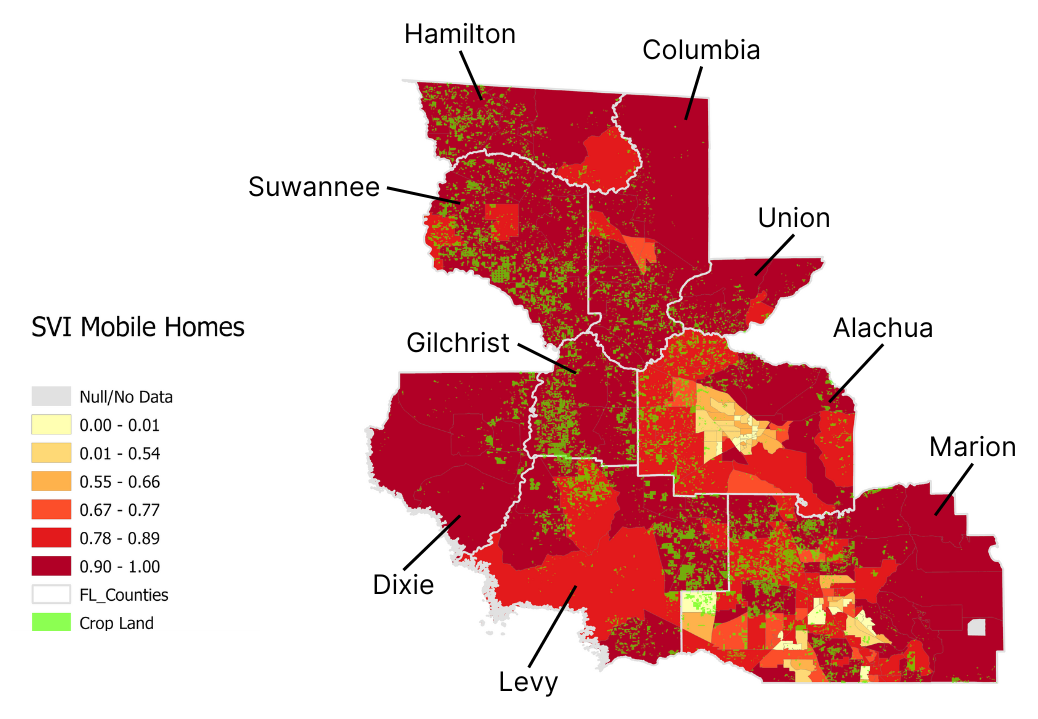
Within this context, identifying hotspots where fears of contact with public agencies, concerns about losing uninsured homes and finances, and high concentrations of mobile homes intersect is crucial for preventing future traumas and ensuring post-disaster access to potable water. Therefore, we overlaid the cropland data on the census tract-level mobile homes indicator from the CDC SVI to identify areas that may have a particular need for services designed for mobile home residents who fear leaving their homes. Of course, a major limitation to this approach is that while the cropland layer may be useful for locating where farmworkers might be working, it is not an ideal proxy for where farmworkers are living, as commuting distances may be quite long. Nevertheless, Figure 3 below suggests that western Hamilton County, the Dixie-Gilchrist County border area, southern Suwannee County, and eastern Levy County may be the highest-priority areas to target when providing communications and services that account for concerns that may prevent community members from leaving mobile homes as well as coordinating longer-term access to potable water that does not ask for legal documentation. Overall, this figure underlines the dire need for resources, especially in the northern and western counties of our focal region.
Figure 3. Florida Croplands Overlaid on Census Tract Concentrations of Mobile Homes
Mapping Community Assets to Identify Adaptive Capacity
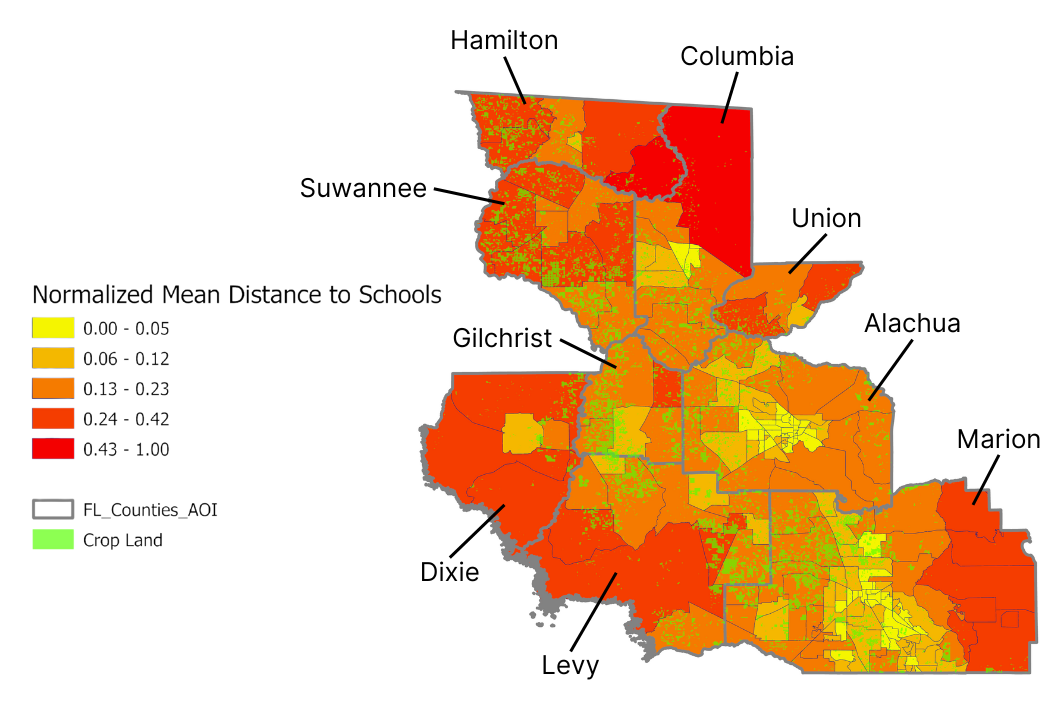
Another approach to using maps to prioritize areas for specific types of programs and services is to overlay the cropland map with census tract-level data showing the distances to specific community assets that could be leveraged to better serve farmworker communities. As noted above, public schools are one such entity that have a history of mixed success in contributing to households’ disaster preparedness, for example. According to our interviews and CAB discussions, K-12 schools may be the only point of contact families have with local government and public assistance agencies. As shown in Figure 4, we mapped agricultural lands alongside average distances to the nearest school to illuminate areas where interventions targeting school facilities may be particularly useful. These interventions could include ensuring multi-language communications and siting health clinics and social supports that do not ask for identification or legal documentation at school facilities. Simultaneously, this visualization illuminates areas with high densities of agricultural lands and low densities of school facilities, where a different approach should be prioritized.
Of course, several important limitations of this approach should be considered when interpreting the map. The variable reflecting school distance is calculated by averaging the Euclidean distance (i.e., not the driving distance) between each pixel in a census tract and the nearest school. This results in a generalized score for each census tract rather than pinpointing specific schools located close to agricultural lands. In addition, as noted above, farmworkers may not be living next to their workplaces mapped within the cropland layer. However, it may be possible for school-based programs to conduct outreach among nearby farms to share information about resource availability.
Despite these limitations, this visualization provides some guidance regarding areas where targeting schools with interventions to better serve farmworkers may be most advantageous. These areas include northern Levy County, western and central Marion County, northwest Alachua County, and the intersection of Suwannee, Columbia, and Gilchrist Counties. By contrast, northern Suwannee County and western Hamilton County may benefit from prioritizing other institutions instead, such as farmworker-serving churches.
Figure 4. Florida Croplands and Average Distance to Nearest School by Census Tract
These two examples—the mobile homes indicator and the public school asset map—illustrate the opportunities and challenges of using a geospatial approach to visualizing farmworker social vulnerabilities to disasters. Carefully considered, this approach can be used to identify specific places whose local contexts may make particular intervention strategies more or less successful. Understandings of these community contexts should come from in-depth and repeated discussions with the community-based experts who have a deep knowledge of both the specific place and of the specific population in that location.
Conclusions
Public Health Implications
This study has several important public health implications both for policy and practice. First, future indices of farmworker social vulnerability should be developed in collaboration with organizations and practitioners that serve them. Researchers and practitioners building these indices should also prioritize identifying community context indicators—such as anti-immigrant policies, labor-intensive agriculture and forestry industries prevalent in the area, and lack of language access services by public agencies and healthcare facilities—in addition to the traditional household-level and demographic indicators. This imperative also applies to community risk and needs assessments that are conducted by local health or emergency management departments. We invite these community-based teams to adapt the list of themes and indicators proposed in this report, adding and removing items based on the expert input of farmworker-serving program staff who live and work alongside farmworker communities. We hope these contributions can form the basis for locally meaningful vulnerability assessments and action plans focused on farmworker communities.
To further support these localized efforts, public data programs that collect information on agricultural and forestry industries should improve their capacity to project labor needs. A tool that would be particularly useful would estimate the number of workers needed by industry across the agricultural calendar at the county or census tract level. This approach would improve local communities’ ability to understand the size of their farmworker populations and proactively address the specific hazards and precarities associated with the industries that are most prevalent in their area. In the absence of such a tool, it will be necessary to use a combination of the limited existing resources to approximate where farmworker communities may be able to access specific kinds of services. In this study, we overlaid Florida cropland onto the National Center for Farmworker Health county population estimates, the CDC SVI mobile home percentile indicator, and a measure of the average distance to the nearest school by census tract. Viewed together, these maps can inform specific intervention strategies tailored to particular areas. For instance, the Dixie-Levy County border area likely has a relatively large agricultural population, a high prevalence of mobile homes, and a moderate average distance to schools. Interventions to build capacity among local schools to communicate more effectively with farmworker communities and to assist them with safely and comfortably accessing shelters may be a useful starting strategy in the short term. By contrast, northern Suwannee County and western Hamilton County may require more intensive efforts, both building on existing community assets such as farmworker-serving churches and locating additional migrant-serving health and social services in the area.
To improve farmworkers’ resilience and preparedness for disasters overall, public health agencies should partner with organizations with close ties to farmworkers—including migrant assistance groups, farmworker health and labor organizations, and churches—to bridge the divide between public services and agricultural worker populations. These groups are able to leverage their strong social networks as well as linguistic and cultural competencies to meet vulnerable communities where they are. They should receive both material and technical assistance to build their capacities to work in disaster preparedness, response, and recovery. With expanded capacities, these groups will be able to expand the services that they provide to a broader group of farmworkers, while at the same time building links and trust between farmworker communities and public health and emergency management agencies.
Farmworker- and migrant-serving organizations should also be given a larger role in emergency planning and decision-making processes at the local level as well as at the regional, state, and federal levels. Their brokering capacities will be indispensable to researchers and decision-makers pushing for structural changes to redress the root causes of social vulnerabilities. Collaborating with these groups to add community-level indicators to existing SVIs and public datasets would also provide an additional evidentiary basis on which to hold communities accountable for the well-being of all their residents and to track improvements over time. Interventions targeting exploitative labor practices, language access inequities, structural racism and xenophobia, and inequitable distribution of material and social support are crucial for moving from coping with social vulnerabilities to eliminating them.
Limitations
This pilot feasibility study represents only the beginning stages of what we hope will be a larger effort to better measure the disaster vulnerability of farmworker communities. Our particular focus on hurricanes likely has missed important social vulnerability factors that a multi-hazard perspective might illuminate (Drakes & Tate, 202245; Gares & Montz, 2014). Finally, staffing for this small project was limited; for instance, the qualitative coding process in MAXQDA was conducted by one primary analyst, and thus we cannot assess intercoder reliability. Staffing future iterations of this project with multiple qualitative coders, especially Spanish-speaking coders, will be crucial.
Future Research Directions
The next steps for this work include several immediate and more long-term efforts. First, we plan to survey farmworkers in the North Central Florida area. The short survey will take up to 10 minutes and be based on the qualitatively informed SVI variable selection process. This process will provide a means for members of farmworker communities to contribute directly to the outcomes of this project by providing input into which of the indicators—especially community-level indicators—are most important to measure and monitor over time. Survey results will join the qualitative findings and geospatial analyses in communications products targeted at key decision-makers in North Central Florida. In addition, we plan to present a methodological toolkit that research teams can adapt to other local contexts for conducting farmworker social vulnerability assessments in partnership with community-based organizations. Finally, we have heard from CAB members that the regular meetings have been impactful in the form of information exchange and coordination between organizations that serve farmworkers and researchers. We will seek additional funding to support the continuation of these regular meetings which we hope will result in a coordinated regional disaster resilience plan for farmworker and migrant communities.
Acknowledgements. We are grateful for the collaboration and insights of our community partners, the Rural Women’s Health Project under the leadership of Robin Lewy, and the Farmworker Association of Florida under the leadership of Jeannie Economos, Ernesto Ruiz, and Dominique O'Connor. We could not carry out this work without their local connections and the crucial insights and expertise of the community-based staff who serve farmworker communities on behalf of these organizations. We are also grateful for the generous contributions of time and ideas from local data stakeholders serving on our Community Advisory Boards as well as colleagues and reviewers at the Natural Hazards Center and the Great Lakes Center for Farmworker Health and Wellbeing, all of whom provided insightful input and feedback. Finally, we are extremely grateful for the essential language interpretation support we received from Pablo Lamino, José Perez Orozco, and Ismelda Alvarez at the University of Florida.
References
-
Court, C. D., Qiao, X., Li, M., & McDaid, K. (2023). Preliminary assessment of agricultural losses and damages resulting from Hurricane Idalia. https://fred.ifas.ufl.edu/media/fredifasufledu/economic-impact-analysis/reports/FRE-Final-Hurricane-Idalia-Report.pdf ↩
-
Emrich, C. T., & Cutter, S. L. (2011). Social vulnerability to climate-sensitive hazards in the southern United States. Weather, Climate, and Society, 3(3), 193-208. https://doi.org/10.1175/2011WCAS1092.1 ↩
-
Rusnak, P. (2023, Septeber 28). What’s the damage? Hurricane Idalia toll on Florida ag upwards of $447 million. Growing Produce. https://www.growingproduce.com/farm-management/first-look-hurricane-idalia-toll-on-florida-ag-production-at-least-78-million/ ↩
-
Méndez, M., Flores-Haro, G., & Zucker, L. (2020). The (In)visible victims of disaster: Understanding the vulnerability of undocumented Latino/a and Indigenous immigrants. Geoforum, 116, 50-62. https://doi.org/10.1016/j.geoforum.2020.07.007 ↩
-
Handal, A. J., Iglesias-Ríos, L., Fleming, P. J., Valentín-Cortés, M. A., & O’Neill, M. S. (2020). “Essential” but expendable: Farmworkers during the COVID-19 pandemic—The Michigan Farmworker Project. American Journal of Public Health, 110(12), 1760-1762. https://doi.org/10.2105/ajph.2020.305947 ↩
-
Ramos, A. K., Lowe, A. E., Herstein, J. J., Schwedhelm, S., Dineen, K. K., & Lowe, J. J. (2020). Invisible no more: The impact of COVID-19 on essential food production workers. Journal of Agromedicine, 25(4), 378-382. https://doi.org/10.1080/1059924X.2020.1814925 ↩
-
Centers for Disease Control and Prevention. (2022, August 5). CDC/ATSDR SVI 2020 documentation. https://www.atsdr.cdc.gov/placeandhealth/svi/documentation/pdf/SVI2020Documentation_08.05.22.pdf ↩
-
Fielding-Miller, R. K., Sundaram, M. E., & Brouwer, K. (2020). Social determinants of COVID-19 mortality at the county level. PLOS ONE, 15(10), e0240151. https://doi.org/10.1371/journal.pone.0240151 ↩
-
Keeney, A. J., Quandt, A., Villaseñor, M. D., Flores, D., & Flores, L., Jr. (2022). Occupational stressors and access to COVID-19 resources among commuting and residential Hispanic/Latino farmworkers in a US-Mexico border region. International Journal of Environmental Research and Public Health, 19(2). https://doi.org/10.3390/ijerph19020763 ↩
-
Navarro-Gambín, P., & Jansen, K. (2024). Migrant agricultural workers in search of a dignified life: Labour conditions as a source of vulnerability in Spain. Sociologia Ruralis, 64(1), 126-148. https://doi.org/10.1111/soru.12462 ↩
-
Ramos, A. K. (2017). Precarious work, invisible people, unjust livelihoods: A social ecological model of migrant farmworker health in the Midwest (Publication Number 1936) [Doctoral dissertation, Clemson University]. Tiger Prints. https://tigerprints.clemson.edu/all_dissertations/1936/ ↩
-
Willen, S. S., Knipper, M., Abadía-Barrero, C. E., & Davidovitch, N. (2017). Syndemic vulnerability and the right to health. The Lancet, 389(10072), 964-977. https://doi.org/10.1016/S0140-6736(17)30261-1 ↩
-
Mac, V. V. T., & McCauley, L. A. (2017). Farmworker vulnerability to heat hazards: A conceptual framework. Journal of Nursing Scholarship, 49(6), 617-624. https://doi.org/10.1111/jnu.12327 ↩
-
Romero Lankao, P., & Qin, H. (2011). Conceptualizing urban vulnerability to global climate and environmental change. Current Opinion in Environmental Sustainability, 3(3), 142-149. https://doi.org/10.1016/j.cosust.2010.12.016 ↩
-
Spielman, S. E., Tuccillo, J., Folch, D. C., Schweikert, A., Davies, R., Wood, N., & Tate, E. (2020). Evaluating social vulnerability indicators: Criteria and their application to the Social Vulnerability Index. Natural Hazards, 100(1), 417-436. https://doi.org/10.1007/s11069-019-03820-z ↩
-
Cutter, S. L., Boruff, B. J., & Shirley, W. L. (2003). Social vulnerability to environmental hazards. Social Science Quarterly, 84(2), 242-261. https://doi.org/10.1111/1540-6237.8402002 ↩
-
Flanagan, B., Hallisey, E., Sharpe, J. D., Mertzlufft, C. E., & Grossman, M. (2021). On the validity of validation: A Commentary on Rufat, Tate, Emrich, and Antolini’s “How valid are social vulnerability models?”. Annals of the American Association of Geographers, 111(4), em-i-em-vi. https://doi.org/10.1080/24694452.2020.1857220 ↩
-
Healthy People 2030. (n.d.). Social determinants of health. U.S. Department of Health and Human Services, Office of Disease Prevention and Health Promotion. Retrieved April 4, 2024, from https://health.gov/healthypeople/priority-areas/social-determinants-health ↩
-
Adams, R. M., Evans, C. M., & Peek, L. (2019). Social vulnerability and disasters. CONVERGE Training Modules. Boulder, CO: Natural Hazards Center, University of Colorado Boulder. https://converge.colorado.edu/resources/training-modules ↩
-
Flanagan, B. E., Gregory, E. W., Hallisey, E. J., Heitgerd, J. L., & Lewis, B. (2011). A social vulnerability index for disaster management. Journal of Homeland Security and Emergency Management, 8(1). https://doi.org/10.2202/1547-7355.1792 ↩
-
Thomas, K., Hardy, R. D., Lazrus, H., Mendez, M., Orlove, B., Rivera-Collazo, I., Roberts, J. T., Rockman, M., Warner, B. P., & Winthrop, R. (2019). Explaining differential vulnerability to climate change: A social science review. WIREs Climate Change, 10(2), e565. https://doi.org/https://doi.org/10.1002/wcc.565 ↩
-
Ribot, J. (2014). Cause and response: Vulnerability and climate in the Anthropocene. The Journal of Peasant Studies, 41(5), 667-705. https://doi.org/10.1080/03066150.2014.894911 ↩
-
Painter, M. A., Shah, S. H., Damestoit, G. C., Khalid, F., Prudencio, W., Chisty, M. A., Tormos-Aponte, F., & Wilhelmi, O. (2024). A systematic scoping review of the Social Vulnerability Index as applied to natural hazards. Natural Hazards. https://doi.org/10.1007/s11069-023-06378-z ↩
-
Quesada, J., Hart, L. K., & Bourgois, P. (2011). Structural vulnerability and health: Latino migrant laborers in the United States. Medical Anthropology, 30(4), 339-362. https://doi.org/10.1080/01459740.2011.576725 ↩
-
Reckien, D. (2018). What is in an index? Construction method, data metric, and weighting scheme determine the outcome of composite social vulnerability indices in New York City. Regional Environmental Change, 18(5), 1439-1451. https://doi.org/10.1007/s10113-017-1273-7 ↩
-
Wood, E., Sanders, M., & Frazier, T. (2021). The practical use of social vulnerability indicators in disaster management. International Journal of Disaster Risk Reduction, 63, 102464. https://doi.org/https://doi.org/10.1016/j.ijdrr.2021.102464 ↩
-
Paulino, Y., Badowski, G., Chennaux, J. S. N., Guerrero, M., Cruz, C., King, R., & Panapasa, S. (2021). Calculating the Social Vulnerability Index for Guam. Natural Hazards Center Public Health Disaster Research Report Series, Report 12. https://hazards.colorado.edu/public-health-disaster-research/calculating-the-social-vulnerability-index-for-guam ↩
-
Yellow Horse, A. J., Deschine Parkhurst, N. A., & Huyser, K. R. (2020). COVID-19 in New Mexico tribal lands: Understanding the role of social vulnerabilities and historical racisms. Frontiers in Sociology, 5, 610355. https://doi.org/10.3389/fsoc.2020.610355 ↩
-
Park, G., & Xu, Z. (2022). The constituent components and local indicator variables of social vulnerability index. Natural Hazards, 110(1), 95-120. https://doi.org/10.1007/s11069-021-04938-9 ↩
-
Fan, M., & Pena, A. A. (2021). How vulnerable Are U.S. crop workers?: Evidence from representative worker data and implications for COVID-19. Journal of Agromedicine, 26(2), 256-265. https://doi.org/10.1080/1059924X.2021.1890293 ↩
-
Gares, C. E., & Montz, B. E. (2014). Disaster vulnerability of migrant and seasonal farmworkers: A comparison of Texas and North Carolina. Southeastern Geographer, 54(1), 36-54. http://www.jstor.org/stable/26233672 ↩
-
Pagán-Santana, M., Liebman, A. K., & Seda, C. H. (2023). Deepening the divide: Health inequities and climate change among farmworkers. Journal of Agromedicine, 28(1), 57-60. https://doi.org/10.1080/1059924X.2022.2148034 ↩
-
Gold, A., Fung, W., Gabbard, S., & Carroll, D. (2022). Findings from the National Agricultural Workers Survey (NAWS) 2019–2020: A demographic and employment profile of United States farmworkers. https://www.dol.gov/sites/dolgov/files/ETA/naws/pdfs/NAWS%20Research%20Report%2016.pdf ↩
-
Accorsi, E. K., Samples, J., McCauley, L. A., & Shadbeh, N. (2020). Sleeping within six feet: Challenging Oregon’s labor housing COVID-19 guidelines. Journal of Agromedicine, 25(4), 413-416. https://doi.org/10.1080/1059924X.2020.1815622 ↩
-
Austin, E., Kasner, E., Seto, E., & Spector, J. (2021). Combined burden of heat and particulate matter air quality in WA agriculture. Journal of Agromedicine, 26(1), 18-27. https://doi.org/10.1080/1059924x.2020.1795032 ↩
-
Cheney, A. M., Barrera, T., Rodriguez, K., & Jaramillo López, A. M. (2022). The intersection of workplace and environmental exposure on health in Latinx farm working communities in rural inland Southern California. International Journal of Environmental Research and Public Health, 19(19), 12940. https://doi.org/10.3390/ijerph191912940 ↩
-
Martinez, J., Stephen, L., Mize, R., Pérez Báez, G., Sanchez, V., & Samples, J. (2021). COVID-19’s disproportionate impact on Oregon farmworkers is far-reaching and long-term. https://cirsinc.org/wp-content/uploads/2021/10/COFS_Report2021_ENG_FULL-compressed.pdf ↩
-
Binational Center for Indigenous Oaxacan Community Development, Vista Community Clinic / FarmWorker CARE Coalition, California Institute for Rural Studies, & COVID-19 Farmworker Study Collective. (2021). Experts in their fields: Contributions and realities of indigenous campesinos in California during COVID-19. https://cirsinc.org/wp-content/uploads/2021/10/COFS_Experts-in-Their-Fields_10.18.21_Final.pdf ↩
-
Holmes, S. M. (2011). Structural vulnerability and hierarchies of ethnicity and citizenship on the farm. Medical Anthropology, 30(4), 425-449. https://doi.org/10.1080/01459740.2011.576728 ↩
-
Immigration, CS/HB 1617. (2023). https://www.flsenate.gov/Session/Bill/2023/1617 ↩
-
Employment Regulations, HB 433. (2024). https://www.flsenate.gov/Session/Bill/2024/433/ ↩
-
Bernard, R. H., Wutich, A., & Ryan, G. W. (2017). Analyzing qualitative data: Systematic approaches (2nd ed.). SAGE. ↩
-
National Center for Farmworker Health. (n.d.). Farm Labor Data Dashboard [Database]. Retrieved March 1, 2024, from https://ncfh.org/dashboard.html ↩
-
Dourte, D. (2023, January 27). Florida Statewide Agricultural Irrigation Demand Geodatabase: FSAID11_2022_ALG_Final [Data set]. Florida Department of Agriculture and Consumer Services Office of Agricultural Water Policy. https://www.fdacs.gov/Water/Agricultural-Water-Supply-Planning ↩
-
Drakes, O., & Tate, E. (2022, 2022/02/21). Social vulnerability in a multi-hazard context: A systematic review. Environmental Research Letters, 17(3), 033001. https://doi.org/10.1088/1748-9326/ac5140 ↩
Carver Martin, M., Abd-Elrahman, A., & Monaghan, P. (2024). The Social Vulnerability of Farmworker Communities in North Central Florida: Challenges and Opportunities for Mapping Vulnerable Populations. (Natural Hazards Center Public Health Disaster Research Report Series, Report 45). Natural Hazards Center, University of Colorado Boulder. https://hazards.colorado.edu/public-health-disaster-research/the-social-vulnerability-of-farmworker-communities-in-north-central-florida