Tornadoes Without Warning
Severe Weather Alerts, Risk Perception, and Protective Action During an Undetected Tornado
Publication Date: 2026
Abstract
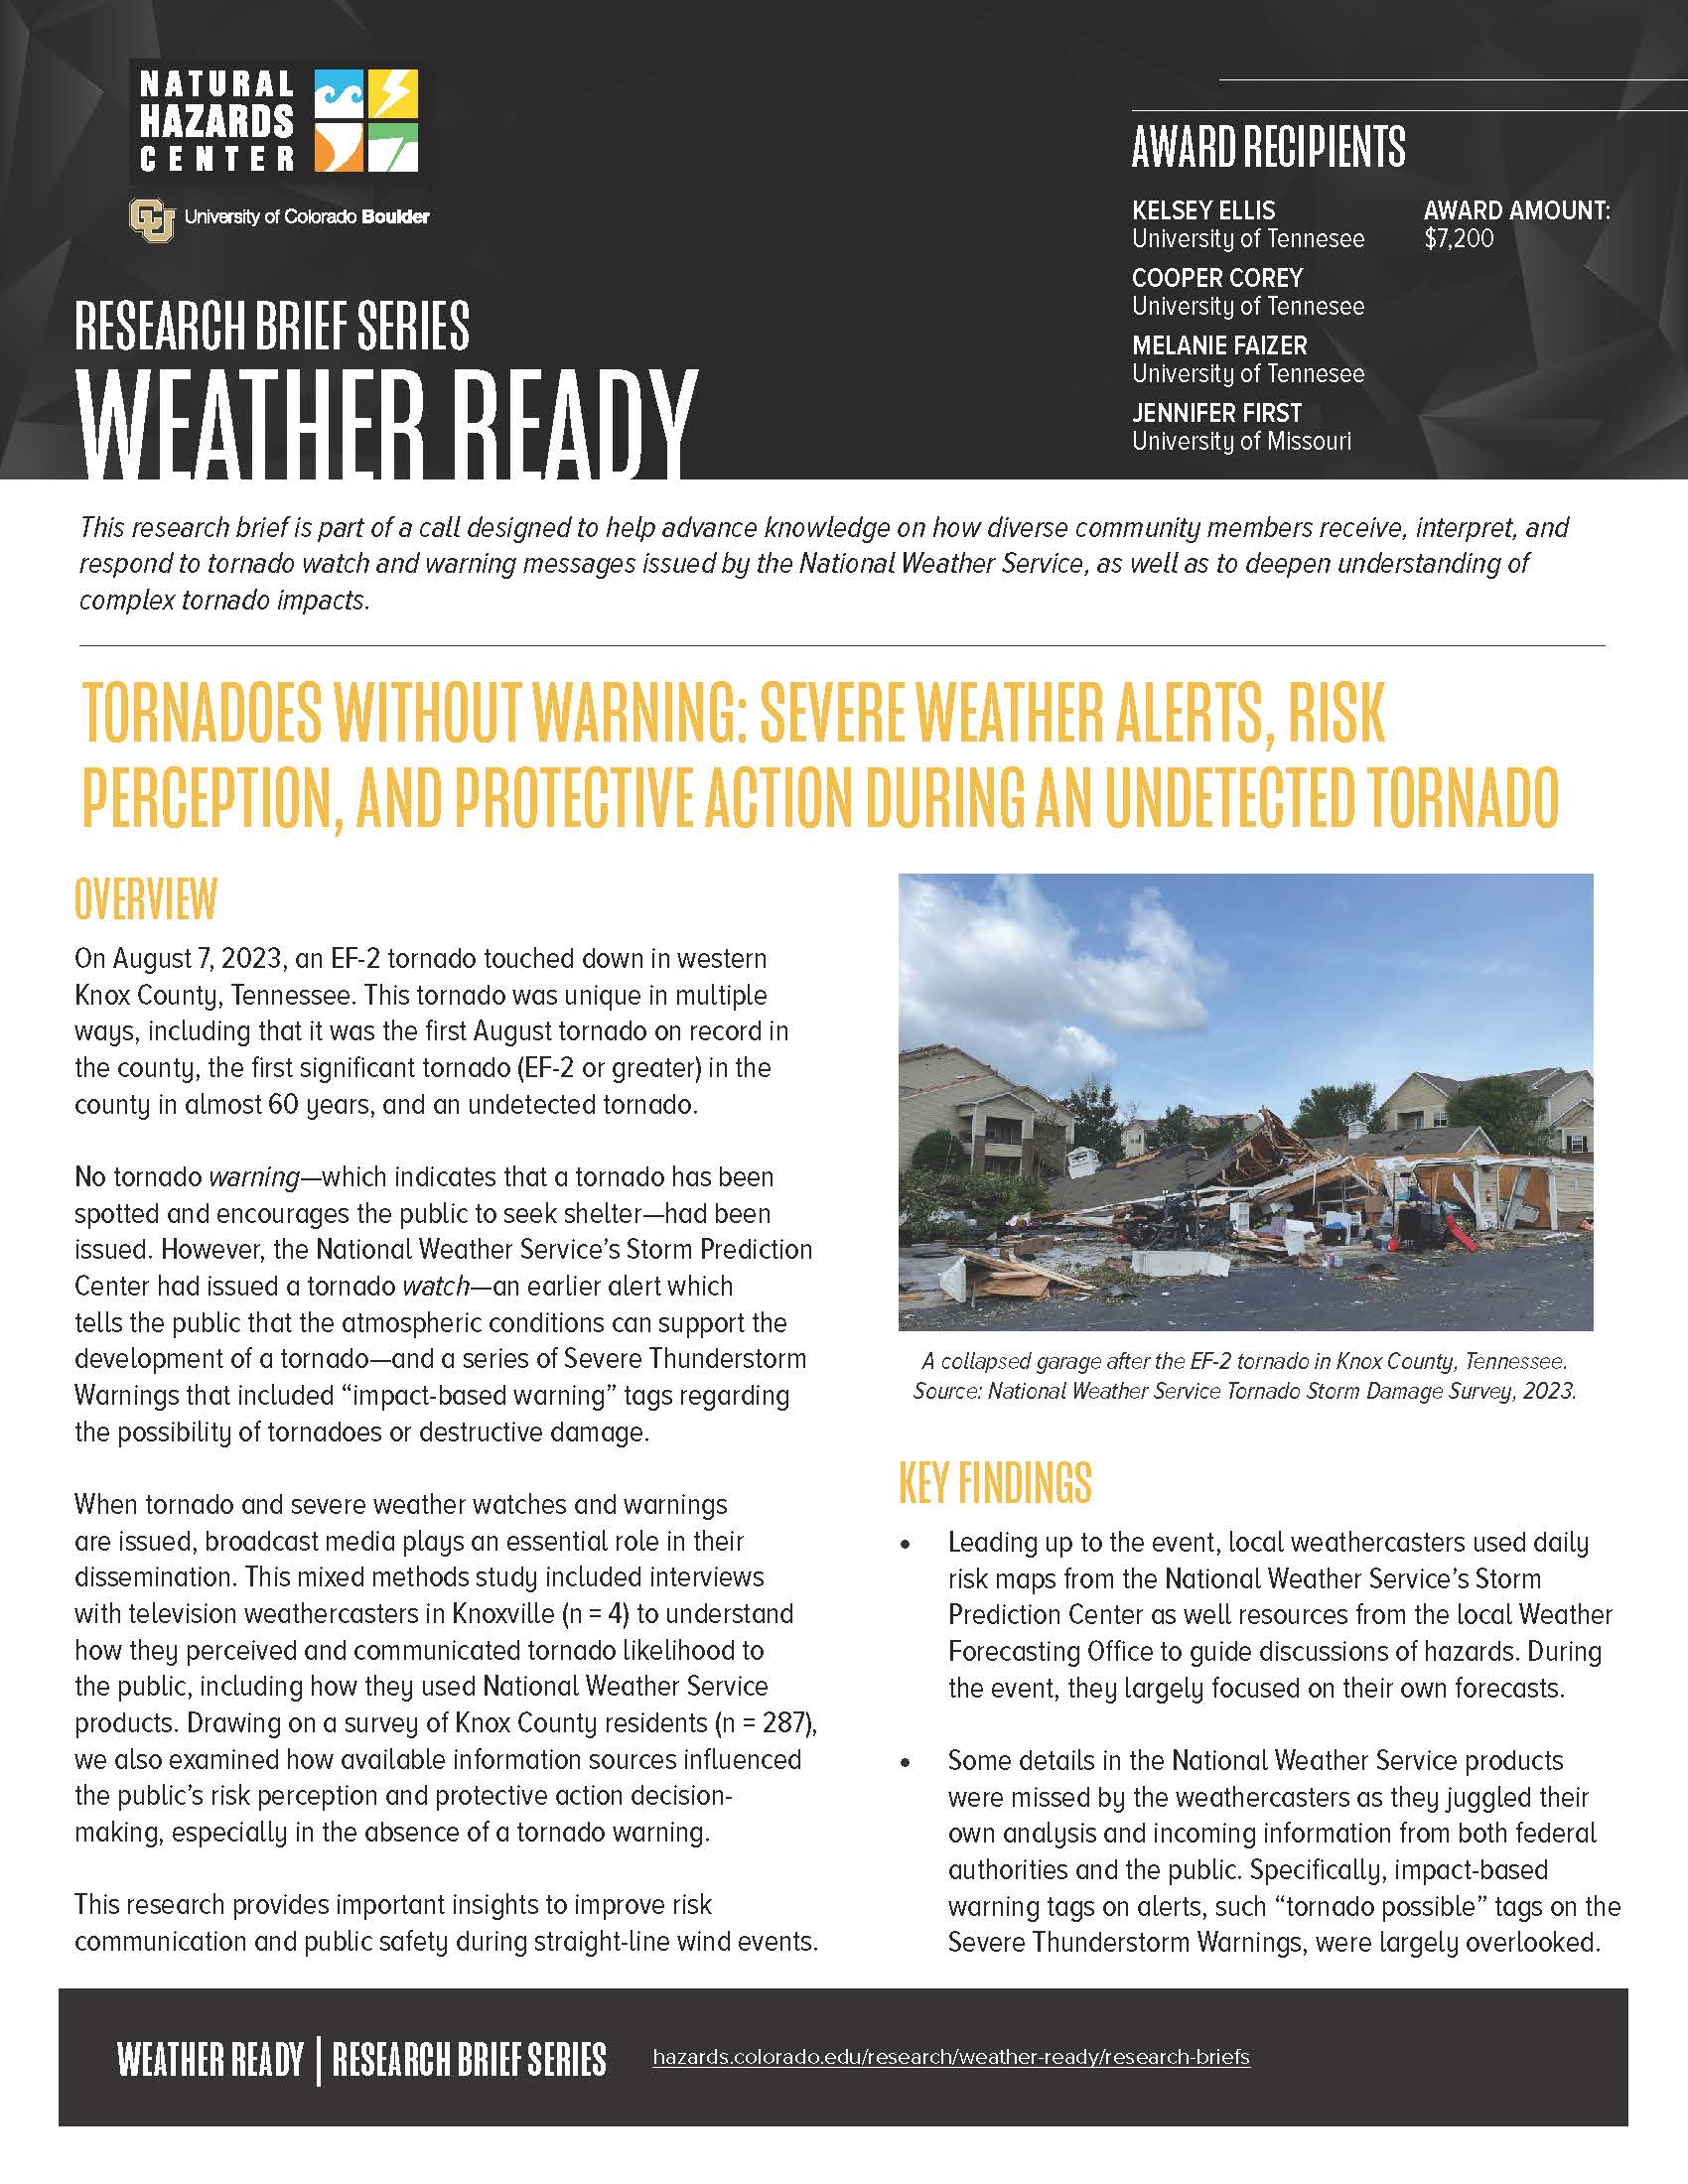
On August 7, 2023, an EF-2 tornado touched down in western Knox County, Tennessee. No tornado warning—which indicates that a tornado has been spotted and encourages the public to seek shelter—had been issued. However, the Storm Prediction Center had issued a tornado watch—an earlier alert which tells the public that the atmospheric conditions can support the development of a tornado—and a series of severe thunderstorm warnings (STW) with the possibility of tornadoes or destructive damage. Our research sought to understand how weathercasters and the public perceived the likelihood of a tornado event in the absence of a tornado warning. We examined how risk was communicated and actions taken based on perceptions of the communicated risk. We used mixed methods to assess the implementation and effectiveness of the tornado watch and severe storm alerts. Six themes emerged from interviews with four weathercasters: use of National Oceanic and Atmospheric Administration (NOAA) products; a desire for more in-depth discussion with National Weather Service forecasters during events; ways that in-house analysis and past experience guide their forecasts; a need to balance multiple threats and protective actions during broadcasts; and a lack of public response to STWs. We also conducted a survey of Knox County residents (N = 287). Survey results suggested the STW was received by more people than the tornado watch, likely due to the destructive damage tag that prompted a wireless emergency alert. Data suggested the “tornado possible” tag added on the STW has little influence on the public’s tornado risk perception. This work contributes to discussions of how impact-based warnings affect hazard perceptions and provides the local Weather Forecast Office information about how their products were used during a significant event.
Introduction
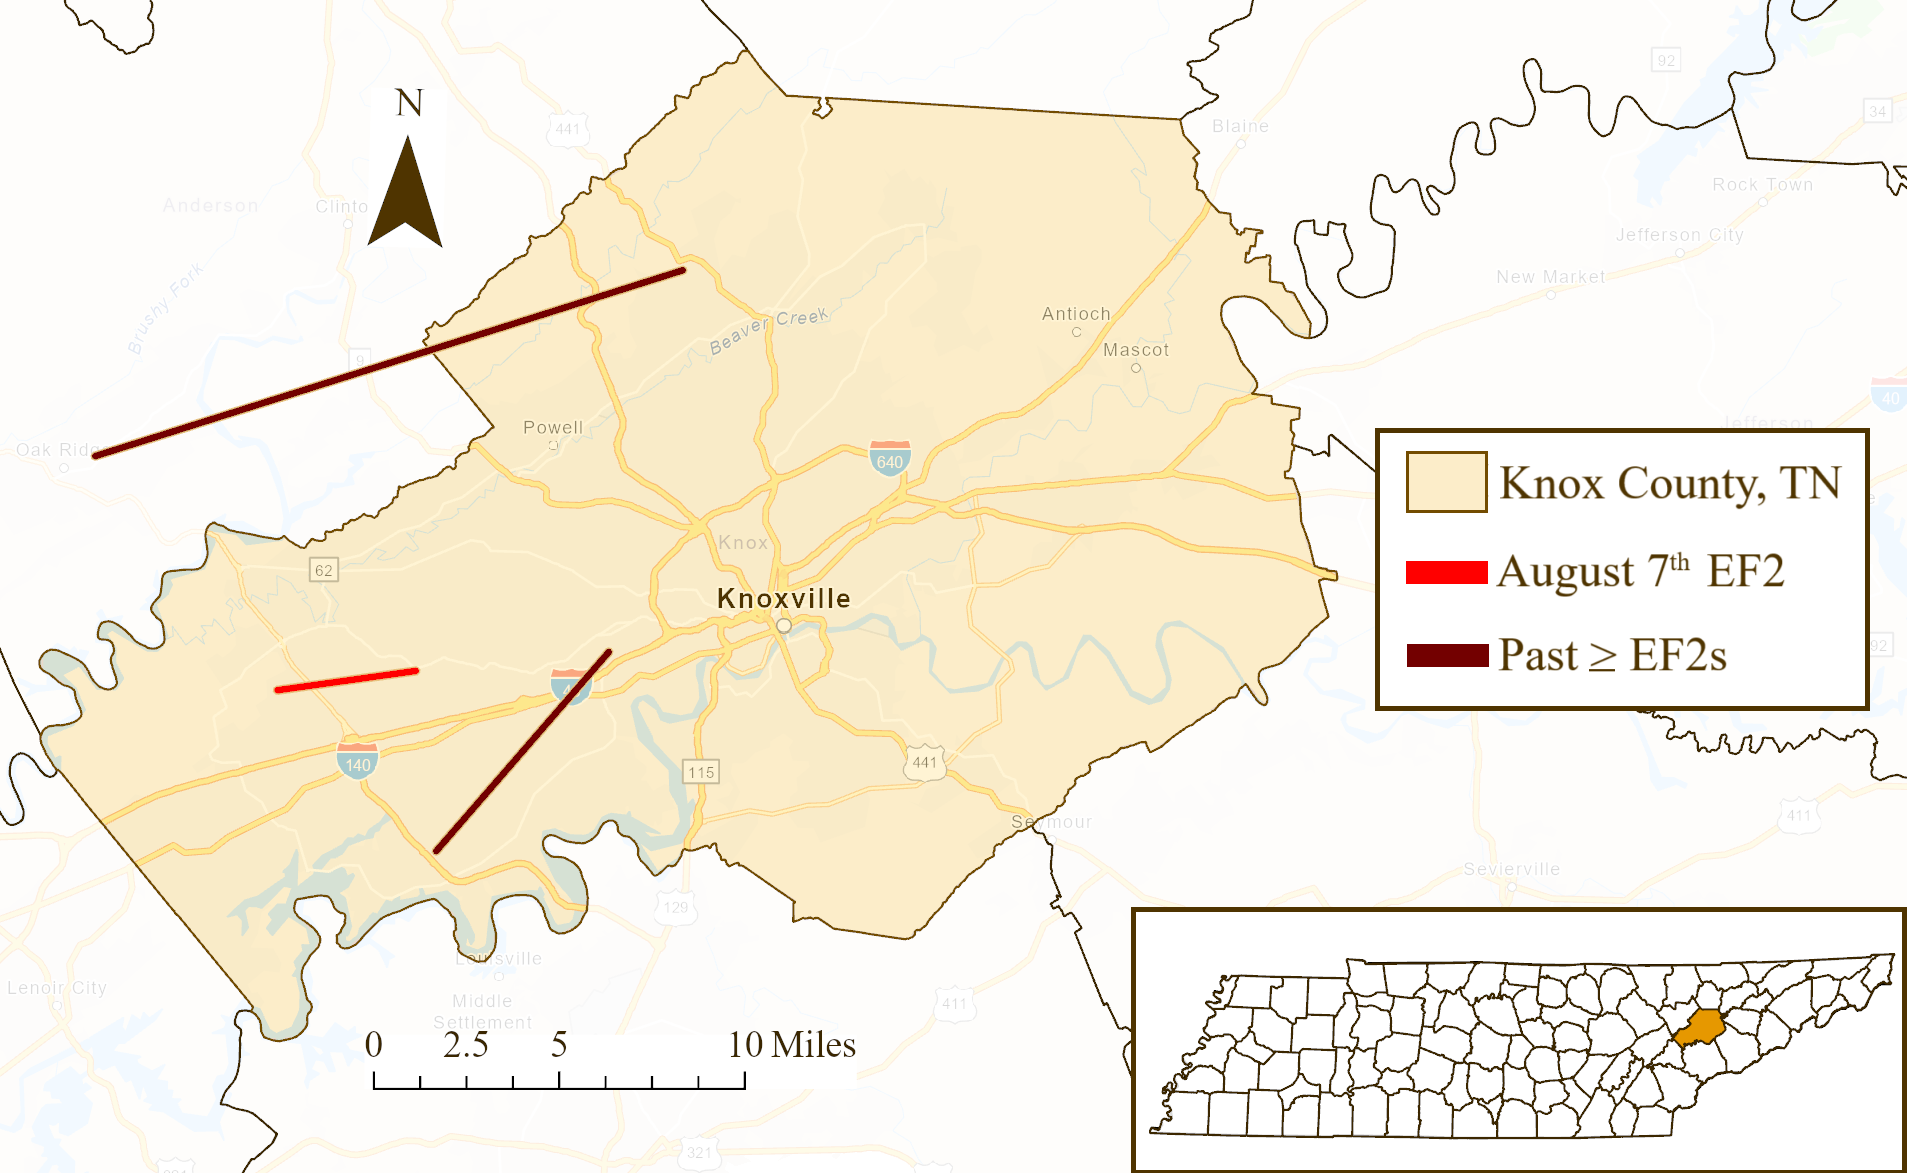
On August 7, 2023, an Enhanced Fujita 2 (EF-2) tornado tracked through Knox County, Tennessee, just west of Knoxville. Figure 1 shows the tornado touched down in the Hardin Valley suburb at 2:17 p.m. Eastern Daylight Time (EDT), traveling northeast for 3.8 miles before dissipating at 2:23 p.m. EDT (National Weather Service [NWS], 20231). The tornado peaked in intensity in the Lovell Crossing subdivision and was located directly over the Lovell Crossing Apartments. Fortunately, no injuries or fatalities were reported, although approximately 400 occupants were displaced (Connors, 20232). This tornado was unique in multiple ways, including being (a) the first August tornado on record in the county, (b) the first significant tornado (EF-2 or greater) in the county in almost 60 years, and (c) an undetected tornado.
Figure 1. Tracks of the August 7 Tornado and Other Significant Tornadoes in Knox County, Tennessee
The Storm Prediction Center (SPC) issued a tornado watch for the affected area, active between 11:20 a.m. and 7:00 p.m. EDT. No tornado warning was issued. After the watch was released on the SPC webpage and through private chat with weather enterprise partners, it was also shared by the local weather service office, local news, and emergency officials. During the watch period, a Quasi-Linear Convective System (QLCS) traveled through Knox County. A QLCS is a bowing line segment of storms that often causes widespread straight-line wind damage, and more rarely a tornado, which is typically weak. This QLCS behaved as expected, causing one tornado and county-wide severe wind damage, though the tornado was significant (EF-2). As the system traveled through the county, the Morristown National Weather Service (NWS) Weather Forecasting Office (WFO) issued a series of Severe Thunderstorm Warnings (STWs), two of which had impact-based warning tags on the bottom that described risk in more detail, including a “tornado possible” tag and a “destructive damage” tag. These warnings were shared by local news and emergency officials, and the warning with the destructive damage tag was shared through a wireless emergency alert (WEA). Thus, the tornado threat was communicated in several ways, even if no tornado warning was issued. The goal of this study was to examine how local weathercasters perceived and communicated tornado likelihood to the public that day, and how available information sources influenced the public’s risk perception of a tornado and protective action decision-making.
Literature Review
Tornado Watches
During a severe weather event with tornado potential, the first alert received by the public is typically a tornado watch. Issued by the SPC prior to an event, a watch means that the atmospheric conditions can support the development of a tornado. During a tornado watch, the public is encouraged to remain vigilant for potential tornadoes for the duration that the alert is issued. Previous research in Tennessee has found that, upon receiving a tornado watch alert during a hypothetical scenario, respondents were likely to seek out additional information, with television and radio being the most popular sources for that purpose (Burow et al., 20233). Similarly, in another study, respondents altered their hypothetical plans for that day when given a tornado watch alert (Gutter et al., 20184). Little else is known about actions taken by the public during the watch phase, or how tornado watch alerts modify behavior during severe weather events.
Tornadoes Without Warning
When storms are active in an area, the local NWS WFO may issue a tornado warning. A tornado warning indicates that a tornado has been spotted or radar-detected, and the public is encouraged to shelter. There has been a lot of research on tornado warnings, including, for example, barriers to receiving them (Mason et al., 20185; Walters et al., 20206) and actions taken once they are received (Sherman-Morris, 20107; Walters et al., 20198), but that is beyond the focus of this work.
As Table 1 shows, there are four possible outcomes of a tornado warning decision based on whether the WFO decided to issue a warning and whether a tornado was detected (Trainor et al., 20159). Relevant to the research presented here are “missed tornadoes” that go undetected (i.e., a tornado was observed but no warning was issued). Although this ratio varies both spatially and temporally, approximately 25% of tornadoes occur undetected and without warning (Brotzge & Erickson, 201010). Most often when tornadoes go undetected, they are likely to be weak (smaller than EF2s) and/or nocturnal (Brotzge & Erickson, 2010), but the tornado for the current study was neither. A significant tornado like the one in Knox County is less likely to go undetected (Brotzge & Erickson, 2010). The Knox County tornado had several qualities that align it with other typically undetected tornadoes, including (a) it occurred in the southeastern United States, (b) it was the first tornado of the day (Brotzge & Erickson, 2010; Brotzge et al., 201111; Brotzge et al., 201312), and (c) it was spawned within a QLCS (Brotzge et al., 2013).
Table 1. Tornado Forecast Scenarios
Statistics that quantify detection success do so as a binary variable––whether a tornado warning was in place prior to a tornado occurring, or not. During severe weather events, the public receives other types of information that influence their perception of tornado likelihood. For instance, people may gather information from a tornado watch alert (Gutter et al., 2018); traditional and social media sources (Sherman-Morris, 200513); and/or environmental cues (Dewitt et al., 201514). Regardless, there is little understanding of how perception of tornado likelihood is shaped in the absence of a tornado warning during a severe weather event.
Information Sources and Risk Perception
While the public may access severe weather information directly from the NWS, they may also receive it through a third party—for example, a news broadcast, which may share the forecast or alerts verbatim, or their own predictions or interpretations of the products. WEAs, smartphone apps, and social media have become more popular in recent years as tools to communicate weather forecasts and receive warnings (Eachus & Keim, 201915), likely increasing the rate at which the public receives information, specifically from the NWS.
Still, many people seeking weather information are receiving NWS forecasts and alerts through less-regulated third parties—such as television and radio broadcasts—whose weathercasters or reporters interpret that information and potentially incorporate their own knowledge before disseminating it to the public. In Tennessee, for example, a previous study found 75% of Tennesseans used television to receive warnings (Mason et al., 2018). Another study found that viewers developed relationships with trusted local weathercasters during severe weather events (Sherman-Morris, 2005), and such trust has been attributed to an increased likelihood of people taking protective actions when advised (Losee & Joslyn, 201816; Sherman-Morris, 2005; Taylor et al., 201817). Thus, there is a need for understanding how risk presented by the NWS is interpreted and disseminated by the media, ultimately affecting tornado risk perceptions. It is important to note that there are many factors affecting risk perception and protective action decision-making during severe weather events in addition to specific information sources. Risk perception, for example, is often developed from one’s own experiences (Ellis et al., 201818) or lack thereof (Slovic et al., 201919), as well as environmental cues (Dewitt et al., 2015). Research has shown that risk perception helps shape protective action, but it is a complicated relationship affected by many other attributes of the social and natural environment (Slovic et al., 198720) and personal barriers (First & Lee, 202321).
Impact-Based Severe Thunderstorm Warning
During a severe weather event, an NWS WFO may issue an STW alert, which could also influence public perceptions of tornado likelihood in lieu of a tornado warning. Severe thunderstorms are capable of producing 1-inch hail and 58-mile-per-hour winds at their baseline and may also cause flooding or a tornado. Within an STW, there may be additional information about the severity of the storm and the hazards, made possible by the implementation of impact-based warnings (IBW) by the NWS (Hudson et al., 201522).
One aspect of IBWs are potential tags that communicate severity, including “considerable” and “destructive” tags for STWs that are expected to cause damage beyond the baseline. A destructive tag indicates the storm has the potential for 2.75-inch hail and/or 80 mph winds and triggers a WEA in the warning area. Alert recipients are advised to seek shelter, similar to what a tornado warning would communicate. The August 7 storm that produced the tornado in Knox County was labeled as destructive on the STW due to ongoing widespread, damaging winds, though this tag was added after the tornado had dissipated.
A severe thunderstorm may also include a “tornado possible” tag if a thunderstorm has a heightened potential to produce a tornado. Past interviews with NWS meteorologists revealed that the tag may be used in place of a tornado warning for messy convection storms where only a short-lived, weak tornado would be likely and straight-line winds are the larger threat (Ellis et al., 202023). A tornado possible tag was used on a watch just prior to the Knox County tornado on August 7, though it was not active at the time of the tornado.
Emergency managers have noted that IBWs were useful for understanding the urgency of an event; however, some believe they have limited functionality, as they do not provide information on forecast uncertainty, which is instead gained through direct conversation with local NWS WFOs (Galluppi et al., 201324). In a focus group, weathercasters stated that these tags provide vital information by demonstrating urgency and could potentially help them convey risk to the public (Harrison et al., 201425). Still, there is currently no assessment of how the “tornado possible” tag is used by weathercasters during an ongoing severe weather event. Previous research has shown that IBWs increase the likelihood of people taking protective actions relative to those warnings without them (Casteel, 201626; Ripberger et al., 201527). After a severe weather event in Texas, researchers found that similar tags for hail size and wind speed were helpful for protective-action decision-making among residents (Johnson et al., 201428). However, there is currently no assessment of how the “tornado possible” tag impacts the public's perception of tornado potential.
Research Questions
While there is some knowledge on IBWs impacting the likelihood of people taking protective actions (Casteel, 2016; Ripberger et al., 2015) and potentially aiding NWS core partners in decision-making (Galluppi et al., 2013; Harrison et al., 2014), there has been no work to date on the use of the “tornado possible” tag in an actual severe weather event. There is also little to no information on how the public develops their perception of tornado risk outside of a tornado warning. The current work has contributed to our knowledge in those specific areas by answering three research questions about the August 7 tornado in Knox County:
- How did the weathercasters perceive and present tornado likelihood?
- Did NWS alerts affect public perception of tornado likelihood?
- How did perceptions of tornado likelihood relate to actions taken during the event?
Our hypotheses were:
- Hypothesis 1: The weathercasters relied heavily on NWS products during the event to determine what risks to communicate to their viewers.
- Hypothesis 2: After receiving the NWS alerts, participants believed a tornado was at least somewhat likely.
- Hypothesis 3: The belief that a tornado was likely was positively related to preparatory and protective action decision-making.
Research Design
We used a mixed-methods approach to gather information from weathercasters and the public about their experiences during the event. Interviews with four weathercasters provided an in-depth view of their experiences, and a survey of 287 Knox County residents provided a sample of public experiences from which we can infer the factors that influence perception of tornado likelihood and preparatory and protective action decision-making.
Study Site
Knoxville, Tennessee, is approximately 104 square miles, with an estimated population of 195,889 (U.S. Census Bureau, n.d.29). The city’s enveloping county, Knox County, had experienced a total of 14 tornadoes (EF0–EF5) between 1950 and 2022 (National Centers for Environmental Information, n.d.30). Of these, there had been only two significant tornadoes, one EF2 in 1965 and one EF3 in 1993, with only the former passing through Knoxville’s current city limits. This same record shows that the two most recent tornadoes in the county were both EF0s in March 2012. Because of this, it is likely that many long-term Knoxville locals had no experience with a significant tornado. To help improve local understanding of risk from tornadoes and high winds, and the products used by the NWS, we produced and aired a story on the local National Public Radio station (Faizer, 202331). In the story, we described the event, discussed our early findings, and interviewed members of the public about their experiences during the storm.
Human subjects approval was gained through the University of Tennessee Institutional Review Board (UTK IRB-23-07717-XM), supporting interviews of weathercasters and a public survey.
Interviews
Interview Sample and Guide
Weathercasters from the three television stations in Knoxville were invited to be interviewed for the study, and representatives from two of the stations participated. A willing weathercaster at the third station was unable to get permission from their news director. A group of three weathercasters from one station participated in a single virtual interview on September 5, 2023. One weathercaster from the other Knoxville station was interviewed virtually on September 6, 2023. Three of the authors were present for the interviews and asked open-ended questions based on an interview guide. The interviewers were a graduate student and faculty member in Geography and a faculty member in Communications at the University of Tennessee. Interviewees were first asked about their perceptions and communication of severe weather threats in the days leading up to the event and while the storm was moving through East Tennessee. Participants signed a consent form allowing the interviews to be recorded and transcribed and for the results to be shared anonymously. The interviews lasted 30–40 minutes and participants were not compensated for their time.
Interview Analysis
We used Braun and Clarke’s (200632) six-step process to code the data and uncover themes, which starts with becoming familiar with the data and moves to generating codes, combining codes into themes, reviewing themes, defining significant themes, and reporting findings. We used an inductive thematic analysis approach (Kiger & Varpio, 202033), which allowed the themes to be developed by the data instead of the data being pulled into specific pre-determined themes. For example, though we originally expected to provide feedback about specific NWS products, the weathercasters told stories that demonstrated the use of other information to develop their perceptions, which were included in the analysis.
Survey
Survey Measures
To answer research questions 2 and 3, we designed an internet survey using Qualtrics for adults living in Knox County who were present for the EF2 tornado on August 7, 2023. We advertised the survey using Facebook and flyers. Participants provided informed consent and were invited to enter a drawing to win one of ten $100 gift cards. The survey was an expanded version of the NOAA Tornado Post Event Survey (Natural Hazards Center, n.d.34), replacing tornado warning questions with STW questions since no tornado warning was issued that day (Ellis et al., 202435). All questions were Likert scale or other multiple choice-style questions, with one open-ended question at the end to allow participants to provide concluding thoughts. The survey was open from August 25 through September 15, 2023. It was imperative for the human-derived data to be collected shortly after the tornado so finer details could be recounted by the survey participants.
For this report, we present our preliminary analyses focused on questions pertaining to receiving a tornado watch and thunderstorm warning, perceptions of tornado likelihood, and preparatory and protective actions taken. We used the survey responses to obtain the following variables:
- Alert reception. A binary response (yes/no) to whether participants recall receiving the tornado watch and STW. Those selecting “I don’t recall” were excluded from the study.
- Tornado hazard perception. A follow-up question to respondents who received each alert asked them how likely they believed tornadoes were that day after receiving the alert. Due to a small sample of respondents believing tornadoes were extremely likely, we combined the four categories to form a “tornado likely” group, which included those who believed tornadoes were extremely likely or somewhat likely, and a “tornado unlikely” group, which included those who believed tornadoes were unlikely or extremely unlikely, making this a binary variable.
- Preparatory and protective actions taken. A second follow-up question asked respondents what they did upon receiving the alert. We used these data to create a binary variable—if the participant took action—and a continuous variable noting the total number of actions taken. The action options differed for the tornado watch and the tornado warning, per the NOAA post-tornado survey (see Table 2 for potential survey responses). Responses where participants selected “I don’t recall” were excluded from the relevant statistical tests. Open-ended responses were manually categorized in Excel and added to the binary and continuous variables if appropriate. For example, if a participant with no other selected options responded with “closed my windows,” this counted as taking action for the binary variable, or one action taken for the continuous variable.
Table 2. Survey Response Options for Actions Taken After Receiving an Alert
| What did you do upon getting the Tornado Watch? | |
|---|---|
| (1) | Checked emergency supplies |
| (2) | Bought emergency supplies |
| (3) | Made sure NOAA radio was on and charged/plugged in |
| (4) | Had local TV news/weather on |
| (5) | Had local radio news/weather on |
| (6) | Checked my weather app on my phone frequently (NOAA weather radar, etc.) |
| (7) | Called friends and family nearby to warn them |
| (8) | Sought information on tornado safety |
| (9) | Something else |
| (10) | I don’t recall |
| What did you do upon getting the Thunderstorm Warning? | |
| (1) | Nothing; continued my daily activities |
| (2) | Monitored the situation |
| (3) | Sheltered in my location |
| (4) | Left my location to shelter somewhere safer |
| (5) | Stopped driving and pulled over |
| (6) | Something else |
| (7) | I don't recall |
Survey Sample
After removing incomplete responses and those from suspected bots, which were identified based on a being located far away from the study site and/or answers not making sense, we had a sample of 287 Knox County residents. Table 3 provides select demographic characteristics of the survey sample. It shows that participants were largely young and middle-aged women.
Table 3. Select Demographic Characteristics of Survey Participants
| Gender | |||
| Age | |||
Survey Analysis
We analyzed survey responses using descriptive and inferential statistics. We used descriptive statistics to determine the number and percentage of participants who thought a tornado was likely upon receiving the tornado watch or thunderstorm warning, addressing research question 2. For research question 3, we used logistic regression to determine if perceived tornado likelihood (two categories) impacted whether participants took action upon receiving an alert. Additionally, Mann-Whitney U tests, which compare mean differences between two groups of ordinal data, informed whether the number of actions taken was impacted by perceived tornado likelihood (two categories), and the differences in central tendency helped inform the results.
Results
Weathercaster Forecast and Communication Strategies
We uncovered six themes in our weathercaster interviews:
- NOAA products supplemented in-house analysis: Leading up to the event, weathercasters used daily risk maps from the SPC known as Convective Outlooks and slides shared by the local WFO to guide discussions of hazard types. During the event, they largely focused on their own forecasts. One weathercaster could not recall if the WFO held a mid-morning discussion, saying, “At that point, we don't rely on their forecast...we make our own, but we do collaborate.” As the storm moved through, weathercasters worked in teams analyzing the event. One said, “Whenever one of us wasn't talking, we were all communicating with one another that there were areas of rotation.” One of the weathercasters noticed the NWS used the “tornado possible” tag and said, “They saw the same rotation we did.” When the local NWS office issued an alert, they shared it immediately.
- A need for the NWS to intentionally discuss products: Some details in the NWS products were missed by the weathercasters as they juggled their own analysis, wall-to-wall coverage, and incoming information from the NWS and the public. For example, only one of the weathercasters could recall NWS use of the “tornado possible” tag, with another saying, “I think it’s really easy to miss [the tag] in the heat of the moment.” They thought they may have caught these details if they were discussed explicitly in NWS Chat, a product where the NWS discusses their forecasts privately with their partners, rather than only being contained in the warnings. All of the weathercasters recalled the “destructive” tag that activated the WEA.
- Past experiences influence perceptions: Several weathercasters spoke of past events, demonstrating their use of accumulated knowledge and experiences when interpreting tornado risk. One commented that severe weather in East Tennessee can happen any time of year, saying of an August tornado: “Here in East Tennessee, that wouldn't surprise me.” Their past experiences also affected how they communicated risk, including their autonomy to assess the situation and identify unwarned tornadoes on air.
- Balancing multiple hazards: Leading up to the event, communications from the SPC and weathercasters included a heavy emphasis on the wind threat; the day before the event, however, both stations mentioned “all hazards were possible.” Damaging winds were still their “biggest concern” because the wind threat was “widespread, [not] localized.” Both stations issued their own specific product to denote that the public should remain aware of weather conditions, for example, calling it a “First Alert Weather Day.” To have people prepare for the midday storms, they recommended having multiple ways to get alerts, making sure their phone is not on “Do Not Disturb,” and considering using a NOAA Weather Radio. They reminded viewers that they were under a tornado watch and that ingredients were present for tornadoes. As the event unfolded, the weathercasters tried “to treat every threat individually at the moment.”
- Sharing forecasts through several media: During the event, the weathercasters were “wall-to-wall,” providing continuous coverage. They shared NWS alerts on air and automatically pushed them through their station weather app and social media pages. The intent of these push notifications was to alert the public and say, “‘Hey, you can tune into [our station] news,’ because at that point we were live streaming it.” Digital live streams were also wall-to-wall, so viewers could get updates using their cell phone signal if they lost power.
- Lack of public response to STWs: The weathercasters communicated the severity of the severe thunderstorm, but they recognized viewers would likely not shelter without a strong tornado threat: “If our tornado threat is low, even if we have a high threat for winds, people aren't as proactive...in their preparations.” One weathercaster said that “People won't take it as seriously,” calling it “just a STW.” But inside the station, they felt differently, noting that they “take STWs and tornado warnings both equally as seriously, because they can both do the same amount of damage.”
Public Receipt and Perceptions of Alerts
Table 4 shows how many survey participants received the NWS alerts and their level of belief in the likelihood of a tornado after they received it. Approximately half of the respondents (56%) recalled receiving the tornado watch, 82% of whom believed a tornado was unlikely. More respondents (85%) said that they received the STW. However, 87% of them said that they thought a tornado was unlikely.
Table 4. Survey Results: Public Receipt and Perception of Weather Alerts
| Did you receive a Tornado Watch? | Yes | ||
| No | |||
| I don't recall | |||
| Did you receive a Thunderstorm Warning? |
Yes | ||
| No | |||
| I don't recall | |||
| Upon receiving the Tornado Watch, how likely did you believe a tornado was in Knoxville, TN?a |
Extremely likely | ||
| Somewhat likely | |||
| Unlikely | |||
| Extremely unlikely | |||
| Upon receiving the Thunderstorm Warning, how likely did you think a tornado was?b |
Extremely likely | ||
| Somewhat likely | |||
| Unlikely | |||
| Extremely unlikely |
Impact of Alerts and Perceptions on Preparatory and Protective Actions
Logistic regression results suggest that the binary variable for tornado likelihood perception did not impact whether a respondent took any protective action after the watch or warning (α < 0.05. Results are available in Table 5.
Table 5. Logistic Regression Results: Probability of Taking Protective Action Among Those Who Perceived Tornadoes as Likely
| Tornado watch | Intercept | ||||
| Action taken (yes) | |||||
| Severe storm warning | Intercept | ||||
| Action taken (yes) |
In contrast, Mann-Whitney U tests suggest a relationship between the total number of actions taken and perceived tornado likelihood (α < 0.001). Among residents, those who received an alert and perceived a tornado as likely took more protective actions than those who did not expect a tornado. Table 6 shows the mean and median number of actions taken by residents by the type of alert they received and their perception of tornado likelihood.
Table 6. Mean and Median Number of Protective Actions Taken by Respondents
| Tornado watch | Extremely likely | ||
| Somewhat likely | |||
| Unlikely | |||
| Extremely unlikely | |||
| Severe storm warning | Extremely likely | ||
| Somewhat likely | |||
| Unlikely | |||
| Extremely unlikely | |||
| All responses | Watch phase | ||
| Warning phase | |||
Discussion
Weathercaster Perceptions and Communication
When tornado and severe weather watches and warnings are issued, broadcast media is an essential node in their dissemination, sharing the alerts through their broadcasts, cut-ins, crawlers, apps, social media, and more (Coleman et al., 201136). The weathercasters we interviewed were no exception to this, and they were certain to share all NWS alerts through multiple media. Past work has shown that media not only disseminate the warning information they receive, but also add their own interpretations (Morss et al., 201537). Similarly, the weathercasters we interviewed demonstrated autonomy over their forecasts and presentations of risk. It is important to note that many of these weathercasters are trained scientists doing their own weather analysis and with a wealth of experience that impacts how they perceive and communicate risk.
Our study is the first to our knowledge to assess how IBWs, specifically tags on STWs, were understood and used by weathercasters in a real-life situation. Our interviews with weathercasters suggest the tags provided vital uncertainty information for them to convey to the public (Harrison et al., 2014). However, our work demonstrates that these tags can be missed during the chaos of an unfolding severe weather event if they are not deliberately pointed out to the broadcasters. Perhaps our most useful finding is that if the NWS would like weathercasters to see and communicate the tag, they need to highlight the tag in NWS Chat. The weathercasters we interviewed recognized that the public does not take warnings seriously if tornadoes are not explicitly stated as possible. While this is problematic for severe wind events without tornado potential, when a tornado is possible, the tag could potentially increase protective action seeking if deliberately discussed in broadcasts.
Public Perceptions and Actions Taken
Little research has focused on how a tornado watch affects public perceptions or actions. Our work suggests that watches are not as frequently received as warnings, and when they are received, they may not influence risk perception, as few of the survey respondents who received the watch or warning believed tornadoes were likely that day. Only 14 stated that they thought a tornado was likely because the STW stated one might be possible, meaning the IBW tag was not seen or believed by most people who received the warning. Interestingly, though perceptions of tornado likelihood were low, nearly half of the respondents who received the watch still sought more weather information throughout the day, supporting findings from previous studies that found that respondents were more likely to seek out more information and cancel their plans after receiving a tornado watch in a hypothetical scenario (Burow et al., 2023; Gutter et al. 2018). That said, the survey did not include an option for “did nothing” after the watch was received, which may have been selected by participants not believing a tornado was possible that day. Instead, some participants selected “other” and then listed that they did nothing.
In a previous study, 75% of Tennesseans listed using television and 53% using commercial radio for hazard information (Mason et al., 2018). However, only 3–4% of respondents said they received NWS alerts from a weather radio or radio broadcast and only 6–7% of received one from a television broadcast. Instead, the largest portion of respondents listed automated text or phone notifications as being their source of receiving the NWS tornado watch (36%) and STW (39%). This supports the idea that the public has become more reliant on wireless emergency alerts, smartphone applications, and social media in recent years (Eachus & Keim, 2019).
While belief in whether a tornado was possible did not significantly affect whether a respondent chose to act, it did affect how many actions a respondent took. Overall, it appears that, while the alerts had limited influence over public perception of tornado likelihood, people who did believe a tornado was possible were more likely to take a series of preparatory or protective actions after each alert. Indeed, when responding to hazardous weather alerts, most responsive people take several protective actions (Walters et al., 2019). Thus, those who were influenced by the reception of either alert, or who otherwise believed there was potential for a tornado at that time, likely had a higher probability of taking appropriate action that day.
Conclusions
On August 7, 2023, Eastern Tennessee was hit by a series of severe thunderstorms accompanied with high straight-line winds and one unusually strong spin-up tornado that touched down in Knox County. The area was under an active tornado watch, and the tornadic cell did receive a destructive STW tag, but no tornado warning was issued. We used mixed methods to examine how local weathercasters perceived and communicated tornado likelihood, and how the public responded to alerts in lieu of a tornado warning. We hypothesized that the weathercasters relied heavily on NWS products during the event to determine what risks to communicate to their viewers; participants would believe a tornado was at least somewhat likely after receiving NWS alerts; and that perceptions of tornado likelihood would impact preparatory and protective actions. We concluded that weathercasters used NOAA products leading up to and during the event but also relied on their own analysis and past experiences. Many participants did not believe a tornado was likely after receiving the alerts, though if they did, it increased the number of preparatory and protective actions that they took.
Implications for Practice or Policy
This work provides feedback to the NWS on IBWs, specifically detailing how they are used by some members of the media. It is clear that tags used in warnings can be missed and should be highlighted in NWS Chat. Overall, weathercasters would like to have deeper discussions with the WFO during events. We have presented this work to meteorologists from the local NWS office to inform their practice.
Limitations
While nearly 300 people responded to this survey, the responses were limited in the range of demographics represented. This case study, itself, is also limited to the impacts of a single tornado in one city, also limiting demographic diversity. It will be imperative for research to continue examining future similar events to develop a broader understanding of how people perceive tornado risk in lieu of a tornado warning. Similarly, the weathercasters may not represent the breadth of weathercaster experiences across the country; however, this group presents approximately a third of the full-time weathercasters in Knoxville, providing a representative sample for the local WFO.
Additionally, though data were rapidly collected, some weathercasters may have forgotten some details of the event, so supplementing interviews with analysis of broadcasts could provide more reliable information.
Future Research Directions
Additional case studies could be useful to sample other weathercasters and publics to determine how representative our findings are of a broader population. Additional work into responses to STWs, especially those with IBW tags, is an essential first step for improving public safety during straight-line wind events.
Author Acknowledgments. We acknowledge the local weathercasters who participated in the interviews and the NPR-affiliate story. We also acknowledge undergraduate student Emma Collard for helping identify bots in the survey responses.
References
-
National Weather Service. (2023, October 22). Event summary: August 7th high-end damaging winds and Knox County EF-2. U.S. Department of Commerce, National Oceanic and Atmospheric Administration. https://www.weather.gov/mrx/August_7_Tornado_Wind ↩
-
Connors, R. (2023, August 24). People searching for new places to live as Lovell Crossing Apartments ends leases due to tornado damage. WBIR-TV 10 News. https://www.wbir.com/article/life/lovell-crossing-tornado-damage-move-out-leases-end/51-8570718c-19a5-4f24-95e7-2ddea3b52c58 ↩
-
Burow, D., Ellis, K., & First, J. (2023). Intended response to tornado watches among Tennessee residents. Weather, Climate, and Society, 15(1), 59–73. ↩
-
Gutter, B. F., Sherman-Morris, K., & Brown, M. E. (2018). Severe weather watches and risk perception in a hypothetical decision experiment. Weather, Climate, and Society, 10(4), 613–623. ↩
-
Mason, L. R., Ellis, K. N., Winchester, B., & Schexnayder, S. (2018). Tornado warnings at night: Who gets the message? Weather, Climate, and Society, 10(3), 561–568. ↩
-
Walters, J. E., Mason, L. R., Ellis, K., & Winchester, B. (2020). Staying safe in a tornado: A qualitative inquiry into public knowledge, access, and response to tornado warnings. Weather and Forecasting, 35(1), 67–81. ↩
-
Sherman-Morris, K. (2010). Tornado warning dissemination and response at a university campus. Natural Hazards, 52(3), 623–638. ↩
-
Walters, J. E., Mason, L. R., & Ellis, K. N. (2019). Examining patterns of intended response to tornado warnings among residents of Tennessee, United States, through a latent class analysis approach. International Journal of Disaster Risk Reduction, 34, 375–386. ↩
-
Trainor, J. E., Nagele, D., Philips, B., & Scott, B. (2015). Tornadoes, social science, and the false alarm effect. Weather, Climate, and Society, 7(4), 333–352. https://doi.org/10.1175/WCAS-D-14-00052.1 ↩
-
Brotzge, J., & Erickson, S. (2010). Tornadoes without NWS warning. Weather and Forecasting, 25(1), 159–172. ↩
-
Brotzge, J., Erickson, S., & Brooks, H. (2011). A 5-yr climatology of tornado false alarms. Weather and Forecasting, 26(4), 534–544. ↩
-
Brotzge, J. A., Nelson, S. E., Thompson, R. L., & Smith, B. T. (2013). Tornado probability of detection and lead time as a function of convective mode and environmental parameters. Weather and Forecasting, 28(5), 1261–1276. ↩
-
Sherman-Morris, K. (2005). Tornadoes, television and trust—A closer look at the influence of the local weathercaster during severe weather. Global Environmental Change Part B: Environmental Hazards, 6(4), 201–210. ↩
-
Dewitt, B., Fischhoff, B., Davis, A., & Broomell, S. B. (2015). Environmental risk perception from visual cues: The psychophysics of tornado risk perception. Environmental Research Letters, 10(12), 124009. https://doi.org/10.1088/1748-9326/10/12/124009 ↩
-
Eachus, J. D., & Keim, B. D. (2019). A survey for weather communicators: Twitter and information channel preferences. Weather, Climate, and Society, 11(3), 595-607. ↩
-
Losee, J. E., & Joslyn, S. (2018). The need to trust: How features of the forecasted weather influence forecast trust. International Journal of Disaster Risk Reduction, 30, 95–104. https://doi.org/10.1016/j.ijdrr.2018.02.032 ↩
-
Taylor, A. L., Kox, T., & Johnston, D. (2018). Communicating high impact weather: Improving warnings and decision making processes. International Journal of Disaster Risk Reduction, 30(A), 1–4. https://doi.org/10.1016/j.ijdrr.2018.04.002 ↩
-
Ellis, K. N., Mason, L. R., Gassert, K. N., Elsner, J. B., & Fricker, T. (2018). Public perception of climatological tornado risk in Tennessee, USA. International Journal of Biometeorology, 62, 1557–1566. ↩
-
Slovic, P., Fischhoff, B., & Lichtenstein, S. (2019). Rating the risks: The structure of expert and lay perceptions. In C. Hohenemser & J. X. Kasperson (Eds.), Risk in the technological society (pp. 141–166). Routledge. ↩
-
Slovic, P., Fischhoff, B., & Lichtenstein, S. (1987). Behavioral decision theory perspectives on protective behavior. In N. D. Weinstein (Ed.), Taking care: Understanding and Encouraging Self-Protective Behavior, (pp. 14–41). Cambridge University Press. https://doi.org/10.1017/CBO9780511527760.003 ↩
-
First, J. M., & Lee, S. (2023). Examining factors influencing protective actions among persons with disabilities during the December 10–11, 2021, tornado outbreak in the United States. Disaster Medicine and Public Health Preparedness, 17, Article e474. https://doi.org/10.1017/dmp.2023.150 ↩
-
Hudson, M. J., Wagenmaker, R., Mann, G., Smith, B., Thompson, R., Ferree, J., & Entremont, C. (2015). Science that drives service: The NWS impact-based warning demonstration [Conference presentation abstract]. Third symposium on building a weather-ready nation: Enhancing our nation’s readiness, responsiveness, and resilience to high impact weather events, Phoenix, AZ, United States. https://ams.confex.com/ams/95Annual/webprogram/Paper260627.html ↩
-
Ellis, K. N., Burow, D., Gassert, K. N., Mason, L. R., & Porter, M. S. (2020). Forecaster perceptions and climatological analysis of the influence of convective mode on tornado climatology and warning success. Annals of the American Association of Geographers, 110(4), 1075–1094. ↩
-
Galluppi, K., Losego, J., & Montz, B. (2013). Evaluation of the effectiveness of the Central Region impact-based warning demonstration conducted by Weather for Emergency Management decision support. U.S. Department of Commerce, National Oceanic and Atmospheric Administration. https://repository.library.noaa.gov/view/noaa/28893 ↩
-
Harrison, J., McCoy, C., Bunting-Howard, K., Sorensen, H., Williams, K., & Ellis, C. (2014). Evaluation of the National Weather Service impact-based warning tool. U.S. Department of Commerce, National Oceanic and Atmospheric Administration. https://repository.library.noaa.gov/view/noaa/34646 ↩
-
Casteel, M. A. (2016). Communicating increased risk: An empirical investigation of the National Weather Service’s impact-based warnings. Weather, Climate, and Society, 8(3), 219–232. ↩
-
Ripberger, J. T., Silva, C. L., Jenkins-Smith, H. C., & James, M. (2015). The influence of consequence-based messages on public responses to tornado warnings. Bulletin of the American Meteorological Society, 96(4), 577–590. ↩
-
Johnson, M., Dunn, J., Guerrero, H., Lyons, S., Myers, L., & Brown, V. (2014). Public reaction to impact based warnings during an extreme hail event in Abilene, Texas [Conference presentation abstract]. 27th conference on severe local storms, Madison, WI, United States. https://ams.confex.com/ams/27SLS/webprogram/Paper254536.html ↩
-
U.S. Census Bureau. (n.d.). QuickFacts: Knoxville City, Tennessee [Population estimates]. U.S. Department of Commerce. Retrieved March 18, 2024, from https://www.census.gov/quickfacts/fact/table/knoxvillecitytennessee/PST045222 ↩
-
National Centers for Environmental Information. (n.d.). Historical records and patterns: U.S. tornadoes. U.S. Department of Commerce, National Oceanic and Atmospheric Administration. Retrieved January 30, 2026, from https://www.ncei.noaa.gov/access/monitoring/tornadoes/patterns ↩
-
Faizer, M. (2023, November 15). When extreme weather is a threat: How do forecasters communicate risk? WUOT. https://www.wuot.org/news/2023-11-15/when-extreme-weather-is-a-threat-how-do-forecasters-communicate-riskhttps://www.wuot.org/news/2023-11-15/when-extreme-weather-is-a-threat-how-do-forecasters-communicate-risk ↩
-
Braun, V., & Clarke, V. (2006). Using thematic analysis in psychology. Qualitative Research in Psychology, 3(2), 77–101. ↩
-
Kiger, M. E., & Varpio, L. (2020). Thematic analysis of qualitative data: AMEE Guide No. 131. Medical Teacher, 42(8), 846-854. ↩
-
Natural Hazards Center. (n.d.). NOAA tornado post-event survey: Special call: Tornado Ready Quick Response Research [Survey instrument]. Retrieved August 31, 2023, from https://hazards.colorado.edu/uploads/basicpage/NOAA%20Tornado%20Post-Event%20Survey_NHC.pdf ↩
-
Ellis, K., Corey, C., First, J., & Faizer, M. (2024). Survey of public experiences during unwarned tornado in Knox County, TN [Survey instrument]. In K. Ellis (PI), Risk perception and communication during an unwarned tornado in Knoxville, Tennessee [PRJ-4605, Version 2]. DesignSafe-CI. https://doi.org/10.17603/ds2-cgeg-vn47 ↩
-
Coleman, T. A., Knupp, K. R., Spann, J., Elliott, J. B., & Peters, B. E. (2011). The history (and future) of tornado warning dissemination in the United States. Bulletin of the American Meteorological Society, 92(5), 567–582. ↩
-
Morss, R. E., Demuth, J. L., Bostrom, A., Lazo, J. K., & Lazrus, H. (2015). Flash flood risks and warning decisions: A mental models study of forecasters, public officials, and media broadcasters in Boulder, Colorado. Risk Analysis, 35(11), 2009–2028. ↩
Ellis, K., Corey, C., Faizer, M., & First, J. (2026). Tornadoes Without Warning: Severe Weather Alerts, Risk Perception, and Protective Action During an Undetected Tornado. (Natural Hazards Center Weather Ready Research Report Series, Report 23). Natural Hazards Center, University of Colorado Boulder. https://hazards.colorado.edu/weather-ready-research/tornadoes-without-warning
Acknowledgments