Assessment of Nutritional Quality of Household Emergency Food Distribution Post Hurricane Maria in Puerto Rico
Publication Date: 2019
Abstract
Information on the types and nutritional quality of foods provided during disaster mass feedings is extremely limited. Such information is critical to improve the effectiveness of humanitarian actions and to understand how resiliency and emergency plans impact the health of communities and families coping with disasters. To evaluate food commodities distributed by federal response efforts, we assess the nutritional characteristics of foods distributed after Hurricane Maria in one central, rural, and mountainous municipality in Puerto Rico. We conducted structured observations and content analysis of photographs of commodities received in a food distribution center for 10 consecutive days after Hurricane Maria. Commodities were categorized according to U.S. Department of Agriculture (USDA) food groups, and percent daily values of sodium, saturated fats, and added sugars. Items that contributed 20 percent or more of the percent daily value (percent DV) for sodium, saturated fats, and added sugars per serving (for those items that had the added sugars information available), were deemed to be high on those nutrients. The percent DV is calculated based on the Dietary Reference Intakes (DRIs) from an intake of 2,000 calories per day. Fiber content per serving (<1g fiber per serving) was also noted. Of the unique items, more than half (58 percent) of unique foods were low in fiber (contained < 1g per serving); and 46 percent exceeded the upper limit recommendations for sodium, saturated fats, or added sugars. Specifically, 20 percent, 10 percent and 30 percent were high in sodium, saturated fat, and added sugars respectively (i.e. each serving contained >20 percent the upper limit recommendation for those nutrients). Eight percent of all unique foods listed the first ingredient as sugar/corn syrup, chocolate, salt or fat, suggesting that these foods were of very low nutritional value. This indicates that the types of foods received during the federal response effort should be improved in order to create the healthy eating patterns required by federal guidelines. In light of the current challenges posed to global food systems, it is critical to examine preparedness to meet community needs and ensure the health of families coping with disasters.
Introduction
In September 2017, the Caribbean was devastated by two powerful hurricanes—Irma and Maria. Before the hurricanes hit the Caribbean, Puerto Rico was already highly vulnerable to poverty and food insecurity, and suffering from high obesity, diabetes morbidity and mortality, and hypertension (Ho, Qian et al. 20061, Rivera-Soto, Rodriguez-Figueroa et al. 20102, (Allende-Vigo, Perez et al. 20133), Elias-Boneta, Toro et al. 20154, Facts 20165, World 20176)(Durazo-Arvizu, Barquera et al. 20067, Miranda, Herrera et al. 20138, Colon-Ramos, Rodriguez-Ayuso et al. 20169). Three months after the hurricane, more than 60 percent of the islands still lacked power, and the majority of their populations lacked access to potable water (Energy and Restoration 201710, Federal Emergency Management Agency 201711, Sacks 201712). Local food production was mostly destroyed (Robles and Ferre-Sarduni 201713), and the imported food supply system, on which the Caribbean depends heavily (85 percent in Puerto Rico and 97 percent in USVI) (U.S. Government Accountability Office 198214, Food and Agriculture Organization (FAO) Sub-Regional Office for the Caribbean 201115, Bellot 201716)) was also disrupted by the destruction to the islands’ infrastructure (e.g., roads, communications, systems, and the power grid). Emergency foods distributed during federal disaster relief efforts must follow the federal DGA according to the 1990 National Nutrition Monitoring Related Research Act (U.S. Department of Agriculture 201717). During a presidential disaster declaration after a major disaster, the Federal Emergency Management Agency (FEMA) and the U.S. Department of Agriculture (USDA) are supposed to work together, along with state and local governments, to support emergency food distribution. By design, personnel from the USDA Food and Nutrition Services (FNS)18 and nutritionists and dietitians from the USDA Center for Nutrition Policy and Promotion (CNPP) are supposed to align food choices for disaster mass feedings to meet Dietary Guidelines for Americans (DGA) (Abernathy 201519). The September 2017 revision of the USDA FNS Foods Program Disaster Manual states that food commodities provided to supplement disaster feeding efforts should make USDA foods available from the following five basic categories: grains; dairy; fruits; vegetables; and proteins from animals, nuts, and legumes. During federally-declared emergencies, state and local emergency management systems are supposed to coordinate with voluntary organizations to define feeding plans in their jurisdictions and establish a matrix for feeding projections based upon nutritional standards and the associated timeframe (National Mass Care Strategy 201520). Regardless of where foods originate, the U.S. federal response to food shortages is supposed to follow “strict nutritional guidelines” to make healthier food choices readily available to disaster victims (U.S. Department of Agriculture 2017) and to, for example, include reduced or no sodium, low-fat, low-sugar meals, and options for whole grains (National Mass Care Strategy 2015).
The U.S. government emergency and recovery efforts in the Disaster Household Distribution program were criticized for providing insufficient foods and foods of poor nutritional quality during their relief efforts to Puerto Rico (Dewey 201721, Macias 201722, Willoughly 201723). However, to date, no data has been available to confirm these assertions. Information on the types of food commodities provided in boxes to households during disaster mass feedings and their nutritional quality is extremely limited because foods may come from multiple and varied sources, including local inventories, distributing agency inventories, USDA food programs, national warehouses, or from Rapid Food Response States, depending on the needs of the disaster organization, the scale of the disaster or emergency, accessible inventories, and available funding (Abernathy 2015, U.S. Department of Agriculture 2017). Nonetheless, this information is critical to improve the effectiveness of these humanitarian actions and to understand how resiliency and emergency plans are also responding to the needs of communities and to the health of families coping with the disasters.
To fill in this data gap, we conducted a rapid assessment of the food relief after Hurricane Maria in Puerto Rico to answer the research question: How are the food commodities provided by FEMA filling the food chain disruption in vulnerable communities in Puerto Rico? Specifically, we:
Aim 1) Documented the food chain disruption in vulnerable communities in Puerto Rico (available foods and their prices in food venues).
Aim 2) Documented the nutritional characteristics of food commodities distributed to assess the alignment of nutritional standards and emergency foods received after Hurricane Maria.
Methods
Conceptual Framework: Food Chain Supply Framework
The study is guided by the food supply chain proposed by Reddy and colleagues (Reddy, Singh et al. 201624) to illustrate the many points during which disruption can happen.
Setting
Data were collected from the municipality of Barranquitas (Gobierno de Puerto Rico 201725), which is located in the mountainous area of Puerto Rico’s main island and is one of many municipalities still without communication, potable water, and electricity. Barranquitas has one of the lowest mean household incomes on the main island (< $15,000 annually) and was reported to sustain significant infrastructure damage (Federal Communications Commission 201726). According to government data, through early November 2017 (a month and a half after the hurricane) there were 21 deliveries of food and water to the entire municipality (30,402 people) that was declared a disaster zone (Gobierno de Puerto Rico 201727).
Aim 1 Methods
To document the food chain disruption, the author trained two teams of students/research assistants in Puerto Rico. The first team (two research assistants who lived in the municipality and were therefore familiar with it) traveled and mapped all roads in the municipality, marking and confirming those that had been destroyed during the hurricane and those that were closed. Using a map of the municipality, this team was tasked with mapping all of the food venues (i.e., restaurants, food stores of all sizes, bread shops, food trucks, fruit/vegetable stands, pharmacies, and gas station convenience stores) in the municipality, noting the name of the venue, the location, whether the venue was open for business after the hurricane, and the hours of operation. They also took a photo of the outside of every venue. The second team (composed of two nutritionists and two other research assistants) followed the directions of the first team to each of the food venues, and conducted a structured observation using the data capture application Magpi, which can be accessed offline via smartphones. Paper surveys that mimicked the Magpi application were also designed as a second option in case the team ran into problems accessing electricity to power their phones.
Survey Instrument
The structured observations were designed following the question prompts and structure of the Nutrition Environmental Measures Survey (NEMS) short observation tool. This instrument has high inter-rater and test-retest reliability (Andreyeva, Blumenthal et al. 200828). The NEMS was used to document the availability, prices, and quality (adequate appearance and low sodium or low sugar options) for specific foods in food venues. We adapted the instrument to focus on fresh, frozen, or canned foods within the food groups of interest (food groups according to USDA food groups: dairy, fruits, vegetables, proteins, grains, beverages). In light of the reports from social media about how the federal food commodity support was providing candies and sweets, we also added sweets/candies to the survey to capture whether the availability of these items had been disrupted in food venues.
The survey design followed NEMS sections, including food venue descriptions and availability, price, and quality of the following items:
- milk
- fresh fruit
- fresh vegetables
- fresh protein
- canned fruit (option to mark if light syrup was used)
- canned vegetables (option to mark low sodium)
- canned protein (option to mark low sodium)
- frozen fruit
- frozen vegetables
- frozen protein
- grains
- beverages and
- dessert or candy.
Data Collection
The author trained the team of research assistants during an eight-hour training on November 9. The training provided a detailed overview of the justification and purpose of the study, familiarization with instruments and software, and practice data collection with high fidelity and inter-rater reliability. During this time, research assistants also suggested edits that were incorporated into the data collection, including adding questions and space for notes.
Data on food venues were collected from November 10–16 via daily trips to the municipality (which is located about 1–2 hours from the metropolitan area of San Juan). Both teams worked in tandem, meeting with the author during lunch breaks to review data completion and accuracy, and assess and resolve roadblocks in obtaining, inputting data, or accessing software.
Data Analysis for Aim 1
A Master of Public Health student at George Washington University conducted the data analyses for this project, as part of the culminating experience requirement for her thesis, under the supervision of the author. The data collected were automatically inputted from Magpi into Excel. The student data analyst conducted a thorough data cleaning process to remove incomplete data sets that were automatically included by Magpi. This included standardization of units that were involved in price calculations to ounces for canned items and pounds for dry items and produce. All of this data were compiled into summary sheets that broke each question into averages by store type.
Preliminary Results for Aim 1
To describe the food environment (i.e., which foods were available in stores) post-Hurricane Maria, the team mapped 96 food establishments/venues in Barranquitas. The majority (78 percent) were open for business during the data collection (November 10–16, 2018). Of those, 29 percent had electric power. Below, we present the results for the grocery stores. Over half (66 percent) of grocery stores did not have power and relied on gas generators.
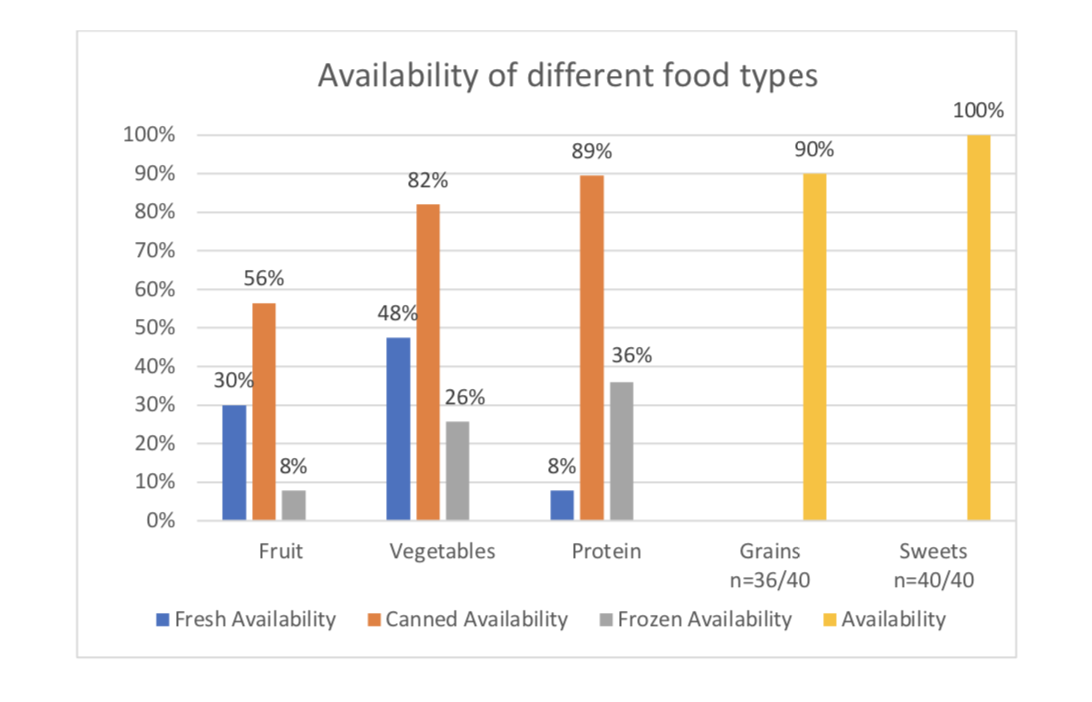 Figure 1. Percent of stores that carried different types of food.
Fresh produce
Fresh fruits were available in only 30 percent of stores, and most of these fruits were imported apples or pears (83 percent of stores with fresh fruit had apples available and 50 percent had pears available). Fresh vegetables were available in fewer than 50 percent of the stores, and consisted principally of onions and potatoes. It is noteworthy that none of the stores had bananas or mangoes, which are staple fruits in the Puerto Rican diets. Eight percent of stores had fresh protein meats (8 percent had beef, 8 percent had chicken, 7 percent had pork, and 3 percent had fresh fish).
Canned fruits, vegetables, and proteins
Canned proteins and vegetables were sold in 80 percent and 89 percent of stores, respectively. Canned fruits were sold in 56 percent of stores. Stores did not sell any low sodium options for vegetables or protein. An average of 3.5 of 4 varieties of fruit were packaged in sugary syrup.
Grains
Grains were available in most stores (84 percent had rice, 76 percent had bread, and 76 percent had crackers).
Dairy
Milk was available in 80 percent of stores. None had non-fat options.
Beverages
Items such as water, rice, and sweets were available in all stores, while diet soda was available in only 18 percent of stores after the hurricane.
Candies
All of the stores had more than 16 varieties of pre-packaged candies available.
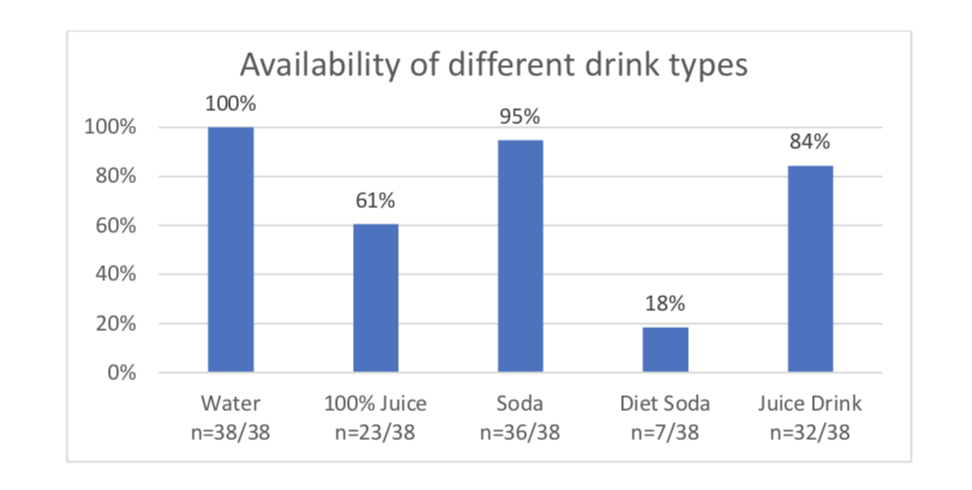 Figure 2. Percent of stores with different drinks available.
Aim 2 Methods
Using offline data capture (Magpi) and picture taking, we designed a structured observation protocol to capture characteristics and pictures of food commodities delivered to Barranquitas for 10 consecutive days (November 15–November 25) at the central distribution center that was set up by FEMA in Bayamon. The observation protocol captured dates of delivery in Bayamon, as well as box numbers and characteristics. The boxes were also tracked to the municipality of Barranquitas by noting the box number and its characteristics. Once in Barranquitas, the box was opened, and the research assistant noted the types of foods (perishable or prepackaged/canned). The photos of the contents in the boxes were then categorized according to according to brands and flavor of individual food items. A list that enumerated each food item by its unique name as stated in the front-of-product label was then created.
A research assistant extracted the first four ingredients under the Nutrition Facts Label of each item and to categorize items by food groups. To do this, the researchers searched for the individual food and beverage items using the Food and Nutrient Database for Dietary Studies codes linked to “What We Eat in America” (WWEIA), a national food survey of foods typically consumed in the US conducted regularly as a partnership between the U.S. Department of Health and Human Services and the USDA. (U.S. Department of Agriculture 201629) The researchers used the mutually-exclusive food categories found in WWEIA (milk and dairy; protein; mixed dishes; grains; snacks and sweets; fruit, and vegetables) to group food items.
Data on specific nutrients was then extracted from the Nutrition Facts Label of each unique food item. Data collected included: serving and package sizes, kilocalories (kcals), fiber (grams), saturated fats (grams), sodium (micrograms), and added sugars (g)(when this information was available) per serving. The serving size was assessed in two ways: a) according to manufacturer’s suggested serving size or b) according to the entire package size if products were packaged in discreet units and meant for individual consumption in one sitting (i.e. grab-and-go bags of chips, candy bars, main entrees) (Food and Drug Administration (FDA) 201630) If the nutrient facts panel was not printed on the food packaging, or illegible in the photograph of the food item, nutrient data were collected from the product manufacturer or from nutrient databases (U.S. Department of Agriculture , 2016) If there were discrepancies in nutrient content between these sources of data, these were noted and the most conservative estimate for nutrient content (higher fiber or lower sodium, saturated fat, added sugars) were captured. Content of sodium, saturated fat, added sugars and fiber were selected given the DGA recommendations to increase intake of whole grain/high fiber foods and to limit consumption of sodium, saturated fats, and added sugars to help prevent diet-related chronic diseases (Dietary Guidelines Advisory Committee 201531)
Items that contributed 20 percent or more of the percent daily value (percent DV) for sodium, saturated fats, and added sugars per serving (for those items that had the added sugars information available), were deemed to be high on those nutrients. The percent DV is calculated based on the Dietary Reference Intakes (DRIs) from an intake of 2,000 calories per day. Fiber content per serving (<1g fiber per serving) was also noted.
To assess if intended beneficiaries of these foods would be able to meet the DGA recommendations on a given day with these foods, a registered dietitian (RD) in Puerto Rico was instructed to develop daily meal plans (breakfasts, lunch, dinner and snacks) with the list of foods and beverages observed. Using the foods and beverages provided by FEMA, the dietitian was directed to: a) include a variety of foods that would be typically consumed by the population in Puerto Rico; b) follow the DGA recommendations for MyPlate food groups; c) select at all times foods that were whole grain or had the lowest content of sodium, saturated fat and/or added sugars per serving; the RD was allowed to repeat foods if needed in order to meet the 2000 kcal/day. This resulted in three different examples of combinations of foods or ‘meal plans’ for any given day. To check the justification and reliability of these meal plans, a second and more senior registered dietitian independently reviewed all meal plans, assigning servings to the closest 0.25 cup according to single serving size so that they contributed to servings per MyPlate food groups (6 oz grains, 2.5 cups vegetables, 2 cups fruits, 3 cups dairy, and 5.5 oz protein), and revising some of the food selections to ensure that the lowest sodium and/or saturated fat/added sugar items were included in the meal plans. The senior dietitian used data from the USDA’s SuperTracker online database (U.S. Department of Agriculture32), a tool to guide users in planning meals, to assign the appropriate DGA/MyPlate food group servings to each unique food item. If a food item itself or a closely related similar food item was not specifically listed in this database, then the first listed ingredient was used to estimate the appropriate food group assignment. If the first ingredient was water, the second ingredient was used.
Preliminary Results for Aim 2
In the study municipality, new foods were delivered on six of the 10 days of study observations. A total of 189 photos of pallets, boxes, and their contents were taken during the period of observation. For this analysis, 20 photos which showed pallets of bottled water and personal care products were excluded.
After deleting repeated items (same brands, size, and flavors n=43), infant formulas and hydration solutions (n=3) and unidentified brands or flavors (n=11), and condiments (n=2) there were a total of 107 unique food items.
The distribution of these unique foods according to the established criteria specified in WWEIA (U.S. Department of Agriculture 2016) was as follows:
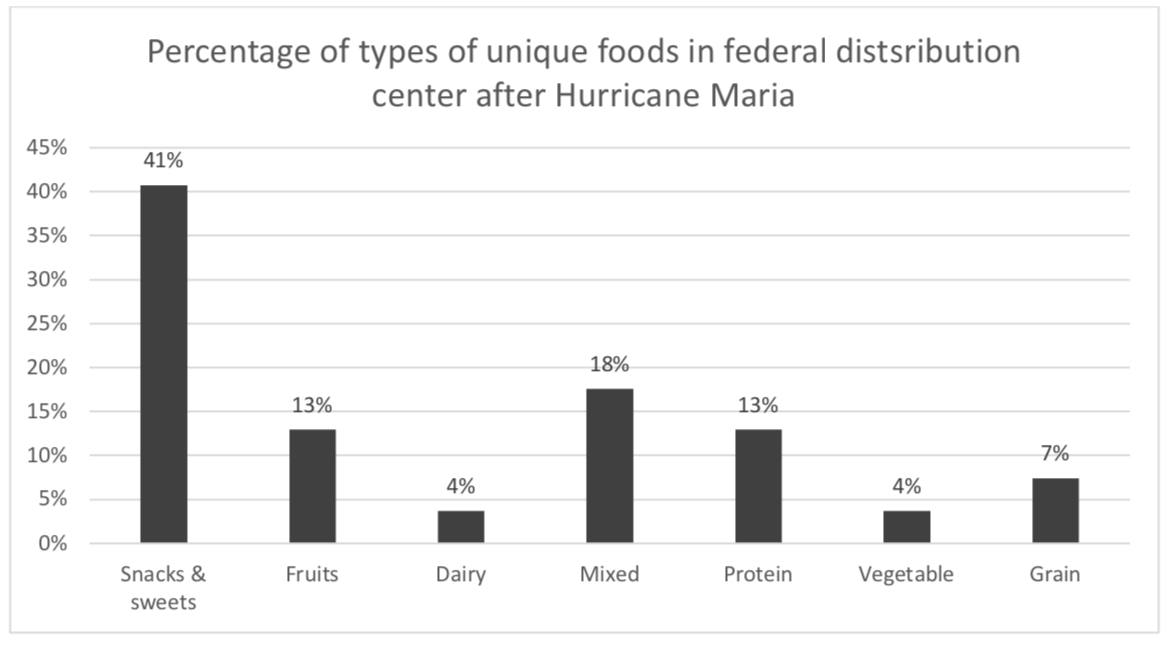 Figure 3. Distribution of unique foods after Hurricane Maria.
More than half (58 percent) of unique foods were low in fiber (contained < 1g per serving); and 46 percent exceeded the upper limit recommendations for sodium, saturated fats, or added sugars. Specifically, 20 percent, 10 percent and 30 percent were high in sodium, saturated fat, and added sugars respectively (i.e. each serving contained >20 percent the upper limit recommendation for those nutrients). Eight percent of all unique foods listed the first ingredient as sugar/corn syrup, chocolate, salt or fat, suggesting that these foods were of very low nutritional value.
Could a beneficiary meet the DGA recommendations with these foods distributed?
A registered dietitian created diets for each day using the available food commodities observed per day. The dietitian was instructed to make the healthiest diet possible (breakfast, lunch, dinner, and a snack) with the available items, following the key recommendations of the DGA (Department of Health and Human Services 201533). The instructions for each food group were to:
- Include a variety of vegetables from all the subgroups; prioritize variety of dark green, red and orange vegetables, and legumes, including beans and peas, and items with lower sodium content.
- Include a variety of fruits, and choose whole fruits; prioritize options with lower content of added sugars.
- Ensure that at least half of grains are “whole grains” or contain fiber; prioritize options that are low in added sugar content.
- Prioritize fat-free or low-fat dairy items.
- Include a variety of proteins (fish, lean meats, beans, and nuts); prioritize food items that are low in sodium and saturated fats.
The RDs chose among lowest sodium, saturated fat and added sugar content foods to create meal plans that met the DGA food group recommendations on any given day. As such, the RDs did not use any of the foods for which the first ingredient was sugar/corn syrup, chocolate, salt or fat.
The resulting meal plans (Tables 3-5) contributed a total energy content that ranged from 1,926- 2,473 kcals per day. All three meal plans contributed adequate amounts of fiber (between 25-38 g, as per DGA). Despite choosing among the lowest sodium, saturated fat and/or added sugar items, all meal plans exceeded at least two of these nutrients. For example, Meal Plan 2 contributed the lowest amount of sodium per day (2,576 mg); the RDs were able to achieve this lower-sodium day plan (yet, still above upper limit recommendations) by choosing reduced sodium mixed dishes, white rice (without seasoning), in a virtually vegetarian (no animal protein) meal plan. This meal plan also came under the upper limit for added sugars by choosing unsweetened applesauce, fruits packed in 100 percent fruit juice, and dried fruits. Meal Plans 1 and 3 had higher content for sodium, saturated fats and added sugars, for which canned pasta and meat-based mixed dishes, meat and plant-based spreads contributed large amounts of these nutrients.
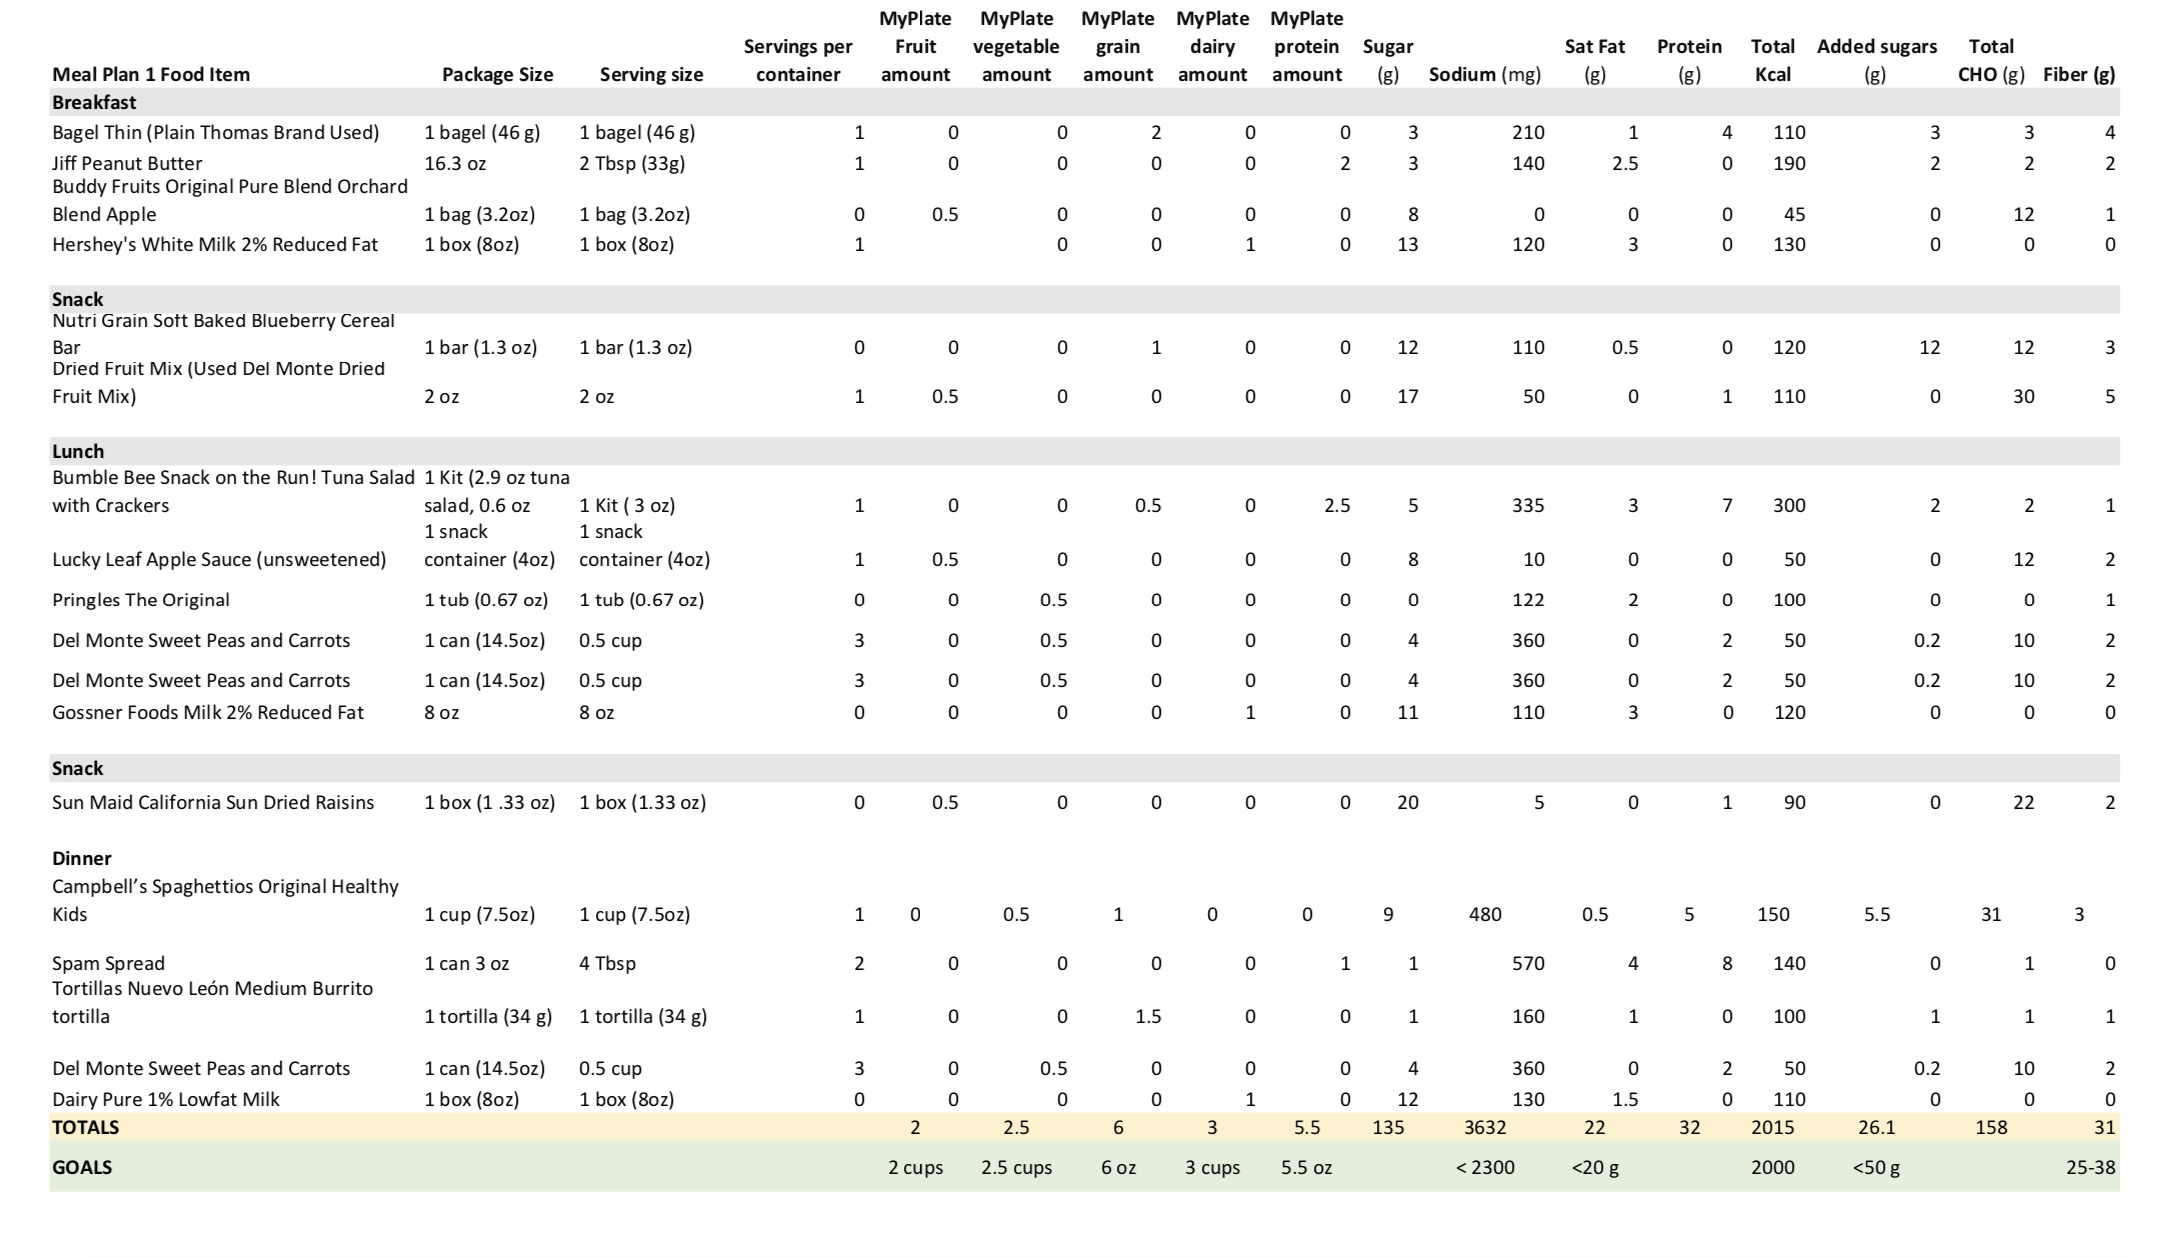 Table 1. Meal Plan 1 developed with foods from federal distribution center in the aftermath of Hurricane Maria. The plan details how foods contribute to MyPlate food groups and nutrient content.
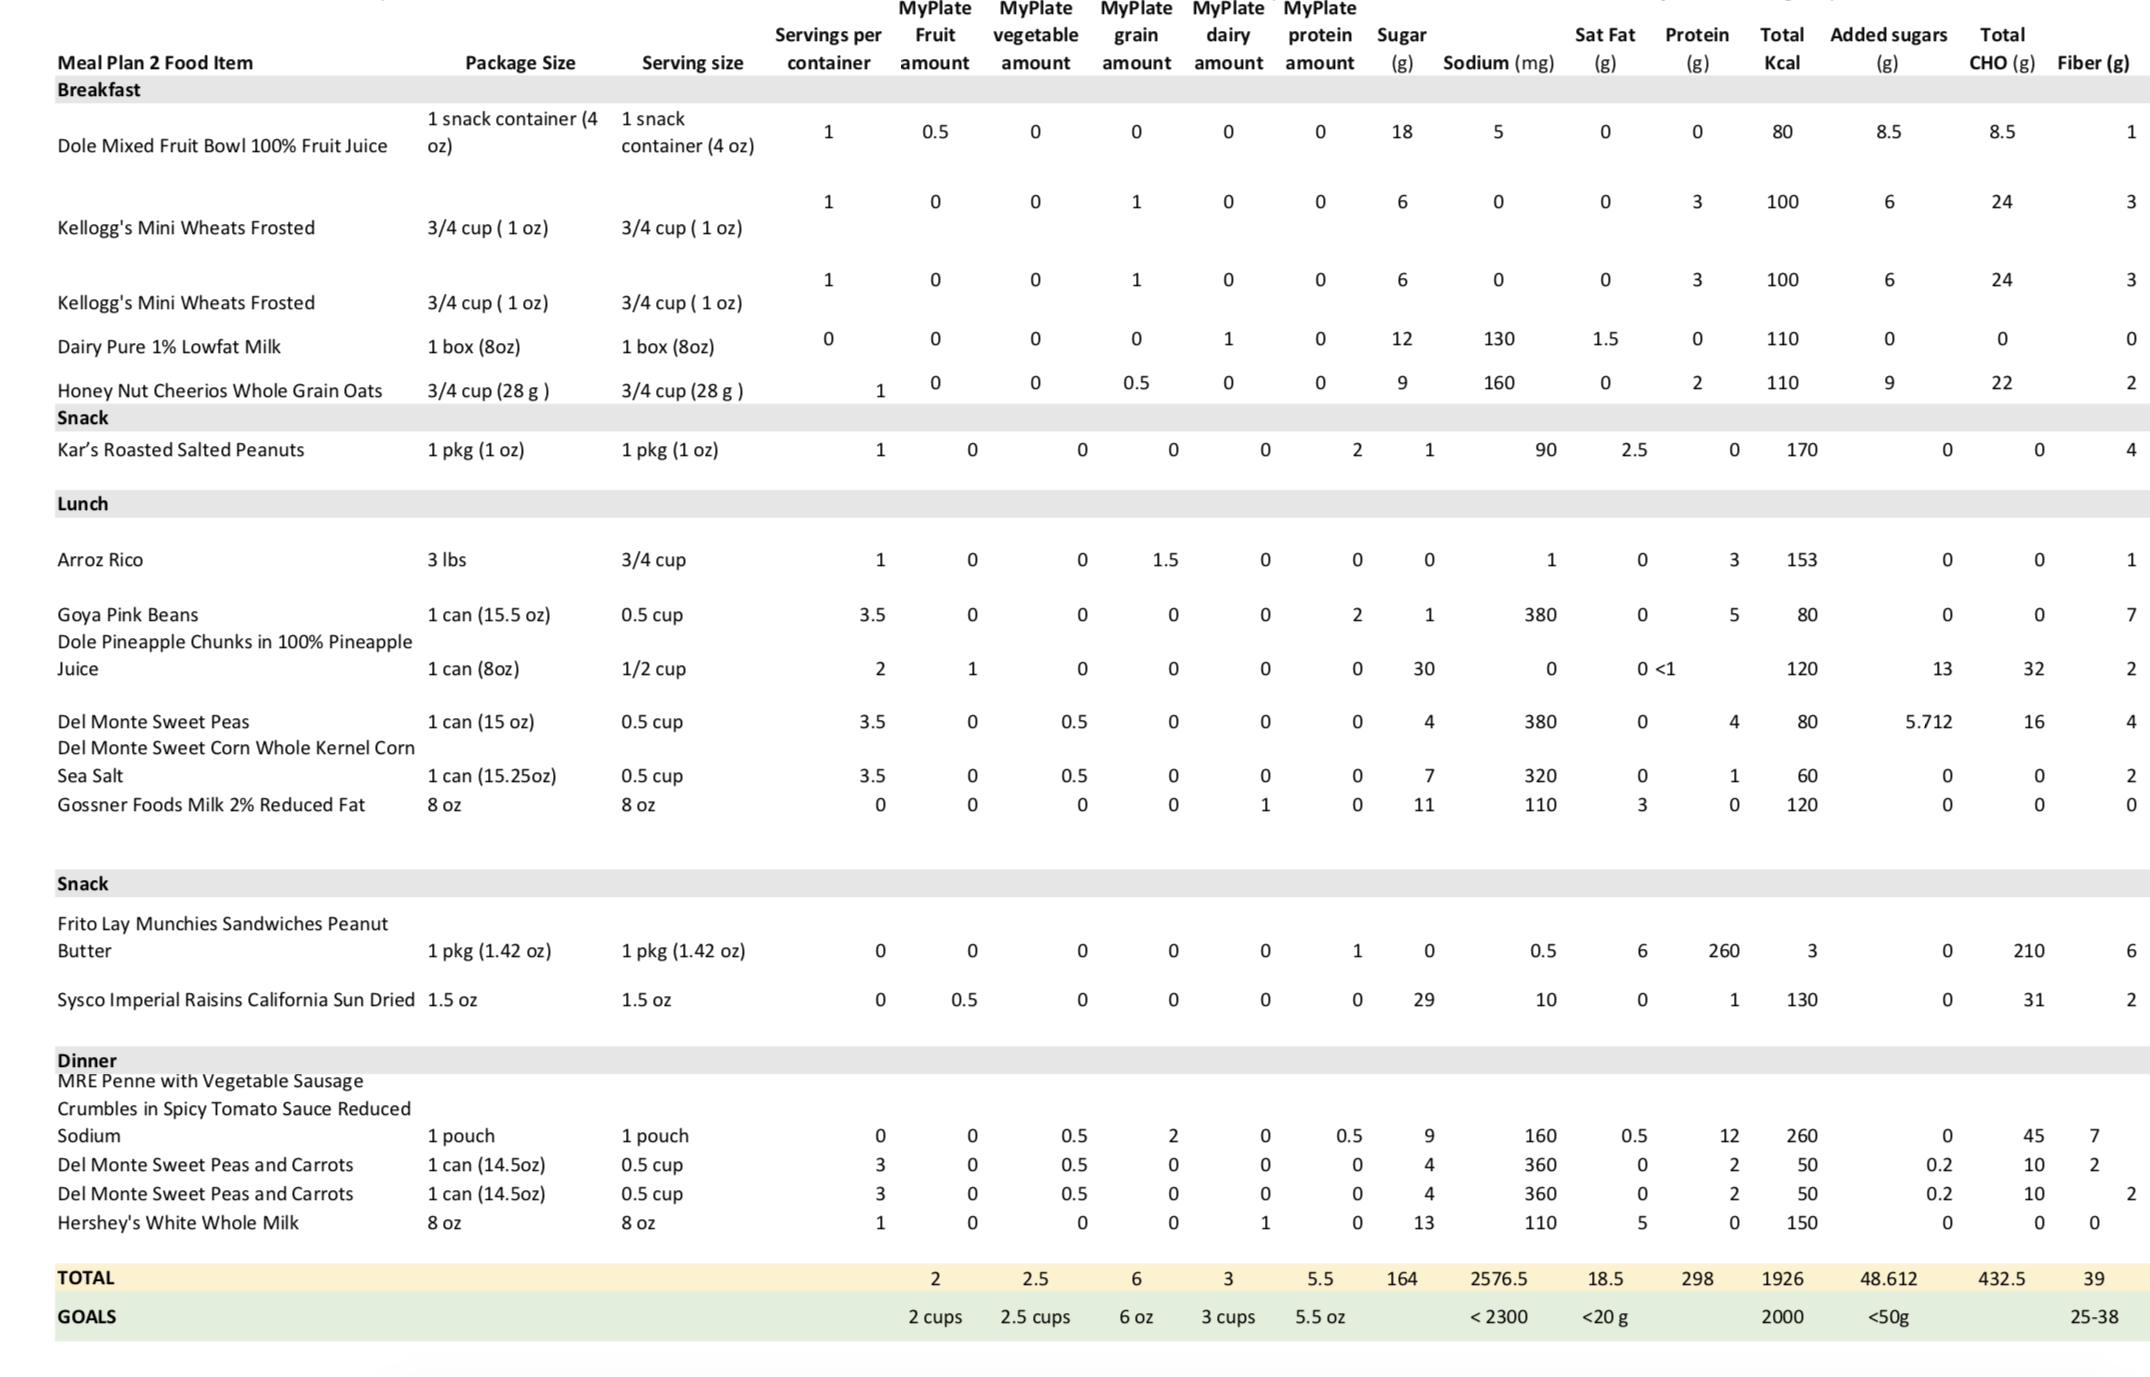 Table 2. Meal Plan 2 developed with foods from federal distribution center in the aftermath of Hurricane Maria. The plan details how foods contribute to MyPlate food groups and nutrient content.
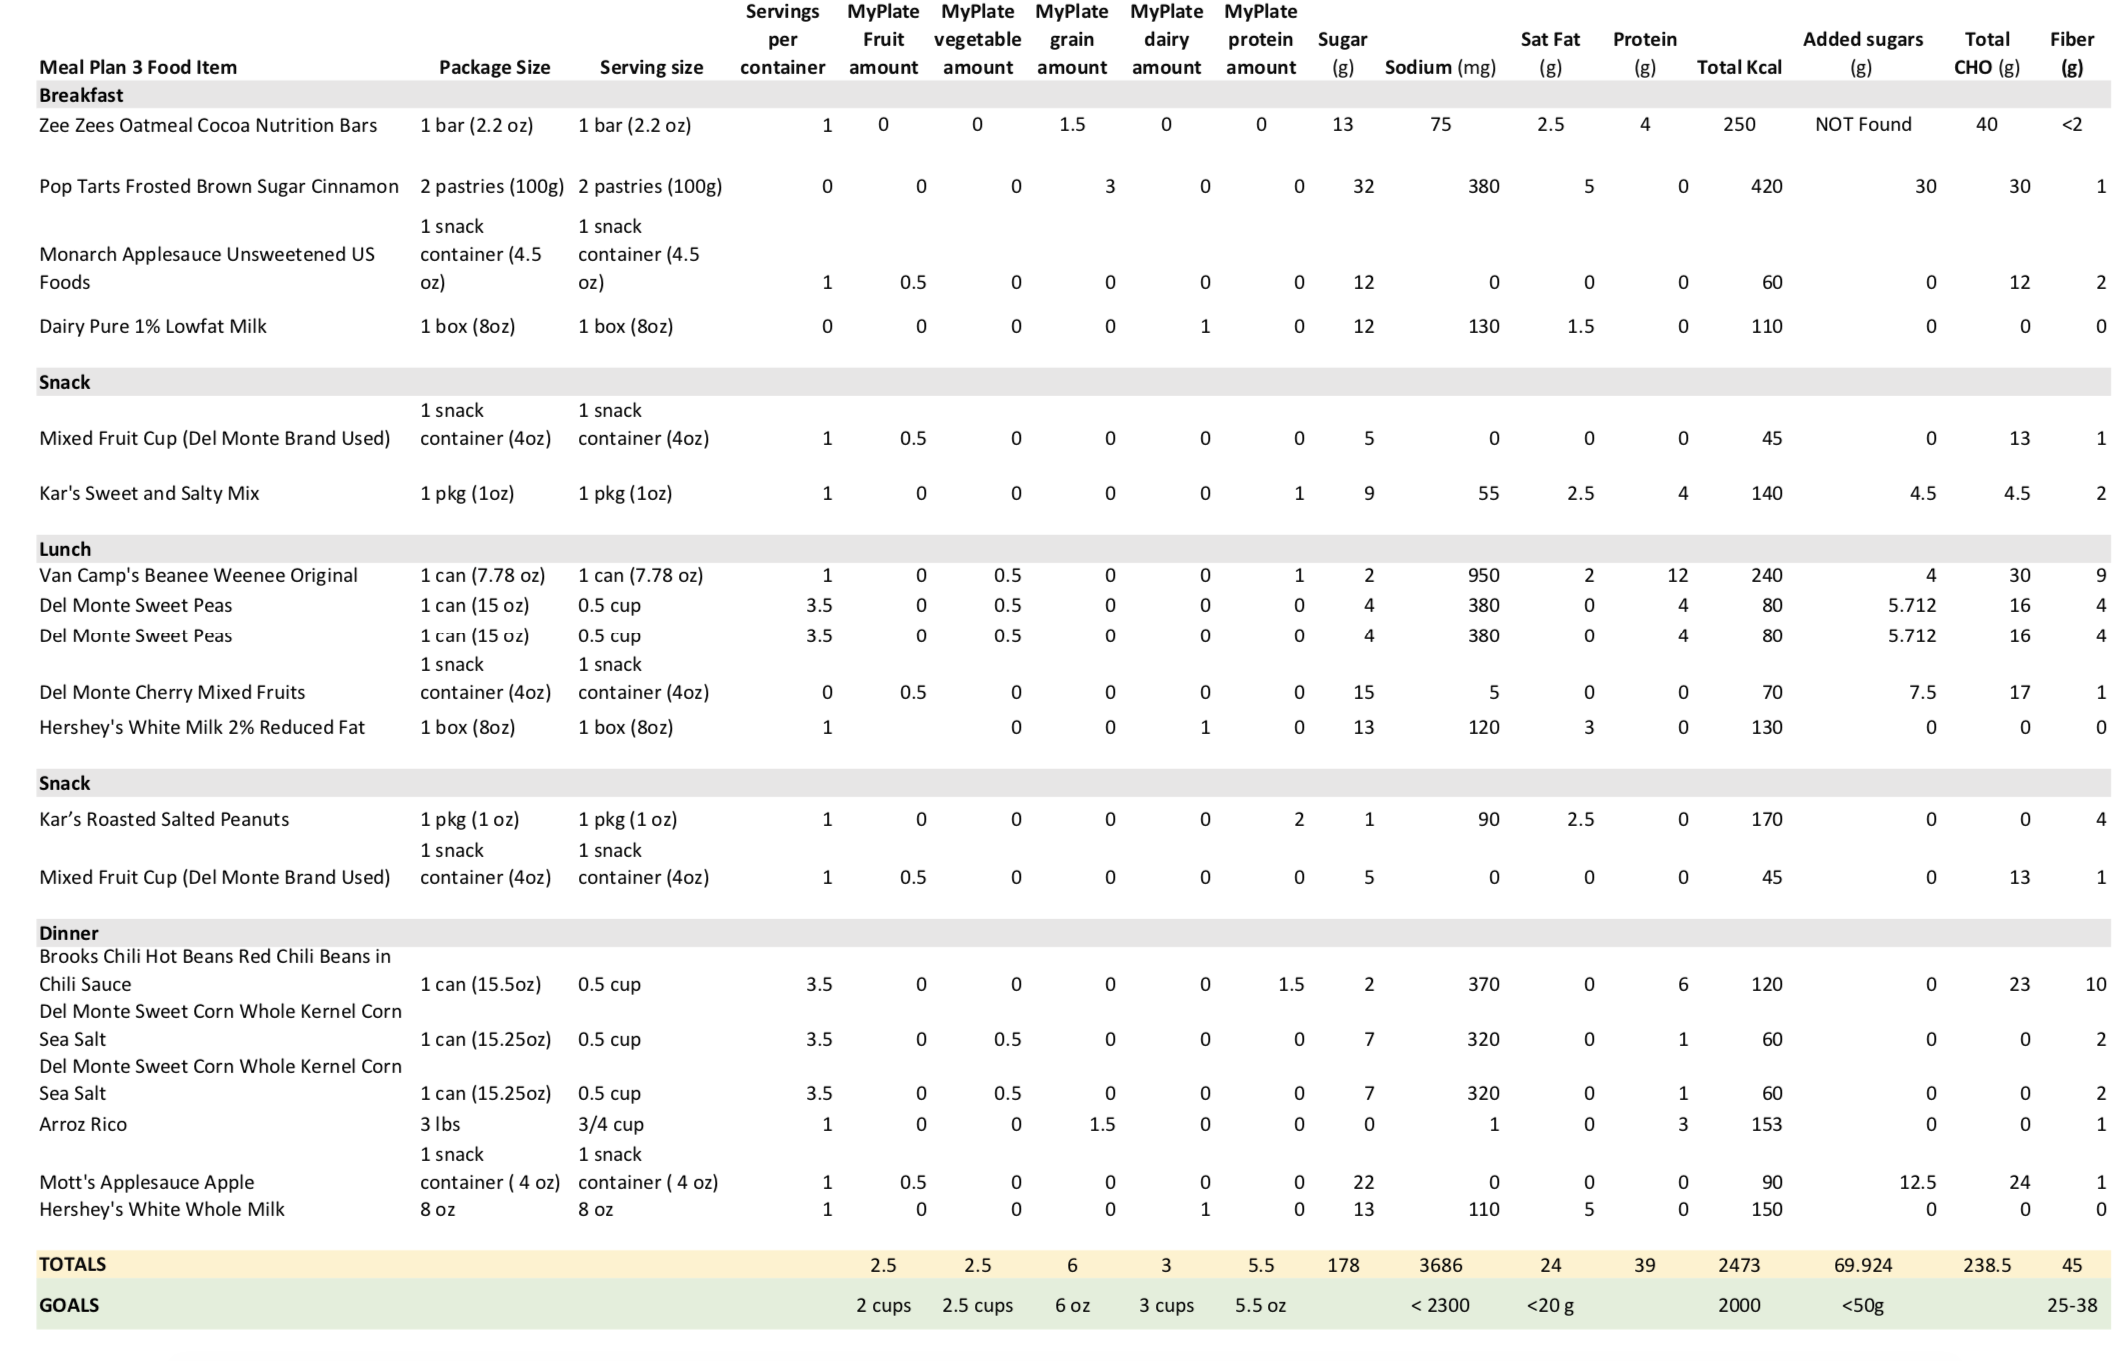 Table 3. Meal Plan 3 developed with foods from federal distribution center in the aftermath of Hurricane Maria. The plan details how foods contribute to MyPlate food groups and nutrient content.
Discussion
Emergency foods distributed during federal disaster relief efforts must follow the federal DGA according to the 1990 National Nutrition Monitoring Related Research Act (U.S. Department of Agriculture 2017) as they are intended to support the health of surviving families. Our results of a rapid assessment of foods distributed by the federal relief efforts in a rural municipality of Puerto Rico in the aftermath of Hurricane María found that almost half of the unique items exceeded the sodium, saturated fats or added sugar upper limit recommendations established by the DGA. The meal plans designed could meet the DGA food group recommendations; however, the amounts of sodium, saturated fats or added sugars in each plan still exceeded upper limits for any given day. For 8 percent of all unique foods, the first ingredient was sugar/corn syrup, chocolate, salt or fat, suggesting that these foods were very low in nutritional value. The combination of foods received as part of the federal response during the Disaster Household Distribution relief efforts present a challenge to the development and support of healthy eating patterns among vulnerable populations. The low-nutritional-quality foods provided as part of the relief efforts were compounded by a food environment that was already saturated with unhealthy options.
Puerto Rico suffers disproportionately from obesity, diabetes, and hypertension (Ho, Qian et al. 2006, Rivera-Soto, Rodriguez-Figueroa et al. 2010, Allende-Vigo, Perez et al. 2013, Elias-Boneta, Toro et al. 2015). Diet-related non-communicable diseases are highly prevalent and more deadly in Puerto Rico than in the United States and other Latin American countries (Durazo-Arvizu, Barquera et al. 2006, Miranda, Herrera et al. 2013, Colon-Ramos, Rodriguez-Ayuso et al. 2016). The hurricanes exacerbated these diet-related vulnerabilities by causing near destruction of local food production, the collapse of the power grid, and decimating potable water systems, with repercussions that lasted for months (Energy and Restoration 2017, Robles and Ferre-Sarduni 2017, Federal Emergency Management Agency 201834, Palin, Hanson et al. 201835, Palin, Hanson et al. 201836). The storm also disrupted the supply chain of imported foods, on which the Caribbean depends heavily(Palin, Hanson et al. 2018). Data from the private sector shows that the Puerto Rican grocery supply chain recovered about one month after landfall of Hurricane María (Palin, Hanson et al. 2018). Coca-Cola was reported to be the first vendor to show up after the storm in various municipalities, as demand for the sugary drink increased in light of the questionable quality of public water (Palin, Hanson et al. 2018). Our results show that the availability of diet drinks, as well as low-sodium, low-sugar canned commodities was extremely limited six weeks after the storm. As local grocery stores recovered, the disruption in power grid limited citizens ability to access Family’s Electronic Benefit Transfer (EBT) or to procure cash via automated teller machines (ATM) (Healy 201737). Approximately 40 percent of all food purchases are made with the EBT card, and during the hurricane, few had cash readily available in rural parts of the islands (Palin, Hanson et al. 2018), which further limited their food purchasing abilities.
With the rising challenge of overnutrition and diet-related chronic diseases, especially among the most vulnerable, poor, and food insecure communities in the United States and abroad (World Health Organization 201738), the emergency feeding efforts should reflect these growing needs. However, our results suggest that the most recent emergency feeding continue to be focused on providing sufficient calories, with more limited concern for the ability of those foods to support healthy dietary patterns.
U.S. emergency plans and manuals could be strengthened by providing more alignment between agencies about the nutritional goals to ensure that all emergency foods can contribute to a healthful diet following the recommendations the DGA. To date, FEMA guidelines focus on providing adequate levels of food and water in an emergency, emphasizing energy and shelf-life/safety of foods with limited regard to the nutritional value of foods (Federal Emergency Management Agency 200439). The USDA also mentions the importance of nutrition during disaster feeding, emphasizing the need to provide “nutritionally-balanced meals,” with reduced-sodium, low-fat, and sugar-, dairy- and gluten-free meals, and to pay attention to special dietary needs and culturally-sensitive meals (e.g., diabetic, and reduced sodium) (National Mass Care Strategy 2015). However, these seem to be general advice and lack specificity. To illustrate, the Nutrition Table in the USDA FNS Foods Program Disaster Manual highlights USDA Foods that are frequently in inventory and considered “good sources of nutrients to help disaster survivors cope with stress.” Of the 47 food examples listed in this table, only five are canned/pre-packaged, and the rest include examples that are logistically challenging to provide in disasters because they are not shelf-stable, such as roasted meats and cooked salmon. In addition, the scientific evidence to support that the nutrients in these foods can “help alleviate stress” is weak and based on an unpublished 2013 student thesis (U.S. Department of Agriculture 2017). There is also no guidance in terms of methods for preparation and packaging, or even for the brands of canned items, which could significantly impact the nutrient content of these foods. There is no mention of dessert/snack foods, or recommendations about the sugar, sodium, saturated fat, or trans fat content of food commodities as you would expect to see in the DGA, although USDA Foods are said to have been reformulated to lower levels of sodium, sugar, and fat (Abernathy 2015). A step in the right direction toward alignment of emergency foods with DGA comes from revisions to the nutritional guidance for hydration services of the Multi-Agency Feeding Plan; the 2010 version explained that hydration services distribute beverages and possibly candy and energy bars to “provide a quick energy boost" (National Mass Care Strategy 201040), while the 2015 Multi-Agency Feeding Plan has eliminated any mention of candy (National Mass Care Strategy 2015).
Although almost half of the unique shelf-stable foods exceeded sodium, saturated fats or added sugars, that also means that about half of unique items complied with not exceeding these nutrients. This suggests that the emergency relief system is indeed able to provide shelf-stable foods that can simultaneously address all of the DGA recommendations, including food groups and nutrition requirements during an emergency (i.e. unsweetened fruit sauces; fruits packed in 100 percent fruit juice; canned vegetables packed in water without salt, or reduced sodium mixed dishes). For future emergency recover efforts, a certification program, similar to the one required from vendors of the National School Lunch Program (Food and Nutrition Service 2014), could improve the nutritional quality of emergency foods while at the same time complying with the challenges of rapid procurement and distribution from many different agencies and donors.
Limitations
This study has several limitations and its results must be interpreted within its limitations. First, due to the nature of a rapid assessment during the hurricane María, food consumption data or data about recipients, was not collected. Although foods were distributed with the intention of household food consumption and as a complement to the diets of survivors, the study was not designed to answer questions related to consumption or diet of the survivors. Second, the rapid assessment was conducted for only 10 days and almost six weeks after the hurricane; the types of foods observed may have varied before and after that period. Third, the research team was unable to observe whether the foods were distributed to beneficiaries in the quantities intended (or marked in the boxes). Regardless of the quantities, what remains relevant is that all of the unique emergency foods should contribute to support the health of surviving families. Fourth, this study focuses on only one of ways in which the USDA responds to emergencies to meet nutritional needs of disaster survivors.
Despite the limitations, the findings attest that there is a need to improve the DGA compliance so that all of the emergency foods intended for distribution to households can support the health of surviving families.
Conclusion
The conclusions of this study are three-fold: first, the findings suggest that during emergencies, it is possible to provide pre-packaged and shelf-stable foods that can contribute to creating meal plans that fully comply with the DGA; second, more of those items should be incorporated into the distributions so that participants can eat well below the upper limits of sodium, saturated fats, and added sugars every day; third, there is no need for some items of low nutritional value to be distributed (in this case, almost 10 percent of the unique foods distributed), as recipients can meet their nutritional and caloric needs with other foods that are not ‘empty calories’ and have more nutritional value. Finally, short-term disaster relief such as food distributions could be expected to last longer in view of the increasing magnitude and frequency of natural disasters due to climate change(Rosen 201741) which are also projected to disproportionately affect already vulnerable populations. The role that long-term emergency feeding may have on the diets and chronic disease prevention of a population with high baseline rates of these health conditions is yet to be observed.
References
-
Ho, G. Y., H. Qian, M. Y. Kim, T. A. Melnik, K. L. Tucker, I. Z. Jimenez-Velazquez, R. C. Kaplan, E. T. Lee-Rey, D. T. Stein, W. Rivera and T. E. Rohan (2006). "Health disparities between island and mainland Puerto Ricans." Rev Panam Salud Publica 19(5): 331-339. ↩
-
Rivera-Soto, W. T., L. Rodriguez-Figueroa and G. Calderon (2010). "Prevalence of childhood obesity in a representative sample of elementary school children in Puerto Rico by socio-demographic characteristics, 2008." P R Health Sci J 29(4): 357-363. ↩
-
Allende-Vigo, M., C. Perez, J. J. Hernandez, C. R. Torres, Y. Valle, R. Rosario and E. Suarez (2013). "Unequal burden of diabetes and hypertension in the adult population of the San Juan metropolitan area of Puerto Rico." Journal of Diabetes & Metabolism. ↩
-
Elias-Boneta, A. R., M. J. Toro, O. Garcia, R. Torres and C. Palacios (2015). "High prevalence of overweight and obesity among a representative sample of Puerto Rican children." BMC Public Health 15: 219. ↩
-
Facts, U. S. C. B.-Q. (2016). "Puerto Rico." Retrieved November 13, 2017, from https://www.census.gov/quickfacts/PR. ↩
-
World, B. f. t. (2017). "Hunger and Poverty in Puerto Rico." Retrieved Novembere 10, 2017, from http://www.bread.org/sites/default/files/downloads/fact-sheet-hunger-poverty-puerto-rico-october-2017.pdf. ↩
-
Durazo-Arvizu, R., S. Barquera, M. Franco, M. Lazo, A. Seuc, P. Orduñez, A. Palloni and S. R. Cooper (2006). "Cardiovascular diseases mortality in Cuba, Mexico, Puerto Rico and US Hispanic populations." Prevention and Control 2(2): 63-71. ↩
-
Miranda, J. J., V. M. Herrera, J. A. Chirinos, L. F. Gomez, P. Perel, R. Pichardo, A. Gonzalez, J. R. Sanchez, C. Ferreccio, X. Aguilera, E. Silva, M. Orostegui, J. Medina-Lezama, C. M. Perez, E. Suarez, A. P. Ortiz, L. Rosero, N. Schapochnik, Z. Ortiz, D. Ferrante, J. P. Casas and L. E. Bautista (2013). "Major cardiovascular risk factors in Latin America: a comparison with the United States. The Latin American Consortium of Studies in Obesity (LASO)." PLoS One 8(1): e54056. ↩
-
Colon-Ramos, U., I. Rodriguez-Ayuso, H. T. Gebrekristos, A. Roess, C. M. Perez and L. Simonsen (2016). "Transnational Mortality Comparisons Between Archipelago and Mainland Puerto Ricans." J Immigr Minor Health. ↩
-
Energy, U. S. D. o. and I. S. E. Restoration. (2017). "Hurricanes Maria & Irma October 20, 2017 Event Summary (Report #69)." from https://energy.gov/sites/prod/files/2017/10/f38/Hurricanes%20Maria%20and%20Irma%20Event%20Summary%20October%2020%2C%202017.pdf ↩
-
Federal Emergency Management Agency. (2017). "Daily Operations Briefing, 29 October 2017." Retrieved November 10, 2017, from http://www.disastercenter.com/FEMA+Daily+Ops+Briefing+10-29-2017.pdf. ↩
-
Sacks, B. (2017). "People on the US Virgin Islands Can't Get Food Aid Because There's Still No Electricity." Retrieved November 10, 2017, from https://www.buzzfeed.com/briannasacks/six-weeks-after-hurricanes-hit-power-and-fresh-food-still?utm_term=.jlRJ0pAAp#.rwAGedqqd. ↩
-
Robles, F. and L. Ferre-Sarduni (2017). Puerto Rico's Agriculture and Farmers Decimated by Maria. New York Times. New York. ↩
-
U.S. Government Accountability Office. (1982). "Reasons for High Food Prices in the U.S. Virgin Islands." Retrieved November 10, 2017, from http://www.gao.gov/products/CED-82-93. ↩
-
Food and Agriculture Organization (FAO) Sub-Regional Office for the Caribbean, B. (2011). Regional Consultation on Policy and Programmatic Actions to Address High Food Prices in the Caribbean. Summary of Proceedings. Port of Spain, Trinidad Tobago, FAO. ↩
-
Bellot, D. (2017). "Territory Imports Over 97 Percent Of Its Food, Department Of Agriculture Reveals." The Virgin Islands Consortium Retrieved November 10, 2017, from Territory Imports Over 97 Percent Of Its Food, Department Of Agriculture Reveals. ↩
-
U.S. Department of Agriculture, F. a. N. S., Food Distribution Division (2017). FNS USDA Foods Program Disaster Manual, 2017. F. a. N. S. U.S. Department of Agriculture. Washington, DC, US Government Printing Office. ↩
-
Food and Nutrition Service (2014). Certification of Compliance With Meal Requirements for the National School Lunch Program Under the Healthy, Hunger-Free Kids Act of 2010; Correction. Federal Register: The Daily Journal of the United States Government, National Archives and Records Administration. ↩
-
Abernathy, T. (2015). "Responsibilities of the USDA-Food and Nutrition Service in Nutrition Assistance Response to Natural Disasters." J Nutr Sci Vitaminol (Tokyo) 61 Suppl: S14. ↩
-
National Mass Care Strategy (2015). Multi-Agency Feeding Support Plan Template: 87. ↩
-
Dewey, C. (2017). Why FEMA sent ‘junk food’ to Puerto Rican hurricane survivors. Washington Post. Washington, DC. ↩
-
Macias, K. (2017). FEMA contracts with company to send junk food aid to Hurricane Maria victims in Puerto Rico. Daily KOS. ↩
-
Willoughly, M. (2017). Puerto Rico Food Aid from GA Contractor Sparks Outrage. The Atlanta Journal Constitution. ↩
-
Reddy, V. R., S. K. Singh and V. Anbumozhi (2016) "Food Supply Chain Disruption due to Natural Disasters: Entities, Risks, and Strategies for Resilience." ERIA Discussion Paper Series. ↩
-
Gobierno de Puerto Rico. (2017). "Agencia Estatal para el Manejo de Emergencias y Administracion de Desastres/PREMA." Retrieved October 20, 2017, from http://www2.pr.gov/agencias/aemead/Pages/Home.aspx. ↩
-
Federal Communications Commission. (2017). "Communications Status Report for Areas Impacted by Hurricane Maria September 24, 2017." Retrieved October 20, 2017, from https://apps.fcc.gov/edocs_public/attachmatch/DOC-346861A1.pdf. ↩
-
Gobierno de Puerto Rico. (2017). "Status PR." from status.pr. ↩
-
Andreyeva, T., D. M. Blumenthal, M. B. Schwartz, M. W. Long and K. D. Brownell (2008). "Availability and prices of foods across stores and neighborhoods: the case of New Haven, Connecticut." Health Aff (Millwood) 27(5): 1381-1388. ↩
-
U.S. Department of Agriculture, A. R. S. (2016). "What We Eat in America Food Categories 2013-2014." Retrieved May 14, 2018, from www.ars.usda.gov/nea/bhnrc/fsrg. ↩
-
Food and Drug Administration (FDA) (2016). Food Labeling: Serving Sizes of Foods that Can Reasonably Be Consumed at One Eating Occasion; Dual-Column Labeling; Updating, Modifying, and Establishing Certain Reference Amounts Customarily Consumed; Serving Size for Breath Mints; and Technical Amendments. FDA-2004-N-0258-0136. F. D. Administration. ↩
-
Dietary Guidelines Advisory Committee. (2015). "Scientific report of the 2015 Dietary Guidelines Advisory Committee: advisory report to the Secretary of Health and Human Services and the Secretary of Agriculture." US Department of Agriculture, Department of Health and Human Services–USA, Washington DC Retrieved December 12, 2018, from https://health.gov/dietaryguidelines/2015-scientific-report/. ↩
-
U.S. Department of Agriculture. "Supertracker Database." Retrieved May 20, 2018, from https://www.supertracker.usda.gov/. ↩
-
Department of Health and Human Services (2015). Dietary Guidelines for Americans 2015-2020. ↩
-
Federal Emergency Management Agency (2018). 2017 Hurricane Season FEMA After-Action Report. D. o. H. Security, FEMA, US Department ↩
-
Palin, P. J., L. S. Hanson, D. Barton and A. Frohwein (2018). Retail Resilience in Puerto Rico. Supply Chain Resilience and the 2017 Hurricane Season. Arlington, VA, CNA Analysis & Solutions. IRM-2018-U-018098. October 2018. ↩
-
Palin, P. J., L. S. Hanson, D. Barton and A. Frohwein (2018). Static on the Relief Channel. Supply Chain Resilience and the 2017 Hurricane Season. Arlington, VA, CNA Analysis & Solutions. IRM-2018-U-018098. October 2018. ↩
-
Healy, J. (2017). With Widespread Power Failures, Puerto Rico Is Cash Only. The New York Times. New York. ↩
-
World Health Organization. (2017). "Noncommunicable diseases progress monitor 2017." from http://www.who.int/nmh/publications/ncd-progress-monitor-2017/en/. ↩
-
Federal Emergency Management Agency (2004). Document 477; A5055. ↩
-
National Mass Care Strategy (2010). Multi-Agency Feeding Plan Template 2010. ↩
-
Rosen, J. (2017). "How an ocean climate cycle favored Harvey." Science 357(6354): 853-854. ↩
Colón-Ramos, U. (2018). Assessment of Nutritional Quality of Household Emergency Food Distribution Post Hurricane Maria in Puerto Rico Natural Hazards Center Quick Response Research Report Series, Report 273). Natural Hazards Center, University of Colorado Boulder. https://hazards.colorado.edu/quick-response-report/assessment-of-nutritional-quality-of-household-emergency-food-distribution-post-hurricane-maria-in-puerto-rico