Factors Influencing Evacuation Behavior in Kīlauea Eruptions: An Examination of Residents in the Puna District, Hawaiʻi
Publication Date: 2019
Abstract
The purpose of our research was to identify and examine the factors that influenced evacuation behavior and decision-making during the 2018 Kīlauea lower East Rift Zone eruptions. The aspects considered include geographic proximity to hazards, information sources for emergency communications, and protective actions taken by residents before or during the eruptions. Residents of Puna District at the time of the eruptions who were at least 18 years old were eligible to participate in the study via a questionnaire. Our findings indicate that, while the majority of residents did evacuate in response to the eruptions, some households have chosen to shelter in place for future eruptions given their experiences. This report seeks to explain the underlying issues that led to these decisions, and explores options at the community level to promote resilience.
Introduction
Kīlauea Volcano has erupted numerous times over the past three decades. The eruptions that began on May 3, 2018, in the lower East Rift Zone, located in the southeastern Puna District on the island of Hawaiʻi, have opened 24 fissures and buried more than 6,000 acres of land with lava. The eruptions have destroyed more than 700 homes in the Leilani Estates and Kapoho areas, and covered or isolated more than 1,600 acres of farms. In addition to lava flows and subsequent fires, hazards such as volcanic gas emissions, vog, ash fall, acid rain, laze, ballistic projectiles, and earthquakes have posed risks to people and property. Most recent estimates place the cost of recovery at over $800 million, with the majority of funds distributed by the Federal Emergency Management Agency (FEMA). Lost tourism revenue alone from the eruptions is estimated to cost the Big Island as much as $200 million.
Study Area
The Puna District, located on the eastern side of Hawaiʻi County (see Figure 1), is home to an estimated 50,000 people (Hawaiʻi County 2018) who live in or near increased lava flow hazard zones. Puna was chosen as the study area for this research given its long and complicated history with land use planning and implications for future growth and development in hazard prone areas. In 1958, the real estate boom reached the Big Island, and land in Puna attracted developers due to its large lots in remote locations. According to the Hawai’i County Planning Department (2008a1), between 1958 and 1973, over 52,500 subdivision lots were created in Puna. Since then, nearly 2,500 of these lots have been buried by lava flows. Of the 50,000 remaining lots, the majority are accessed by unpaved roads, none have central sewer systems, and only a few have private water systems. Most subdivisions rely on rainwater catchment systems or individual wells. Due in large part to decades of rapid, unregulated development, entire units of many subdivisions are off the electric grid. Cooper and Daws (19852) argue that the natural hazard risk in the subdivisions made it more appealing to developers; from an economic perspective, these lots were virtually worthless. During the 1960s and 1970s, many of the Big Island’s prominent politicians had ties to developers, which highlights a persistent and complex problem (Cooper and Daws 1985).
Figure 1.
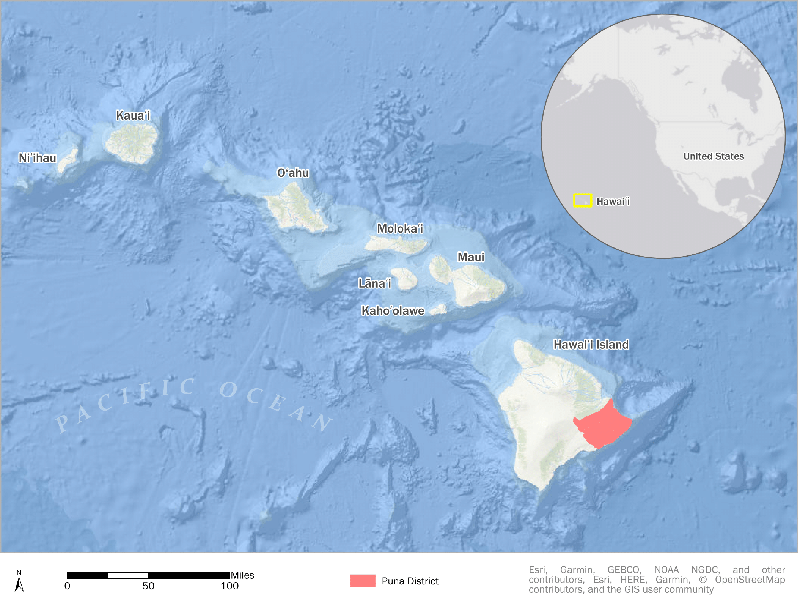
Increased development and inexpensive land in the Puna District will ensure continuous population growth; according to the Hawai’i County Planning Department, “Puna is experiencing the fastest rate of growth of all the districts in the County of Hawaiʻi. The census population count in 2000 for Puna was 31,335. In March 2007, the estimated population was 43,071, an increase of over 37 percent in less than seven years. By 2030, the population is projected to grow to approximately 75,000” (2008b3, 10). Because of the large size of Puna’s subdivision lots and limited through streets, evacuation of residents with little to no warning in a disaster can have devastating consequences. This problem will be exacerbated as new lots are created, outpacing improvements in infrastructure and utilities. This poses serious concerns for residents living in close proximity to Kīlauea and suggests the urgency of post-event research examining the interaction of factors that may influence decision-making in response to disaster events. Critical decisions in need of investigation are (a) the choice to evacuate in the event of eruptions and (b) the adoption of hazard adjustment and mitigation measures.
Volcanic Hazards in Hawai’i County
Since 1778, Hawaiʻi has experienced numerous volcanic eruptions, largely at Kīlauea and Mauna Loa, and events are expected to occur in the future. Between 1954 and 2018, FEMA issued six major disaster declarations for Hawaiʻi County for volcanic hazards; the Pu’u ‘Ō‘ō volcanic eruption and lava flow, which occurred from September 4, 2014, to March 26, 2015, and the May 2018 Kīlauea lower East Rift Zone volcanic eruptions and associated earthquakes are the most recent events that received declarations (State of Hawaiʻi 20184). According to the State Hazard Mitigation Plan, Hawaiʻi County’s exposure and potential losses from volcanic hazards is quite troubling. A GIS analysis identified a total of 1,021 (more than 80 percent) of state buildings located in lava flow hazard zones. Surprisingly, 771 of buildings in these hazardous locations belong to just two agencies: the Department of Education (621) and the University of Hawaiʻi (150). Replacement cost values for state-owned buildings located in these areas exceeded $3 million. Similar alarming trends were documented for state roads, critical facilities, general building stock, and populations and environmental resources at risk, all located in lava flow hazard zones in Hawaiʻi County (State of Hawaiʻi 2018). As changes in population and demographics occur in the future, more young and elderly individuals will further increase vulnerability to volcanic hazards on the Big Island, including lava flows and volcanic gas emissions.
Theoretical and Conceptual Framework
The purpose of this research is to explore and understand the existing knowledge, attitudes, perceptions, and experiences among households in the Puna District, Hawaiʻi, concerning behaviors in relation to volcanic hazards. This research builds on existing work examining risk perception and cultural factors influencing behavior in Hawaiʻi County and contributes to the literature on volcanic hazards and evacuation decision-making (e.g., Perry et al. 19825; Tobin & Whiteford 20026; Gregg et al. 20047; Dash & Gladwin 20078; Gregg et al. 20089; Gaillard 200810; Haynes et al. 200811; Lavigne et al. 200812; Paton et al. 200813; Gavilanes-Ruiz et al. 200914; Bird et al. 201115; Leathers 201416; Wei & Lindell 201717). The available research shows that hazard perception is influenced by experience, knowledge, age, religious beliefs, and various other characteristics (Slovic 198718; Burton et al. 199319; Tobin & Montz 199720; Smith 201321). This is important because hazard perception has a strong influence on how people prepare for, respond to, and recover from natural hazards. Perception is, thus, a crucial element that can increase or decrease an individual’s vulnerability to hazards.
Figure 2 shows the conceptual model that guides this research. Adapted from Dash and Gladwin (200522) for this study, the comprehensive model of evacuation views evacuation not as an end result, but a decision-making process that includes the interplay of three major factors: individual-level measures, event-specific variables, and risk perception. The individual-level attributes, independent of the hazard, are those that influence decision-making. In other words, they consider the pre-existing conditions related to an individual’s socioeconomic status and demographics, experience and knowledge, and geographic location. Event-specific variables are associated with the hazard. Risk perception refers to the decision-maker’s judgment of the hazard characteristics and severity. The relationships between these three factors collectively influence an individual’s decision to evacuate.
Figure 2.
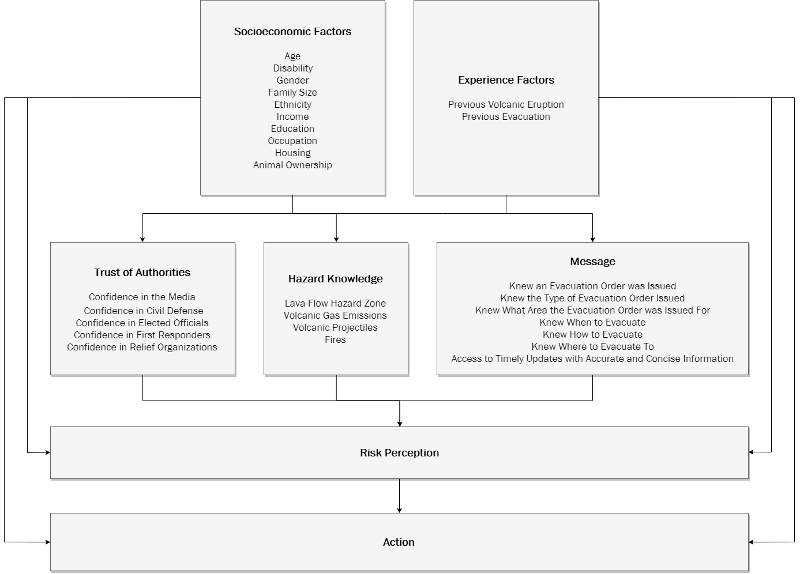
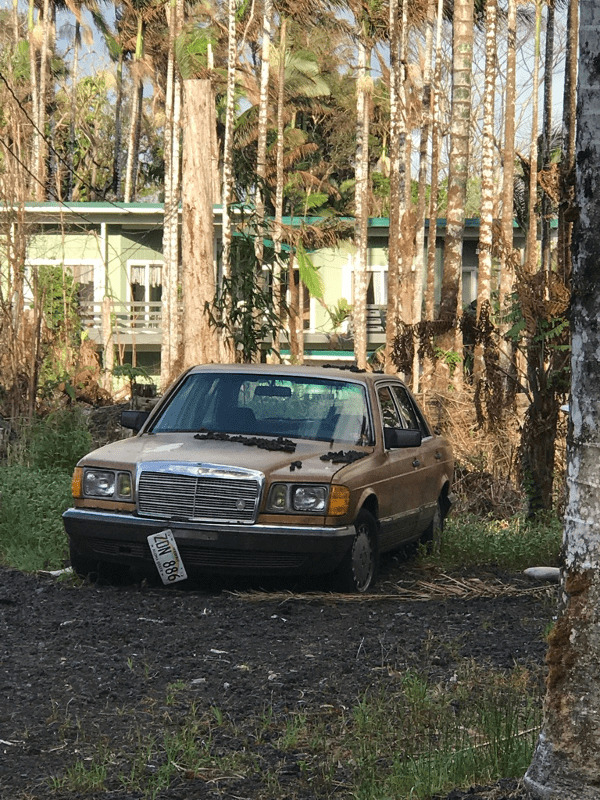
Figure 2 summarizes the array of complex relationships that serve to influence evacuation behavior in the recent Kīlauea eruptions in the Puna District. Socioeconomic status and demographic variables, such as age, household income, education, and previous experience with volcanic hazards and/or evacuating, interactions with trust of authorities (e.g., Hawai‘i County Civil Defense), news outlets, and social media, understanding of the hazards posed by the eruptions, and characteristics of evacuation and warning messages. This information ultimately influences both perception of the risks posed by the recent Kīlauea eruptions and one’s decision to evacuate or shelter in place. For example, a resident who owns a home in Lava Zone 1, earns less than $25,000, and has not evacuated for past eruptions because they did not perceive them to be threatening, may carefully weigh their options for leaving their home. If the resident were to evacuate, they might worry about things such as potential looters and when, or if, authorities would allow them to safely return to their home. If the resident were to remain in their home, they might be concerned about the health effects of volcanic smog and projectiles and roads being cut off by lava flows that would ultimately prevent them from escaping (see Figure 3). Attendance at local community meetings, conversations with neighbors, and updates on social media can also affect their confidence in local emergency management officials, disaster relief organizations, and elected officials. Given that this hazard is unique from others in the study area because of its unpredictable and prolonged duration, multiple opportunities will exist to alter risk perception and evacuation behavior.
Figure 3.
Research Questions
The following research questions are addressed in this study:
1) What factors impacted a household’s decision to evacuate?
2) What role did geographic proximity to the hazard play in influencing risk perception?
3) What information sources were relied on for warning information and updates?
4) What protective actions have households taken to reduce their risk?
Methodology
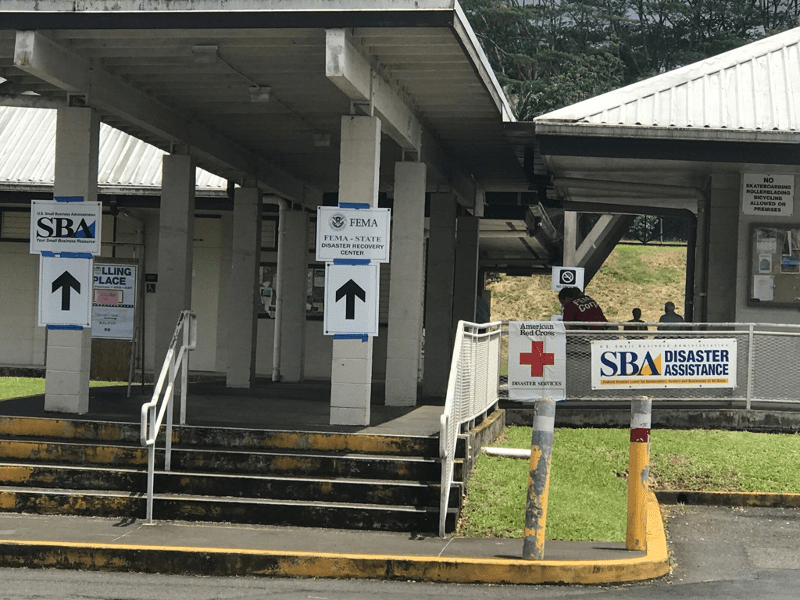
To answer these research questions, we traveled to the Big Island to investigate the interplay of factors affecting evacuation behavior of residents in the recent eruptions. We administered questionnaires to residents from communities throughout Puna District (see Figure 4) from Monday, July 30 to Sunday, August 5, 2018, twelve weeks after the eruptions began. These dates were selected because of the uncertainty associated with the duration of hazards posed by Kīlauea and ongoing corresponding safety and accessibility concerns, which made it difficult to determine when we would be permitted to enter the field. We expected that the time period chosen for travel to the affected areas would ensure access to residents who would be returning to their homes, at least on a temporary basis. However, when we arrived, only one shelter at Pāhoa Regional Community Center, four miles from Leilani Estates, was open to evacuees. FEMA’s Disaster Recovery Center (DRC) locations in Pāhoa and Keaʻau, respectively, were operational and served as resources for local residents to apply for assistance (see Figure 5). Unfortunately, we were not granted permission to administer questionnaires to residents in and around these locations. As a result, we were forced to modify our sampling strategy to account for the hundreds of dispersed residents throughout the Puna District.
Figure 4.
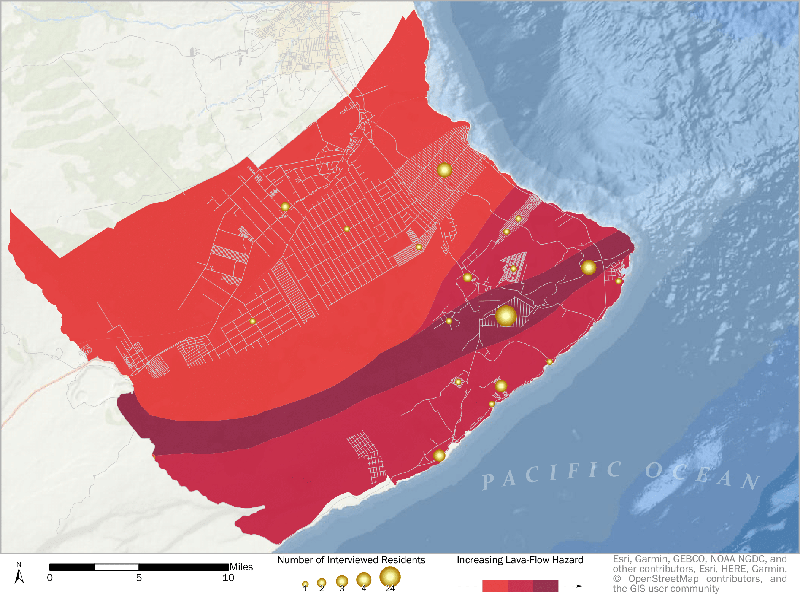
Figure 5.
Sampling Strategies
Respondents were recruited through a snowball sample of residents, as creating a random sample was not possible given the conditions under which respondents lived. We began recruitment at Puʻuhonua o Puna, a community relief organization that emerged at the intersection of Highway 130 and Highway 132 in Pāhoa two days after the eruptions began. Affectionately referred to as ‘the Hub’ by local residents, the grassroots initiative served as a “one-stop shop” for hot meals, bedding, clothing, non-perishable items, and even the opportunity to talk with local scientists and residents who were actively monitoring the eruptions on a daily basis, for those displaced by the lava. After receiving permission from the volunteer supervisor, we surveyed residents. During these surveys, the authors identified additional locations providing resources and information to residents. We then visited those locations to administer more questionnaires.
Questionnaire
Questionnaires are popular tools used by social scientists to acquire information on demographic characteristics, behaviors, attitudes, and beliefs, and are particularly useful in hazards research examining knowledge and perception of risk (Bird 200923). Building on work examining floods, hurricanes, and volcanic hazards (Webb 200624; Cutter, Emrich, Bowser, Angelo, and Mitchell 201125; Wei and Lindell 2017), our questionnaire instrument contained a combination of Likert-type scales, multiple choice questions, and open-ended items. This combination allowed for a more nuanced understanding of geographic considerations, demographics, preparedness measures, and hazard experiences. Further, the questions in the instrument encompass the five basic types of questions identified by Patton (199026): classification, behavioral, knowledge, perception, and feeling.
Each survey took at least 10 to 15 minutes to administer; many residents wished to share more with us given their frustrations and the emotional toll of the disaster, so completion time varied. Participants also signed an informed consent form to participate in the study and, if requested, were given our contact information in case they had further questions. A total of 57 questionnaires were administered to residents in the study area.
Respondent Characteristics
The first part of the survey asked questions regarding household attributes. Table 1 summarizes the responses to the length of residence inquiries. Over 75 percent of respondents have resided in Hawai‘i for a minimum of 10 years and were accustomed to island life. Many individuals surveyed indicated that they were transplants from the Mainland, while others were born and raised on the Hawaiian Islands, suggesting a strong attachment to place. Nearly 40 percent of respondents stated that they have lived in their current community for less than 10 years. Further, over half of respondents surveyed have resided in their current home for less than 10 years. While length of residence is an important factor to consider in disaster prone areas because it can affect preparedness and response behaviors, most respondents interviewed were keenly aware of the natural hazards in their communities. Of the total respondents surveyed, more than half were female. Interestingly, 50 percent of respondents were over the age of 60 (See Table 2). Numerous studies highlight the role of age in influencing one’s social vulnerability to disaster (Cutter, Mitchell, and Scott 200027; Cutter, Boruff, and Shirley 200328). For example, elderly individuals may have vision or hearing impairments that impact their ability to interpret warning messages. Similarly, mobility constraints may limit an elderly individual’s ability to evacuate in a disaster. Almost 72 percent of respondents surveyed indicated that their ethnic background was white.
Table 1.
| Survey Respondent Characteristics | Total Number of Responses | Percentage of Survey Responses |
|---|---|---|
| Length of Residence in the State of Hawaii (Years) | ||
| 0-4 | 3 | 5.36 |
| 5-9 | 12 | 21.43 |
| 10-14 | 11 | 19.64 |
| 15-19 | 5 | 8.93 |
| 20-24 | 5 | 8.39 |
| 25-29 | 3 | 5.36 |
| 30-34 | 4 | 7.14 |
| 35-39 | 5 | 8.39 |
| 40-44 | 4 | 7.14 |
| 45-59 | 1 | 1.79 |
| 50-54 | 1 | 1.79 |
| 55-69 | 0 | 0 |
| 60+ | 2 | 3.57 |
| Length of Residence in Your Current Community (Years) | ||
| 0-4 | 7 | 12.73 |
| 5-9 | 14 | 25.45 |
| 10-14 | 12 | 21.82 |
| 15-19 | 10 | 18.18 |
| 20-24 | 2 | 3.64 |
| 25-29 | 7 | 12.73 |
| 30-34 | 1 | 1.82 |
| 35-39 | 1 | 1.82 |
| 40-44 | 1 | 1.82 |
| 45-59 | 0 | 0 |
| 50-54 | 0 | 0 |
| 55-69 | 0 | 0 |
| 60+ | 0 | 0 |
| Length of Residence in Your Current Home (Years) | ||
| 0-4 | 21 | 38.18 |
| 5-9 | 11 | 20.00 |
| 10-14 | 12 | 21.82 |
| 15-19 | 7 | 12.73 |
| 20-24 | 1 | 1.82 |
| 25-29 | 3 | 5.45 |
| 30-34 | 0 | 0 |
| 35-39 | 0 | 0 |
| 40-44 | 0 | 0 |
| 45-59 | 0 | 0 |
| 50-54 | 0 | 0 |
| 55-69 | 0 | 0 |
| 60+ | 0 | 0 |
Table 2.
| Survey Respondent Characteristics | Total Number of Responses | Percentage of Survey Responses |
|---|---|---|
| Gender | ||
| Male | 25 | 44.64 |
| Female | 31 | 55.36 |
| Age | ||
| 18-29 | 1 | 1.79 |
| 30-39 | 4 | 7.14 |
| 40-49 | 14 | 25 |
| 50-59 | 9 | 16.07 |
| 60+ | 28 | 50 |
| Ethnicity | ||
| Asian | 2 | 3.33 |
| Black or African-American | 0 | 0 |
| Hawaiian or Other Pacific Islander | 5 | 8.33 |
| Hispanic or Latino | 0 | 0 |
| Native American | 3 | 5 |
| Other | 7 | 11.67 |
| White | 43 | 71.67 |
Table 3 summarizes the household characteristics. Over 70 percent of respondents owned their home. It is worth noting that one individual was living in their car, as they were limited financially and did not have any other options after evacuating. Nearly 75 percent of respondents surveyed had only one or two people living in their household. Less than 20 percent of the respondents had at least one individual under the age of 18 living in their households. Nearly 34 percent of those surveyed had one or two individuals over the age of 65 living in their households, which can present challenges for evacuation and comprehension of warning information. As shown in Table 4, respondents were well educated; all but one respondent had earned at least a high school diploma or general education diploma (GED). Interestingly, almost half of those surveyed earned a graduate degree or other advanced degree. In terms of occupation, nearly 30 percent of respondents were retired, more than 26 percent worked in other occupations not listed, more than 14 percent worked in education and health services, and almost 11 percent worked in construction. During interviews, many residents echoed that they were retired and on a fixed income, which contributed to worry and frustration over the status of their homes and the ongoing eruptions. Despite the fact that the sample was rather well educated, this did not translate to higher earnings for many. Over 33 percent of respondents earn household incomes less than $25,000. These are likely retirees or residents working hourly jobs in fields such as construction. This can also present challenges when considering hazard mitigation measures, such as the purchase of insurance to protect property from future losses or relocation outside of the lava flow zone.
Table 3.
| Survey Respondent Characteristics | Total Number of Responses | Percentage of Survey Responses |
|---|---|---|
| Home Ownership | ||
| Own | 40 | 71.43 |
| Rent | 15 | 26.79 |
| Other | 1 | 1.79 |
| Number of People Living in Household | ||
| 1 | 21 | 36.84 |
| 2 | 21 | 36.84 |
| 3 | 6 | 10.53 |
| 4 | 5 | 8.77 |
| 5 | 3 | 5.26 |
| 6 | 0 | 0 |
| 7 | 0 | 0 |
| 8 | 1 | 1.75 |
| People Under Age 18 Living in Household | ||
| 0 | 46 | 80.7 |
| 1 | 4 | 7.02 |
| 2 | 6 | 10.53 |
| 3 | 1 | 1.75 |
| People Over Age 65 Living in Household | ||
| 0 | 38 | 66.67 |
| 1 | 13 | 22.81 |
| 2 | 6 | 10.53 |
Findings
By the time we arrived in Hawaiʻi, it was the 90th day of the eruptions. The record for longest eruption in the lower East Rift Zone had been broken just the day before. A report published by the United States Geological Survey Hawaiian Volcano Observatory (USGS HVO) on July 15, 2018, indicated that the eruptions could continue for months to years (USGS HVO 2018). This uncertainty served to both encourage and discourage households to evacuate during the eruptions.
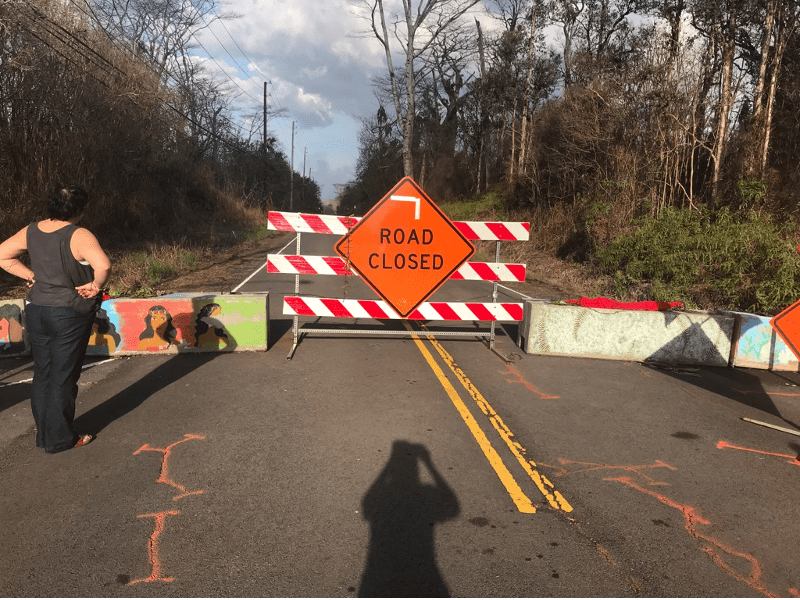
The factor most likely to influence a household to evacuate was the presence of natural hazards, particularly lava, fires, earthquakes, and volcanic gas emissions. Of the residents surveyed, over 60 percent identified natural hazards as one of the factors that encouraged them to evacuate (see Figure 6). Limited evacuation routes, utility disruptions, the presence of government officials, and fear and anxiety were mentioned at roughly the same frequency as reasons to evacuate. Being a rural area, the street network in Puna District was already fairly limited before May 3. As lava continued to spread, fewer streets were available for residents if they chose to evacuate (see Figure 7). Highway 130 became the primary evacuation route for residents in Kalapana, ‘Opihikao, Kapoho, and Vacationland after segments of Highways 132 and 137 closed. There were very real concerns about this, as a section of Highway 130 had already been damaged. Where cracks had formed in Highway 130, the County had installed metal plates to keep the road open. In addition to damaged infrastructure, the speed of the lava flow complicated evacuation efforts. Residents and animals caught off guard were forced to be rescued by helicopter, and at least one instance was referenced where an individual was assisted by a drone. When the eruptions first began, the decision was made to shut off electricity to areas located adjacent to the fissures. Puna District had existing issues regarding utilities, such as poor cell phone coverage. After lava claimed utility poles and a cell phone tower, some households lost their ability to communicate with officials should they need assistance. Households that felt compelled to evacuate due to the presence of government officials expressed fear of repercussions, such as arrest. Research suggests that while ordering forced evacuations may reduce fatalities, long-term problems, such as the loss of trust in emergency management officials and community leaders, may occur. Further, Whiteford and Tobin (200929) argue that forced evacuation is particularly harmful for vulnerable populations “because it divides communities, uses fear tactics to initiate the evacuation, and often unfairly targets people with limited resources.” Not surprisingly, individuals who reported evacuating for this reason also stated that they would not evacuate in the future if prompted by officials to do so. The unknowns and constantly changing conditions instilled a sense of fear in some residents, and for others, the anxiety of experiencing another volcanic eruption was too much to stay in their home. It is not uncommon for communication issues to emerge between emergency managers, scientists, and the public that can reduce evacuation compliance (Bird, Gisladottir, and Dominey-Howes 200930). As a result, strategies should be developed and tailored to target diverse audiences, as every community has different needs that must be addressed in a disaster (Paton, Smith, Daly, and Johnston 2008). Other reasons to evacuate, which each accounted for fewer than 5 percent of responses, included a loss of harvest and employment opportunities. A number of households in Puna District live entirely off the grid and off the land, and a loss of harvest would leave them unable to support themselves for an extended period of time.
Figure 6.
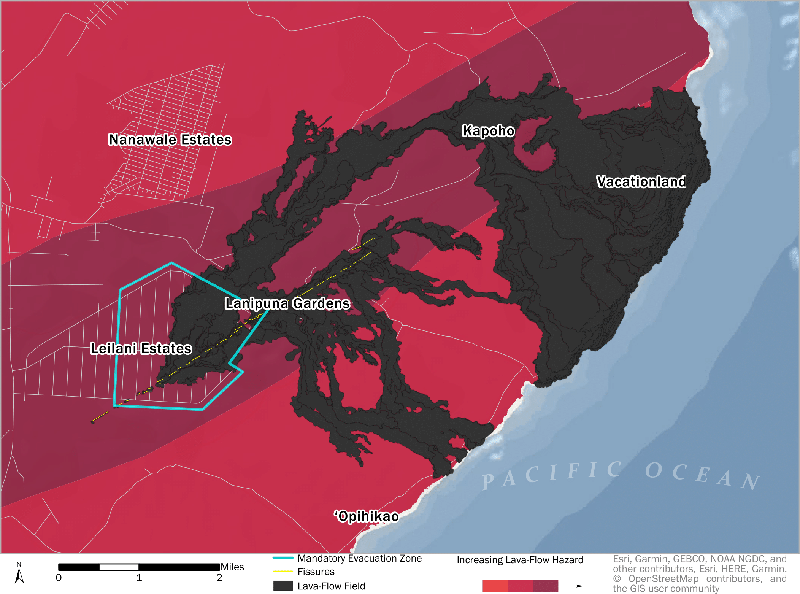
Figure 7.
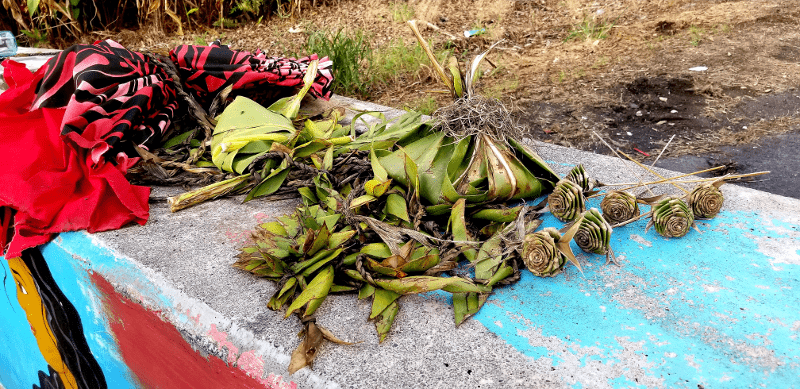
Inversely, the factor most likely to influence a household to shelter in place was that residents did not want to relocate. People wanted to remain in their homes and their neighborhoods. There was a strong sense of community that extended beyond the subdivisions, and it was clear that residents wanted to preserve that (see Figure 8). Despite being partially inundated by lava, the Leilani Estates Board was still holding regular meetings with residents. These meetings were recorded and shared on YouTube, which increased accessibility for those unable to attend. We heard countless stories of neighbors helping neighbors. This is the very story of Puʻuhonua o Puna, where the community rallied together to support each other. These efforts fostered social connections at a time where some individuals reported feeling cut off from the world. Despite the ongoing volcanic activity occurring around them, residents reported that they perceived little immediate threat. This finding is consistent with research undertaken by Paton, Smith, Daly, and Johnston (2008). Instead, these residents felt that looting and crime were of a greater threat to their property. Fear and anxiety, once again, had an influence on a household’s decision to evacuate. In this instance, it was due to individuals prizing their relationships and the homes that they have built. The least common factors, which were each reported at a frequency of less than 5 percent, include the economic burden of evacuating, an unwillingness to leave animals behind, a desire to maintain personal space, the ability to decide what’s best for their household, distrust of government officials, and faith. The majority of households, nearly 90 percent, reported animal ownership, though only 59 percent reported evacuating with their animals. For some residents, they received little to no warning before they were forced to evacuate their homes. In these situations, animals were often left behind. The response from the community was the Hawaiʻi Lava Flow Animal Rescue Network, where individuals volunteered to rescue pets, livestock, and wildlife threatened by the lava flow via traps and helicopter. The praises of community-driven efforts were met with criticism towards the local government response. The most common issue we heard was that information was inaccurate and delayed in comparison to what was being widely shared across social media at all hours of the day. When faith is mentioned, it is always with regard to the goddess of fire and volcanoes. She is affectionately referred to as Madame or Tūtū Pele, and it is her will that determines what land is reclaimed by lava. In hopes that Madame Pele will pass by their homes, residents leave hoʻokupu, which are gifts or offerings. At a barricade in Leilani Estates, located at the intersection of Leilani Avenue and Pomaikai Street, we saw a display of hoʻokupu left for Madame Pele that included alcohol, kapa, cordage, and Ti leaves crafted into a lei, pūʻolo, and roses (see Figure 9).
Figure 8.
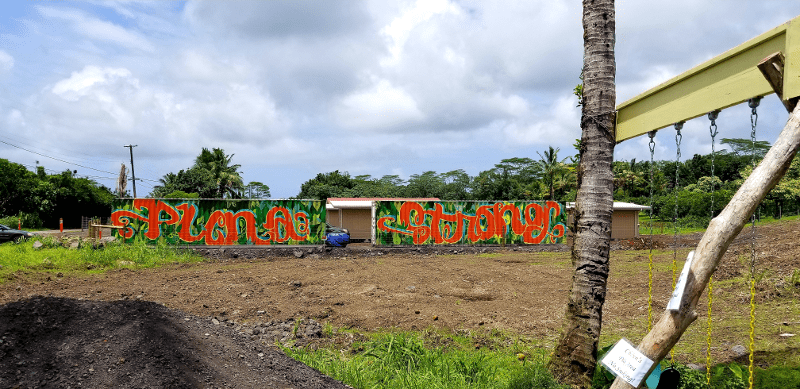
Figure 9.
Over 50 percent of the residents surveyed lived in a subdivision partially or completely destroyed as a result of the eruptions: Leilani Estates and Kapoho, which are located in Lava Zone 1, and Vacationland in Lava Zone 2. Of the households surveyed, almost 60 percent reported evacuating. More than 57 percent of evacuees left as a result of a mandatory evacuation, which was issued for areas in immediate proximity to the hazards. Given the various natural processes involved in the eruptions, areas far from the evacuation zone were intermittently exposed to hazards such as earthquakes, vog, laze, volcanic gas emissions, ash, and Pele’s hair. It was reported to us by a resident that the air quality in Kona, which is located over 70 miles away, suffered as a result of the ongoing volcanic activity. These hazards led over 8 percent of households surveyed to evacuate as needed, without a mandatory or voluntary order issued. Geographic proximity to the immediate hazard led many to evacuate, but the widespread exposure of multiple hazards also contributed to evacuations outside what would be regarded as the at risk area.
Residents were asked about the information sources they relied on for emergency communications before and after they evacuated their homes. Depending on where residents evacuated to, certain sources may be more or less accessible. Internet sources were the most commonly utilized resource, before and after an evacuation, with an increase of nearly 5 percent after evacuating. Reliance on local television stations, national news networks, and newspapers also increased following a household evacuation. Local radio stations, other cable stations, and word of mouth, were less popular after evacuation.
More than 64 percent of residents reported that they have taken protective actions to reduce their household risk to volcanic hazards. The most common action taken was following updates, as well as warnings and advisories, on the eruptions. Internet sources and their popularity, particularly social media, offered invaluable updates as the eruptions progressed. A Facebook group called “Hawaii Tracker” emerged as the go-to resource for many residents. The group is public, which made it accessible for residents to view with and without a Facebook account. Individuals with Facebook accounts were able to post real-time updates, along with pictures and video, to the group. While we were at Puʻuhonua o Puna, we witnessed firsthand a report of a wildfire to the group before it was confirmed by the authorities. This rapidly available information allowed some residents ample time to evacuate, even with their belongings and animals, before an official evacuation order was issued.
More proactive actions, such as having a stocked emergency kit and existing homeowner’s insurance before May 3, 2018, were reported by 28 percent and 16 percent of respondents, respectively. It should be noted that having homeowner’s insurance does not necessarily guarantee that the policy will cover the damages associated with eruptions. Residents described how challenging it was to find a homeowner’s insurance policy with all-hazards coverage, and the few options available were priced based on which lava flow hazard zone you resided in. Only one household from Lava Zone 1 indicated that they had all-hazards coverage prior to the eruptions. More than 18 percent of residents stated that they have taken other measures to reduce risk, such as preparing and monitoring rainwater catchment systems to prevent damage and contamination to their drinking water supply. As many homes rely on rainwater catchment systems, taking early steps to protect their water supply from increased levels of lead and fluoride from volcanic gas emissions will minimize public health risks and the cost and time needed to recover.
Future Work
Our research initially only sought to identify the characteristics of the population that either encouraged or discouraged evacuation, with the intention of shaping future evacuation planning in Hawaiʻi County via government agencies. One day at Puʻuhonua o Puna changed that, and community resilience has since become the focus moving forward. The community successfully mobilized in response to the current eruptions, which suggests that residents could also come together to prepare for future events.
There is a need for greater emphasis on preparedness, as there were difficulties for some residents to acquire certain materials, such as respirators and anti-dust masks, as the eruptions were ongoing. We quickly became aware that many households were willing to invest in preparedness and mitigation, but they also reported struggling to find relevant resources for volcanic hazards. This is an issue that was identified during our interviews, as residents were unable to get all the information that was important to them in a single emergency alert. By improving accessibility, households and communities can decide for themselves which plans and projects to establish based on their particular needs. For households that would have evacuated but were unable to do so, planning at the community level before a disaster could serve to address those factors.
Our findings also suggest that the level of trust in emergency management officials played a significant role in residents’ decisions to evacuate. The quality of the relationship between communities and agencies, such as the Civil Defense Agency, influences risk perception and decision-making processes in disasters. As demonstrated by other studies, if people believe that their relationship with emergency management officials is fair and that officials are acting in the community’s best interests, the likelihood of individuals engaging in preparedness and hazard mitigation actions increases (Paton, Smith, Daly, and Johnston 2008). In other words, community members, emergency managers, and government officials must work together to manage risk. Many of the respondents’ interviewed stressed that they did not feel involved in the decision-making processes during the recent eruptions, and were not satisfied with responses to their questions from agency officials at public meetings, which contributed to their frustrations with the overall response. It is vital that emergency management officials engage with residents in the Puna District and other vulnerable locations on the island in order to develop new and update existing hazard preparedness, mitigation, response, and recovery plans. Ultimately, if the goal is to increase community resilience in Puna, residents must feel empowered and supported by emergency management officials.
Kīlauea Volcano has been actively erupting for the past 35 years, and there will continue to be episodes of high volcanic activity in the future (USGS HVO 2018a31). Given the limited predictability of when and where these episodes will occur, there is a need to better equip residents before, during, and after a volcanic eruption. With this and future research, we can continue learning about the influencing factors from these eruptions and use that knowledge to create better plans for the communities in the Puna District.
Acknowledgements. Mahalo nui to the people of Puna, who welcomed us with kindness during an incredibly difficult time. We cannot express how much we appreciate your sharing stories with us and your support of our research.
GIS Data Sources
United States Census Bureau. (2012). Census County Divisions (Districts) – 2010. Hawaiʻi State Office of Planning, Hawaiʻi Statewide GIS Program. Accessed September 10, 2018. http://geoportal.hawaii.gov/datasets/2010-census-county-divisions-districts.
United States Census Bureau. (2012). Roads – County of Hawaii Street Centerlines – 2010. State Hawaiʻi Office of Planning, Hawaiʻi Statewide GIS Program. Accessed September 20, 2018. http://geoportal.hawaii.gov/datasets/roads-hawaii-county.
United States Geological Survey Hawaiian Volcano Observatory. (1991). Lava Flow Hazard Zones. Hawaiʻi State Office of Planning, Hawaiʻi Statewide GIS Program. Accessed September 10, 2018. http://geoportal.hawaii.gov/datasets/volcano-lava-flow-hazard-zones.
United States Geological Survey Hawaiian Volcano Observatory. (2018). Preliminary map of the response to the 2018 lower East Rift Zone eruption of Kīlauea Volcano, Island of Hawaii. Accessed September 11, 2018. https://www.sciencebase.gov/catalog/item/5afe0ba7e4b0da30c1bdb9db.
References
-
Hawai’i County Planning Department. (2008). Working Paper No. 1: Elements of a Growth Management Strategy. Accessed September 23, 2018. http://www.hawaiicountycdp.info/puna-cdp/draft-plan-recommendations/final-draft-appendix-and-related-documents/pcdp-appendix-technical-documents/WP%20-1%20-%20Growth%20Management.pdf/at_download/file. ↩
-
Cooper, G. and Daws, G. Land and Power in Hawaii: The Democratic Years. Honolulu, HI: Benchmark Books, 1985. ↩
-
Hawai’i County Planning Department. (2008). Puna Community Development Plan. Accessed May 18, 2018. http://www.hawaiicountycdp.info/puna-cdp/draft-plan-recommendations/1%20%20Puna%20CDP%20amended%20Nov-2011.pdf/view. ↩
-
State of Hawaiʻi. (2018).Draft 2018 State of Hawaiʻi Hazard Mitigation Plan Update. Accessed October 1, 2018. https://dod.hawaii.gov/hiema/files/2018/06/Draft-2018-State-of-Hawai%E2%80%99i-Hazard-Mitigation-Plan.pdf. ↩
-
Perry, R. W., Lindell, M.K., and Greene, M. (1982). Threat perception and public response to volcano hazards. Journal of Social Psychology, 116, no. 2: 199–204. ↩
-
Tobin, G.A. and Whiteford, L.M. (2002). Community resilience and volcano hazard: The eruption of Tungurahua and evacuation of the Faldas in Ecuador. Disasters 26, no. 1: 28-48. ↩
-
Gregg, C.E., Houghton, B.F., Paton, D., Swanson, D.A., and Johnston, D.M. (2004). Community preparedness for lava flows from Mauna Loa and Hualalai volcanoes, Kona, Hawai’i. Bulletin of Volcanology, 66, no. 6: 531-540. ↩
-
Dash, N. and Gladwin, H. (2007).Evacuation decision making and behavioral responses: Individual and household. Natural Hazards Review, 8, no. 3: 69-77. ↩
-
Gregg, C.E., Houghton, B.F., Paton, D., Swanson, D.A., Lachman, R., and Bonk, W.J. (2008). Hawaiian cultural influences on support for lava flow hazard mitigation measures during the January 1960 eruption of Kīlauea volcano, Kapoho, Hawai‘i. Journal of Volcanology and Geothermal Research, 172, no. 3-4: 300-307. ↩
-
Gaillard, J-C. (2008). Alternative paradigms of volcanic risk perception: The case of Mt. Pinatubo in the Philippines. Journal of Volcanology and Geothermal Research, 172, no. 3-4: 315-328. ↩
-
Haynes, K., Barclay, J. and Pidgeon N. (2008). Whose reality counts? Factors affecting the perception of volcanic risk. Journal of Volcanology and Geothermal Research, 172, no. 3-4: 259-272. ↩
-
Lavigne, F., De Coster, B., Juvin, N., Flohic, F., Gaillard, J., Tezier, P., Morin, J., and Sartohadi, J. (2008). People's behaviour in the face of volcanic hazards: Perspectives from Javanese communities, Indonesia. Journal of Volcanology and Geothermal Research, 172, no. 3-4: 273-287. ↩
-
Paton, D., Smith, L., Daly, M., and Johnston D. (2008). Risk perception and volcanic hazard mitigation: Individual and social perspectives. Journal of Volcanology and Geothermal Research, 172 , no. 3-4: 179-188. ↩
-
Gavilanes-Ruiz, J. C., Cuevas-Muñiz, A., Varley, N., Gwynne, G., Stevenson, J., Saucedo-Girón, R., Pérez-Pérez, A., Aboukhalil, M., and Cortés-Cortés, A. (2009). Exploring the factors that influence the perception of risk: The case of Volcán de Colima, Mexico. Journal of Volcanology and Geothermal Research, 186, no. 3-4: 238-252. ↩
-
Bird, D., Gísladóttir, G., and Dominey-Howes, D. (2011). Different communities, different perspectives: issues affecting residents’ response to a volcanic eruption in southern Iceland. Bulletin of Volcanology, 73, no. 9: 1209-1227. ↩
-
Leathers, M. M. (2014). Risk perception and beliefs about volcanic hazards: A comparative study of Puna district residents” Graduate Theses and Dissertations. University of South Florida Scholar Commons. ↩
-
Wei, H.L. and Lindell, M.K. (2017). Washington households’ expected responses to lahar threat from Mt. Rainier. International Journal of Disaster Risk Reduction, 22, 77-94. ↩
-
Slovic, P. (1987). Perception of Risk. Science, 236, 280-290. ↩
-
Burton, I, Kates, R. W., and White, G. F. (1993). The Environment as Hazard. 2nd ed. New York, NY: Guilford. ↩
-
Tobin, G.A. and Montz, B.E. (1997). Natural Hazards: Explanation and Integration. New York: Guilford. ↩
-
Smith, K. (2013). Risk Assessment and Disaster Management.” In Environmental Hazards: Assessing Risk and Reducing Disaster. 6th ed. London: Routledge. ↩
-
Dash, N. and Gladwin, H. (2005).Evacuation decision making and behavioral responses: Individual and household. Pomona, CA: Hurricane Forecast Socioeconomic Workshop. ↩
-
Bird, D. (2009). The use of questionnaires for acquiring information on public perception of natural hazards and risk mitigation—a review of current knowledge and practice. Natural Hazards and Earth System Sciences, 9, no. 4: 1307-1325. ↩
-
Webb, J.J. (2006). Vulnerability to Flooding in Columbia County, PA: The Role of Perception and Experience among the Elderly. Papers and Proceedings of the Applied Geography Conferences, 29, 168-176. ↩
-
Cutter, S. L., Emrich, C. T., Bowser, G., Angelo, D., and Mitchell, J. T. (2011). 2011 South Carolina Hurricane Evacuation Behavioral Study: Final Report. Columbia, SC: Hazards and Vulnerability Research Institute. ↩
-
Patton, M. Q. (1990). Qualitative Evaluation and Research Methods. 2nd ed. Thousand Oaks: Sage Publications. ↩
-
Cutter, S. L., Mitchell, J. T., and Scott, M. S. (2000). Revealing the vulnerability of people and places: A case study of Georgetown County, South Carolina. Annals of the Association of American Geographers, 90, no. 4: 713-737. ↩
-
Cutter, S, L., Boruff, B., and Shirley, L. (2003). Social vulnerability to environmental hazards. Social Science Quarterly, 84, 242-261. ↩
-
Whiteford, L. M., and Tobin, G. A. (2009). If the pyroclastic flow doesn’t kill you, the recovery will. In Political Economy of Hazards and Disasters, edited by E. C. Jones and A. D. Murphy, 155-176. Walnut Creek, California: Alta Mira Press. ↩
-
Bird, D, Gísladóttir, G., and Dominey-Howes, D. (2009). Resident perception of volcanic hazards and evacuation procedures. Natural Hazards and Earth System Sciences, 9, no. 1: 251-266. ↩
-
United States Geological Survey Hawaiian Volcano Observatory. (2018a). 2018a Preliminary Analysis of the ongoing Lower East Rift Zone (LERZ) eruption of Kīlauea Volcano: Fissure 8 Prognosis and Ongoing Hazards. Accessed July 15, 2018. https://volcanoes.usgs.gov/vsc/file_mngr/file-185/USGS%20Preliminary%20Analysis_LERZ_7-15-18_v1.1.pdf. ↩
Haney, J. & Havice, C. (2019). Factors Influencing Evacuation Behavior in Kīlauea Eruptions: An Examination of Residents in the Puna District, Hawaiʻi (Natural Hazards Center Quick Response Research Report Series, Report 289). Natural Hazards Center, University of Colorado Boulder. https://hazards.colorado.edu/quick-response-report/factors-influencing-evacuation-behavior-in-kilauea-eruptions-an-examination-of-residents-in-the-puna-district-hawai-i