How California’s 2019 Pre-Emptive Power Outages Shaped Perceptions and Behavioral Adaptations Related to Future Hazards
Publication Date: 2020
Abstract
Northern Californians experienced widespread pre-emptive power outages—also called public safety power shutoffs—from mid-October 2019 through early November 2019 intended to reduce risk of wildfire ignition. These outages, implemented to reduce the risk of wildfire, affected about 600,000 customers and caused major disruptions to the normal activities of affected households. This project leverages these power outages as a natural experiment to investigate how experience with an outage—as a tangible hazard and climate adaptation-related event—shaped risk perceptions, policy preferences, and behavior. This report focuses on the experiences impacts on public behavior and policy preferences of a representative sample of Californians within the Fall 2019 power shutoff areas.
Introduction
Public climate change risk perceptions and policy preferences exhibit strong geographic patterns that likely reflect the diverse influences of culture, vulnerability, and experience, among other factors. Of these, the role of experience is arguably the least understood (Howe et al., 20191). This research uses a novel survey designs to exploit recent Californian power outages as natural experiments. This allows researchers to identify the causal effects of experience on risk perceptions and preferences.
Pre-emptive power outages, also termed public safety power shutoffs (PSPS), are intended to reduce the risk of wildfire ignition and are likely to become more frequent in fire-prone landscapes like California as climate change exacerbates wildfire hazards. Experience with such outages is both an indirect experience of a hazard, as well as a direct experience with a decision related to climate change adaptation. PSPS outages can be widespread, affecting large populations. At the same time, they are also geographically delineated, which makes them optimal candidates for a natural experimental research design that compares proximate similar households at the boundaries of the event who either did or did not experience the outages. This study investigates how experiences with PSPS outages shapes risk perceptions and behavioral intentions related to hazard adaptation in the context of climate change. Results reveal the extent of responsiveness among diverse subnational populations to natural hazards and related adaptation decisions designed to reduce hazard risk.
We conducted an original survey of California residents in the immediate aftermath of multiple PSPS in Fall 2019. In this report, we summarize the experiences of a representative sample of Californians in the power outage areas during this period of reduced public service provision.
Literature Review
How do spatial heterogeneous risk-related experiences, such as climate-related disasters and disruptions, influence public perceptions and behaviors? For environmental hazards, direct personal experience of a hazard event has been found to strongly amplify risk perceptions (Wachinger et al., 20132), with several risk decision-making models situating experience as a primary determinant of risk mitigation and adaptation (Rogers & Prentice-Dunn, 19973; Lindell & Perry, 20004; Grothmann & Patt, 20055). At the same time, the experience of an event that does not cause personal harm—a “near-miss”—can also attenuate risk perceptions (Wachinger et al., 2013). Nevertheless, most natural hazards researchers agree that personal experience – while moderated by aspects of the event (e.g., type, magnitude, distance), individual (e.g., knowledge, previous experience, values, attitudes, emotions) and social context (e.g., media reports, peer influences, culture)—plays an important role in risk perceptions of future events, engagement with risk messages, and preparedness behaviors (Tierney et al., 20016; McGee et al., 20097; Zaalberg et al., 20098; Howe et al., 2019).
Despite this strong evidence for an effect of personal experience on risk perceptions, the dynamics of the effect over time and space have been investigated less often. For example, it is unclear how the effect of personal experience decays over time, or how the magnitude of the effect changes depending on proximity to the hazard event. In part, this is a function of feasibility. Existing research using traditional survey providers has relied on expensive, regional samples that rarely provide geographic resolution below the ZIP code level (Office of Consumer Affairs, 20149). Importantly, these survey providers usually cannot provide a representative sample of individuals who experience different forms of climate-related risks.
These questions are acutely important in debates over the effect of climate-related disasters and policy disruptions on the general public. Publics appear to react to climate-related risk experiences in politically heterogenous ways (Hazlett & Mildenberger, 202010). A growing body of research has examined the effect dispersed slow-developing climate effects—for example ambient temperature changes—on climate change attitudes. This effect is suggested both by experimental research in a laboratory setting (Risen & Critcher, 201111) as well as survey-based field studies (Li et al., 201112; Egan & Mullin, 201213; Zaval et al., 201414), in which respondents perceived the risks of global warming to be higher while experiencing warmer-than-normal weather. However, it is not clear how extreme events—other than temperature extremes—shape global warming risk perceptions. This includes climate-related policy disruptions like PSPS.
Methods
We began by creating a spatially disaggregated sampling frame that allowed us to target individuals who experienced at least one PSPS as well as groups of otherwise similar resident. During the fall 2019 PSPS events, we collected spatial polygon files from Pacific Gas and Electric (PG&E) for each successive shut-off event. We intersected all outage polygons to define the spatial extent of Californians who experienced one or more PSPS events in the PG&E service area during October and November 2019. We also recorded the number of overlapping outages experienced in each part of the service area.
We then defined a series of additional spatial zones using buffering methods. First, we defined a spatial zone containing all areas of California located within zero and one kilometers inside the outage zone boundaries. Second, we defined a spatial zone containing all areas of California located within zero and one kilometers outside the outage zone boundaries. Third, we defined a spatial zone containing all areas of California located within one and 20 kilometers outside the outage zone boundaries. For all zones, we excluded Sonoma County; active wildfires and evacuations associated with the 2019 Kincade Fire remained in effect during our survey period. Figure 1 illustrates these different spatial zones that structure our survey sampling frame.
Figure 1. Sampling Zones Associated with Public Safety Power Shut-off Events in Northern California, Fall 2019
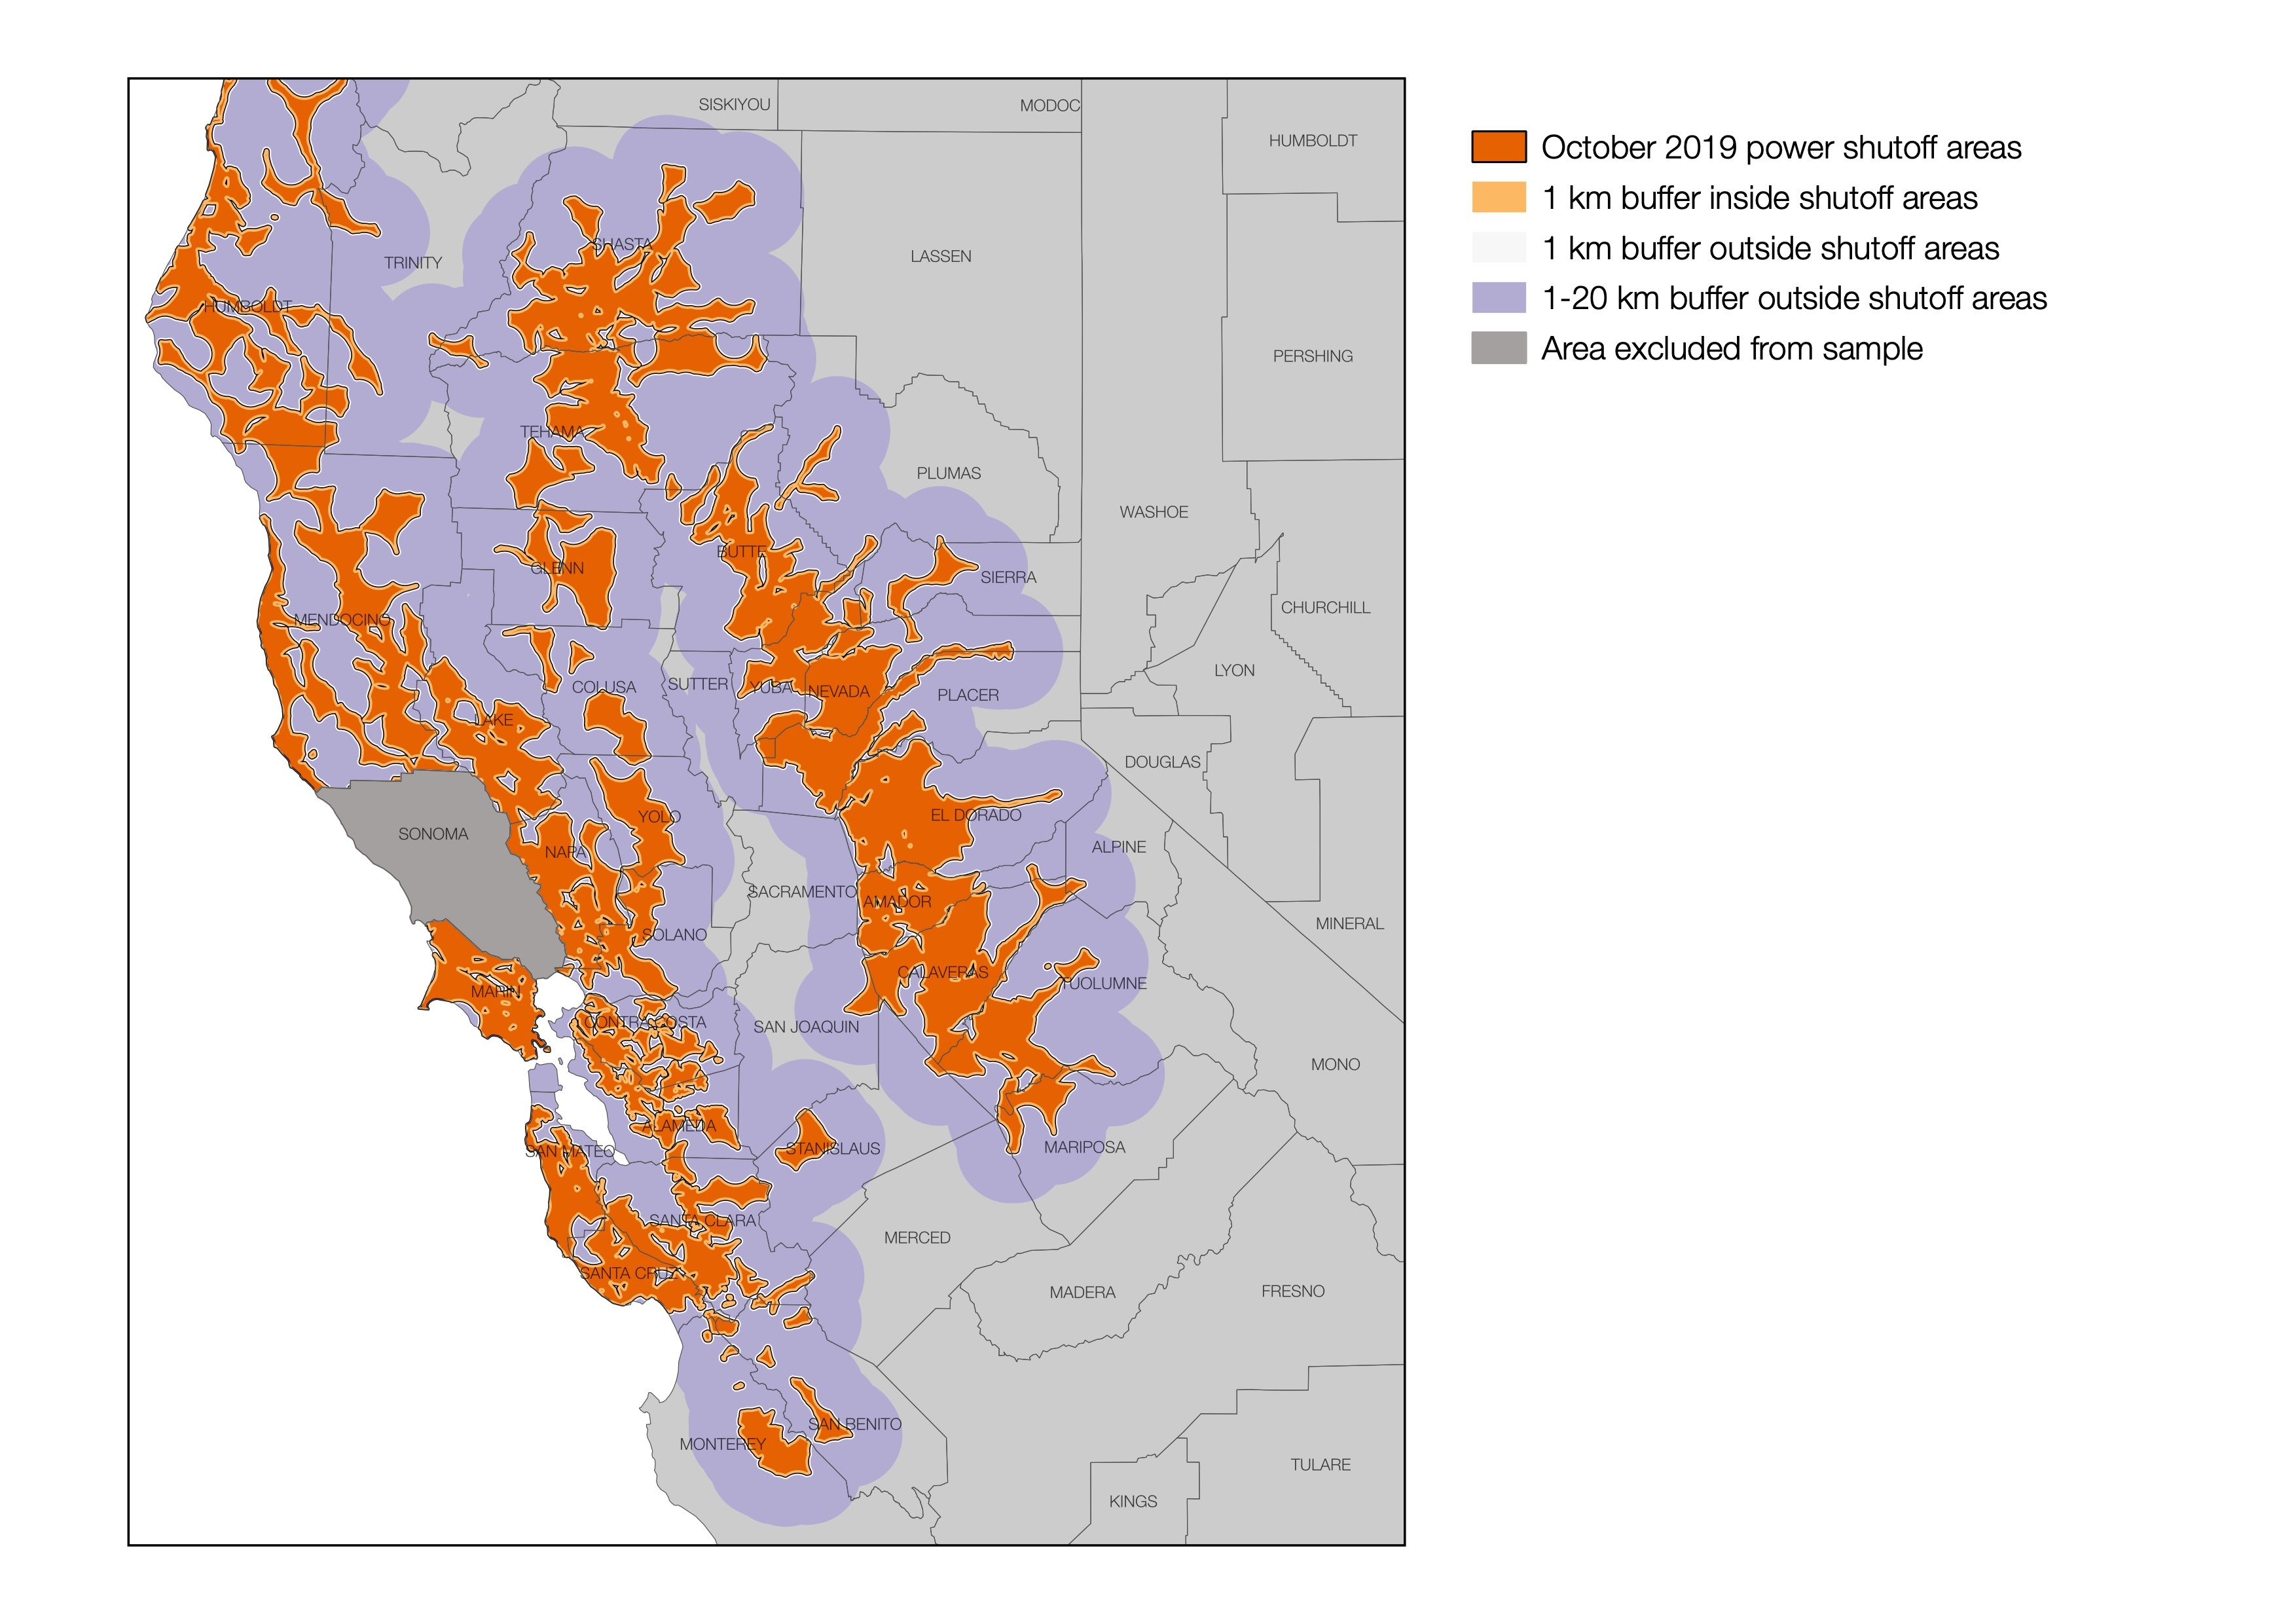
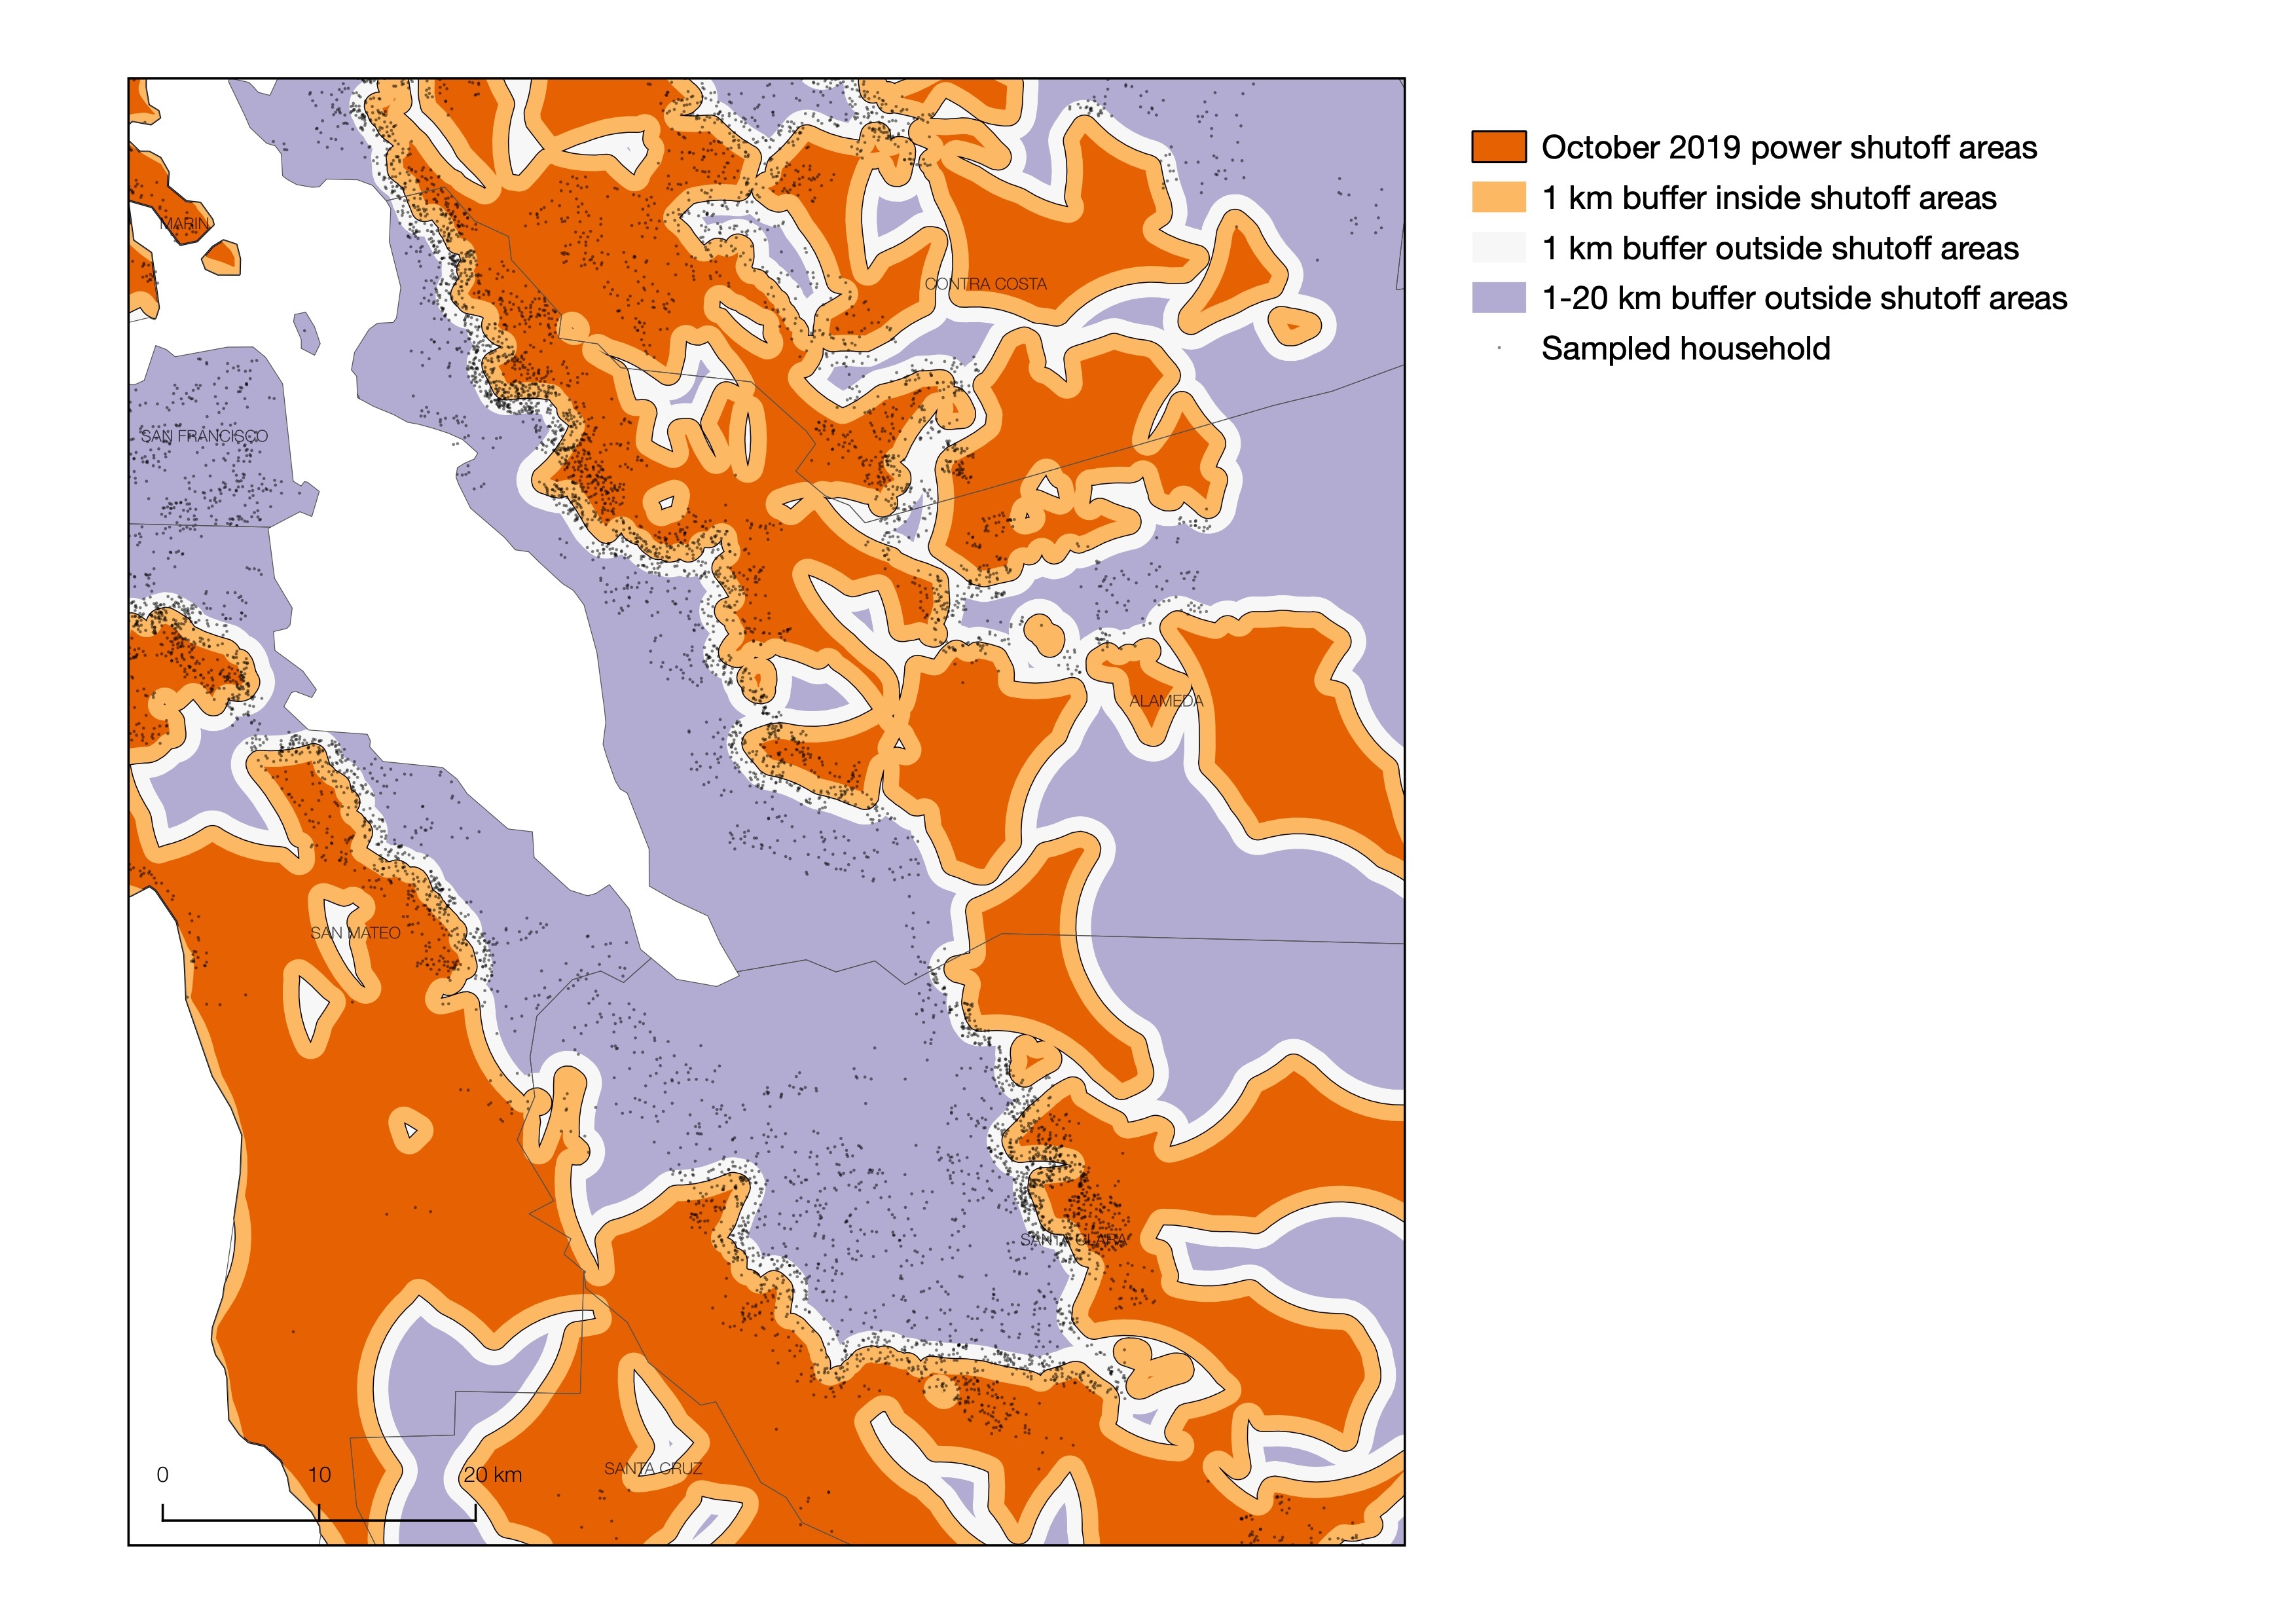
Using the WorldPop gridded 100-meter population dataset as a probability surface, we generated 1m points within Northern California county boundaries, weighted by population distribution. This point dataset simulated a random sample of the population within the state. For every point, we extracted its CalFire fire threat zone from CalFire gridded data as well as its census tract ID. We then subset this Northern California point sample layer by clipping to each of our four spatial zones: (1) 0-1 kilometers buffer outside outage boundaries, (2) 0-1 kilometers buffer inside outage boundaries, (3) 1-20 kilometers buffer outside outage boundaries, 4) actual outage boundaries. This created four-point sample layers for geocoding. Within each layer, we randomly sampled 6,000 points. Then, using Google API (via ggmap package), we reverse geocoded the coordinates of each sample point in all four layers. Reverse geocoding produced a street address (if available) for each point and a label indicating whether the address was a "premise" (Google's label for a dwelling unit). We then subset reverse geocoded points to only those with street addresses identified as premises. We removed duplicates. Finally, we randomly subset 3,000 addresses in each zone, except for the full outage zone, where we selected 6,000 addresses for our sample. In Figure 2 we visualize local-scale sampling points in the East Bay Area. In the Supplemental Information at the end of this report, we also provide other illustrative examples of our target sampling addresses.
Figure 2. Addresses Selected for Sampling in the East San Francisco Bay Area
We then generated a list of control addresses in Southern California that were as closely matched as possible to addresses in our sample within one kilometers inside and one kilometers outside the outage boundaries. First, we prepared a map of Southern California counties to use as a control dataset (San Luis Obispo, Santa Barbara, Ventura, Los Angeles, San Bernardino, Orange, Riverside, San Diego, Imperial). Again using the WorldPop gridded 100 meter dataset as a probability surface, we generated 500k points within these county boundaries, weighted by population distribution. Third, we took all sample addresses from Northern California within a 0-1 kilometers area outside and the 0-1 kilometers area inside the outage boundary; we calculated the proportions of population within each census tract within each fire threat zone. Using entropy balancing (via the eBal package in R), we generated weights for every Southern California census tract so that the weighted average of all Southern California tracts on a variety of characteristics matched the distribution of tract attributes in our Northern California sample. We generated weights based on the following characteristics: percent of census tracts that were unzoned, or under low, medium, high, and very high threat per CalFire threat zones; propensity scores for tract-level wildfire occurrence between 2000 and 2017, and between 2008 and 2017; average household size; unemployment rate; percent of tract residents who are homeowners; percent who are married; percent with Bachelor’s degree or higher; percent who speak English as first language; percent living in poverty; percent veterans; percent with jobs in management, business, science, and arts; percent with jobs in service sector; percent firefighters or working protective services; percent working in farm, fishing or forestry; percent White, Hispanic, or Black; percent who drive alone to work; percent who use public transit; and percent who work in state. We then randomly sampled, with replacement, from these census tracts, using the entropy balance weights as sampling weights. This produced a list of census tracts. We then sampled a point within each census tract in this list, and reverse geocoded these points as before. We included the first 3,000 addresses identified as premises.
Overall, this sampling process resulted in a list of 18,000 addresses: a representative sample of 6,000 addresses from within the PSPS outage zone, a representative sample of 3,000 addresses from zero to one kilometers inside the outage boundary, a representative sample of 3,000 addresses from zero to one kilometers outside the outage boundary, a representative sample of 3,000 addresses from one to 20 kilometers outside the outage boundary, and a sample of 3,000 Southern California addresses matched to Northern California sample addresses within one kilometers inside or outside the outage boundary.
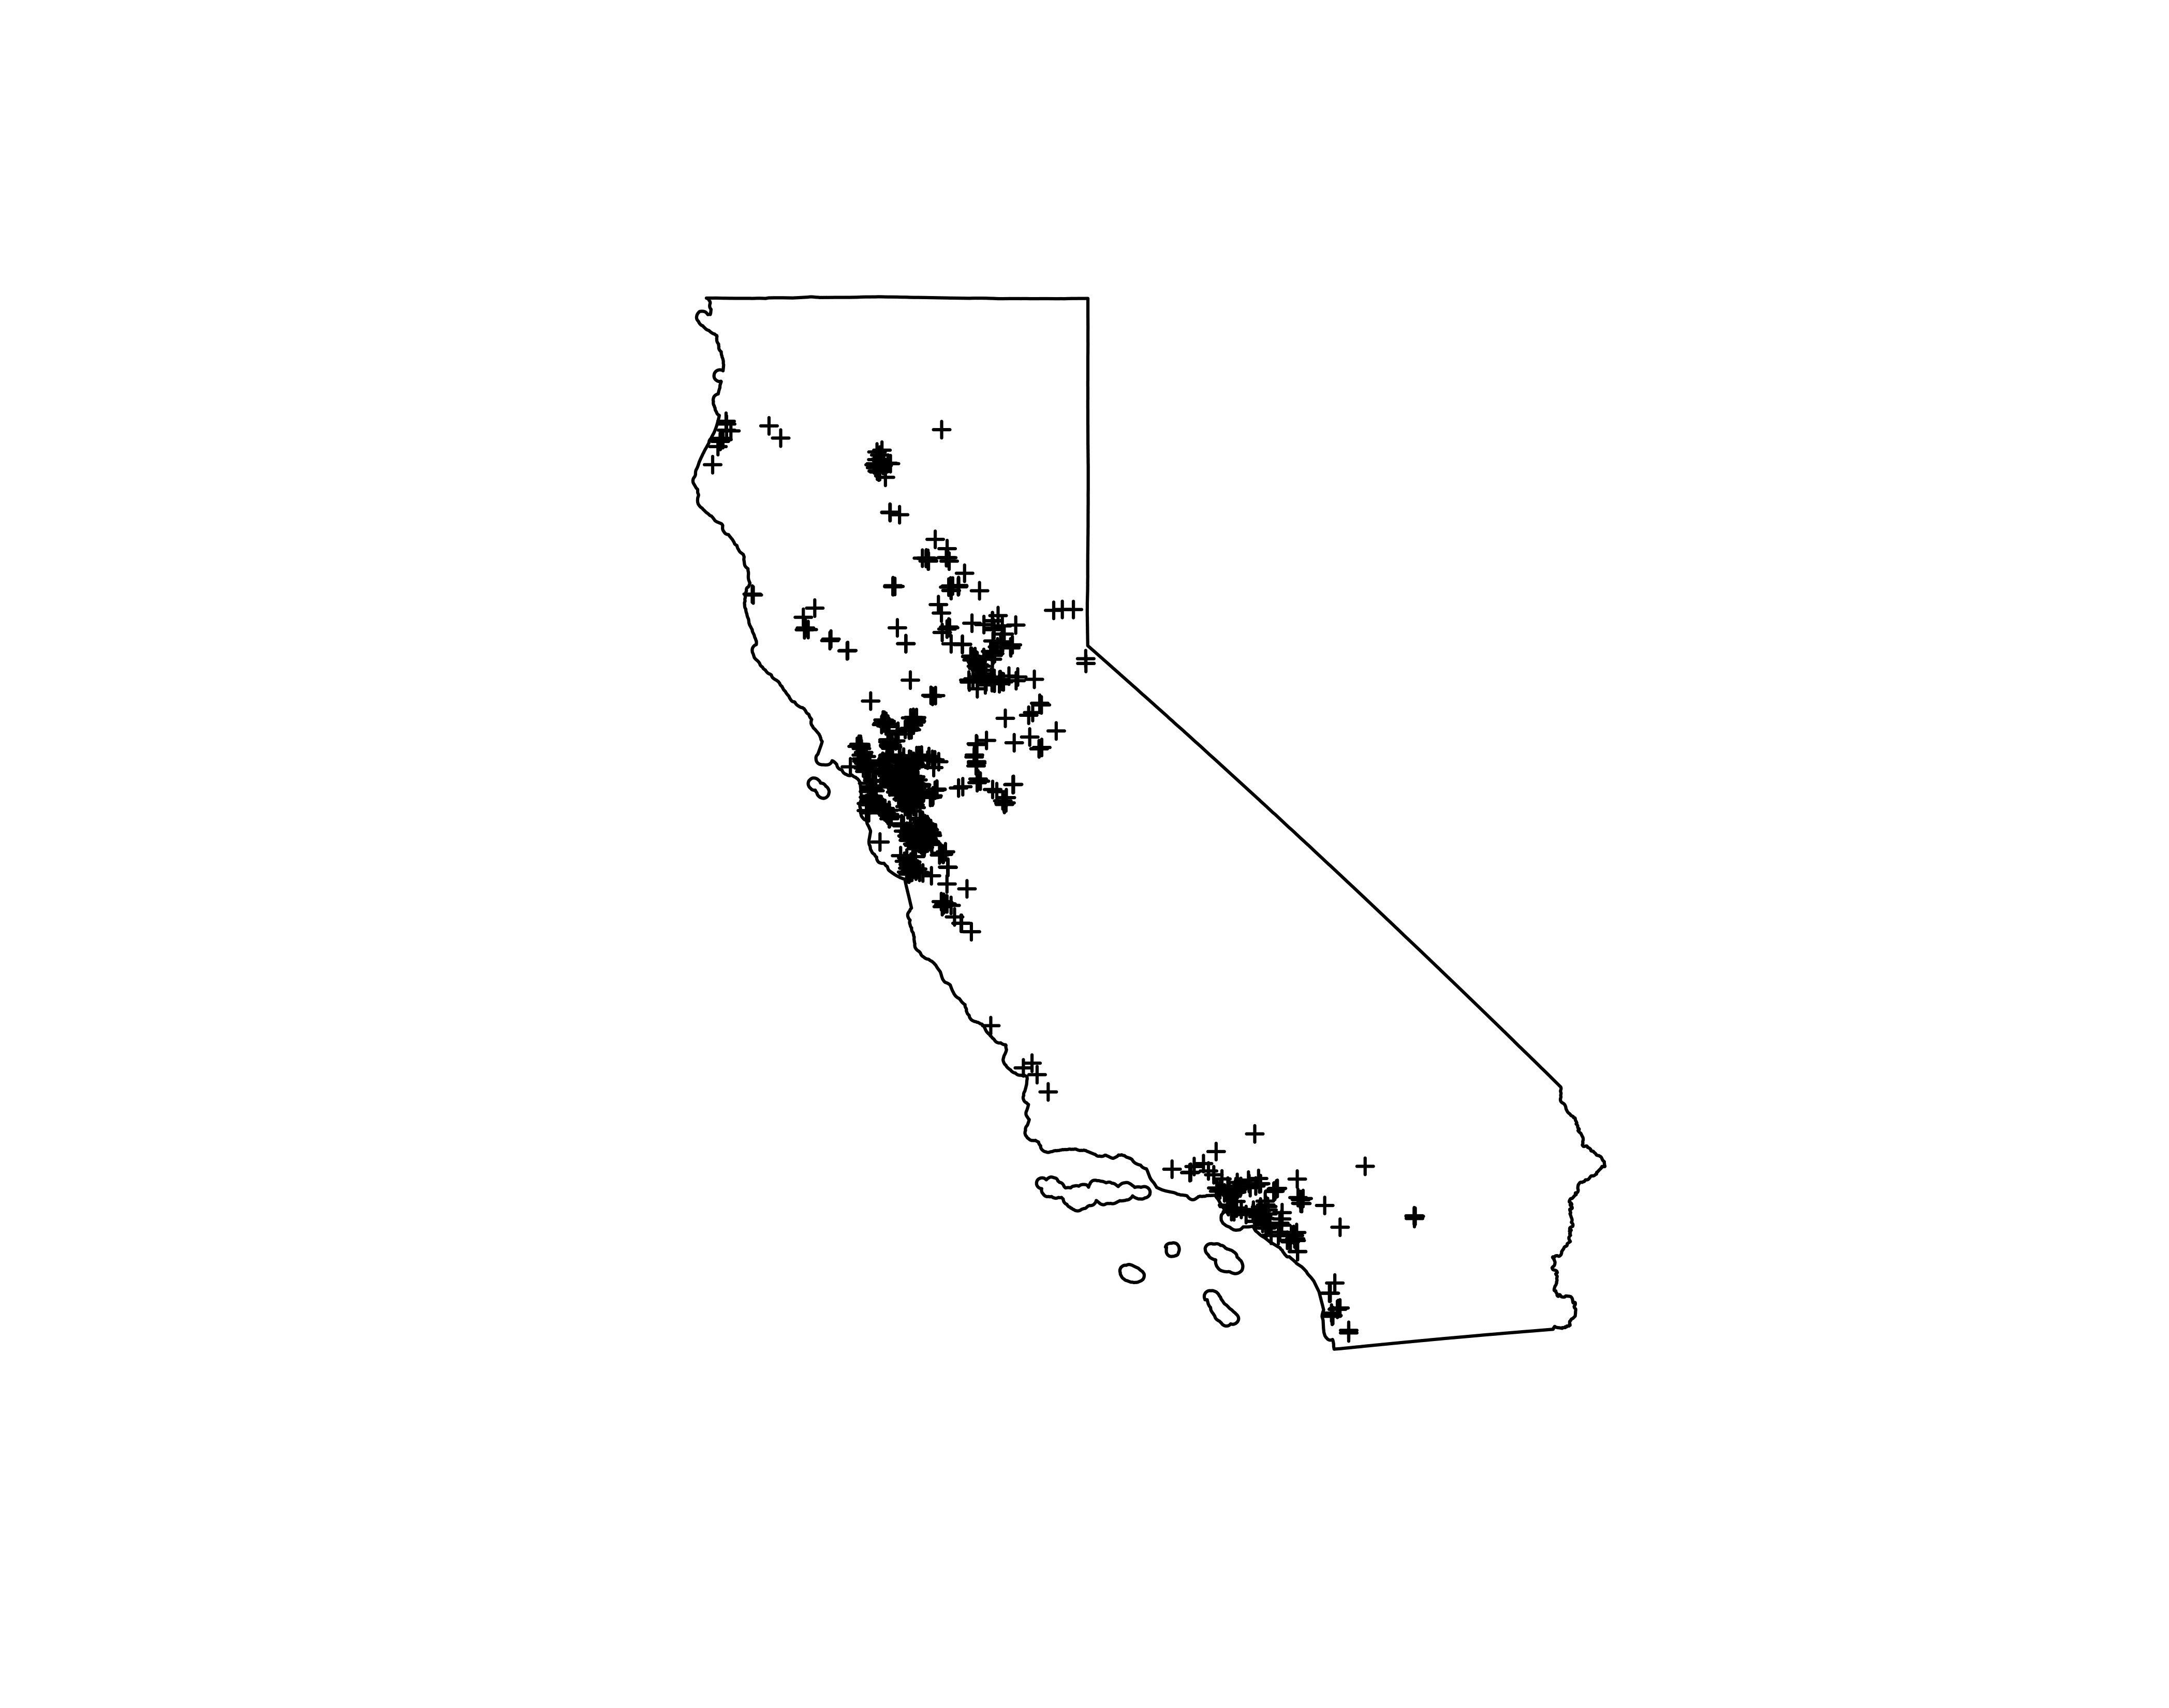
On November 14, 2019, we mailed a customized letter to each of these 18,000 addresses, inviting one resident from each household to participate in an online survey on California's electricity system (see Appendix 1 for an example recruitment letter). Each letter contained a customized URL so that we could identify the spatial location for every survey response. Respondents who completed our survey received a $5 digital gift card by email that they could redeem at dozens of different online retailers, or that they could donate to a charity of their choice. As a result of our initial letter, we received 565 complete survey responses. On December 3rd, we sent a follow-up letter to all individuals who had not completed the survey, again inviting them to participate. This generated an additional 325 survey responses. In total, we received 890 complete responses, a 4.94% response rate. In Table 1 we show a good response rate across sampling zones, though with an elevated response rates in areas that had experienced a power outage. We also map the locations of all final survey respondents in Figure 3.
Table 1. Survey Response Rates by Spatial Sampling Zone
| Zone | All outage | Inside 0-1km | Outside 0-1km | Outside 1-20km | Southern California |
| Response rate | 5.73% | 5.03% | 4.97% | 3.87% | 4.33% |
Figure 3. Locations of all Complete Survey Responses
Findings
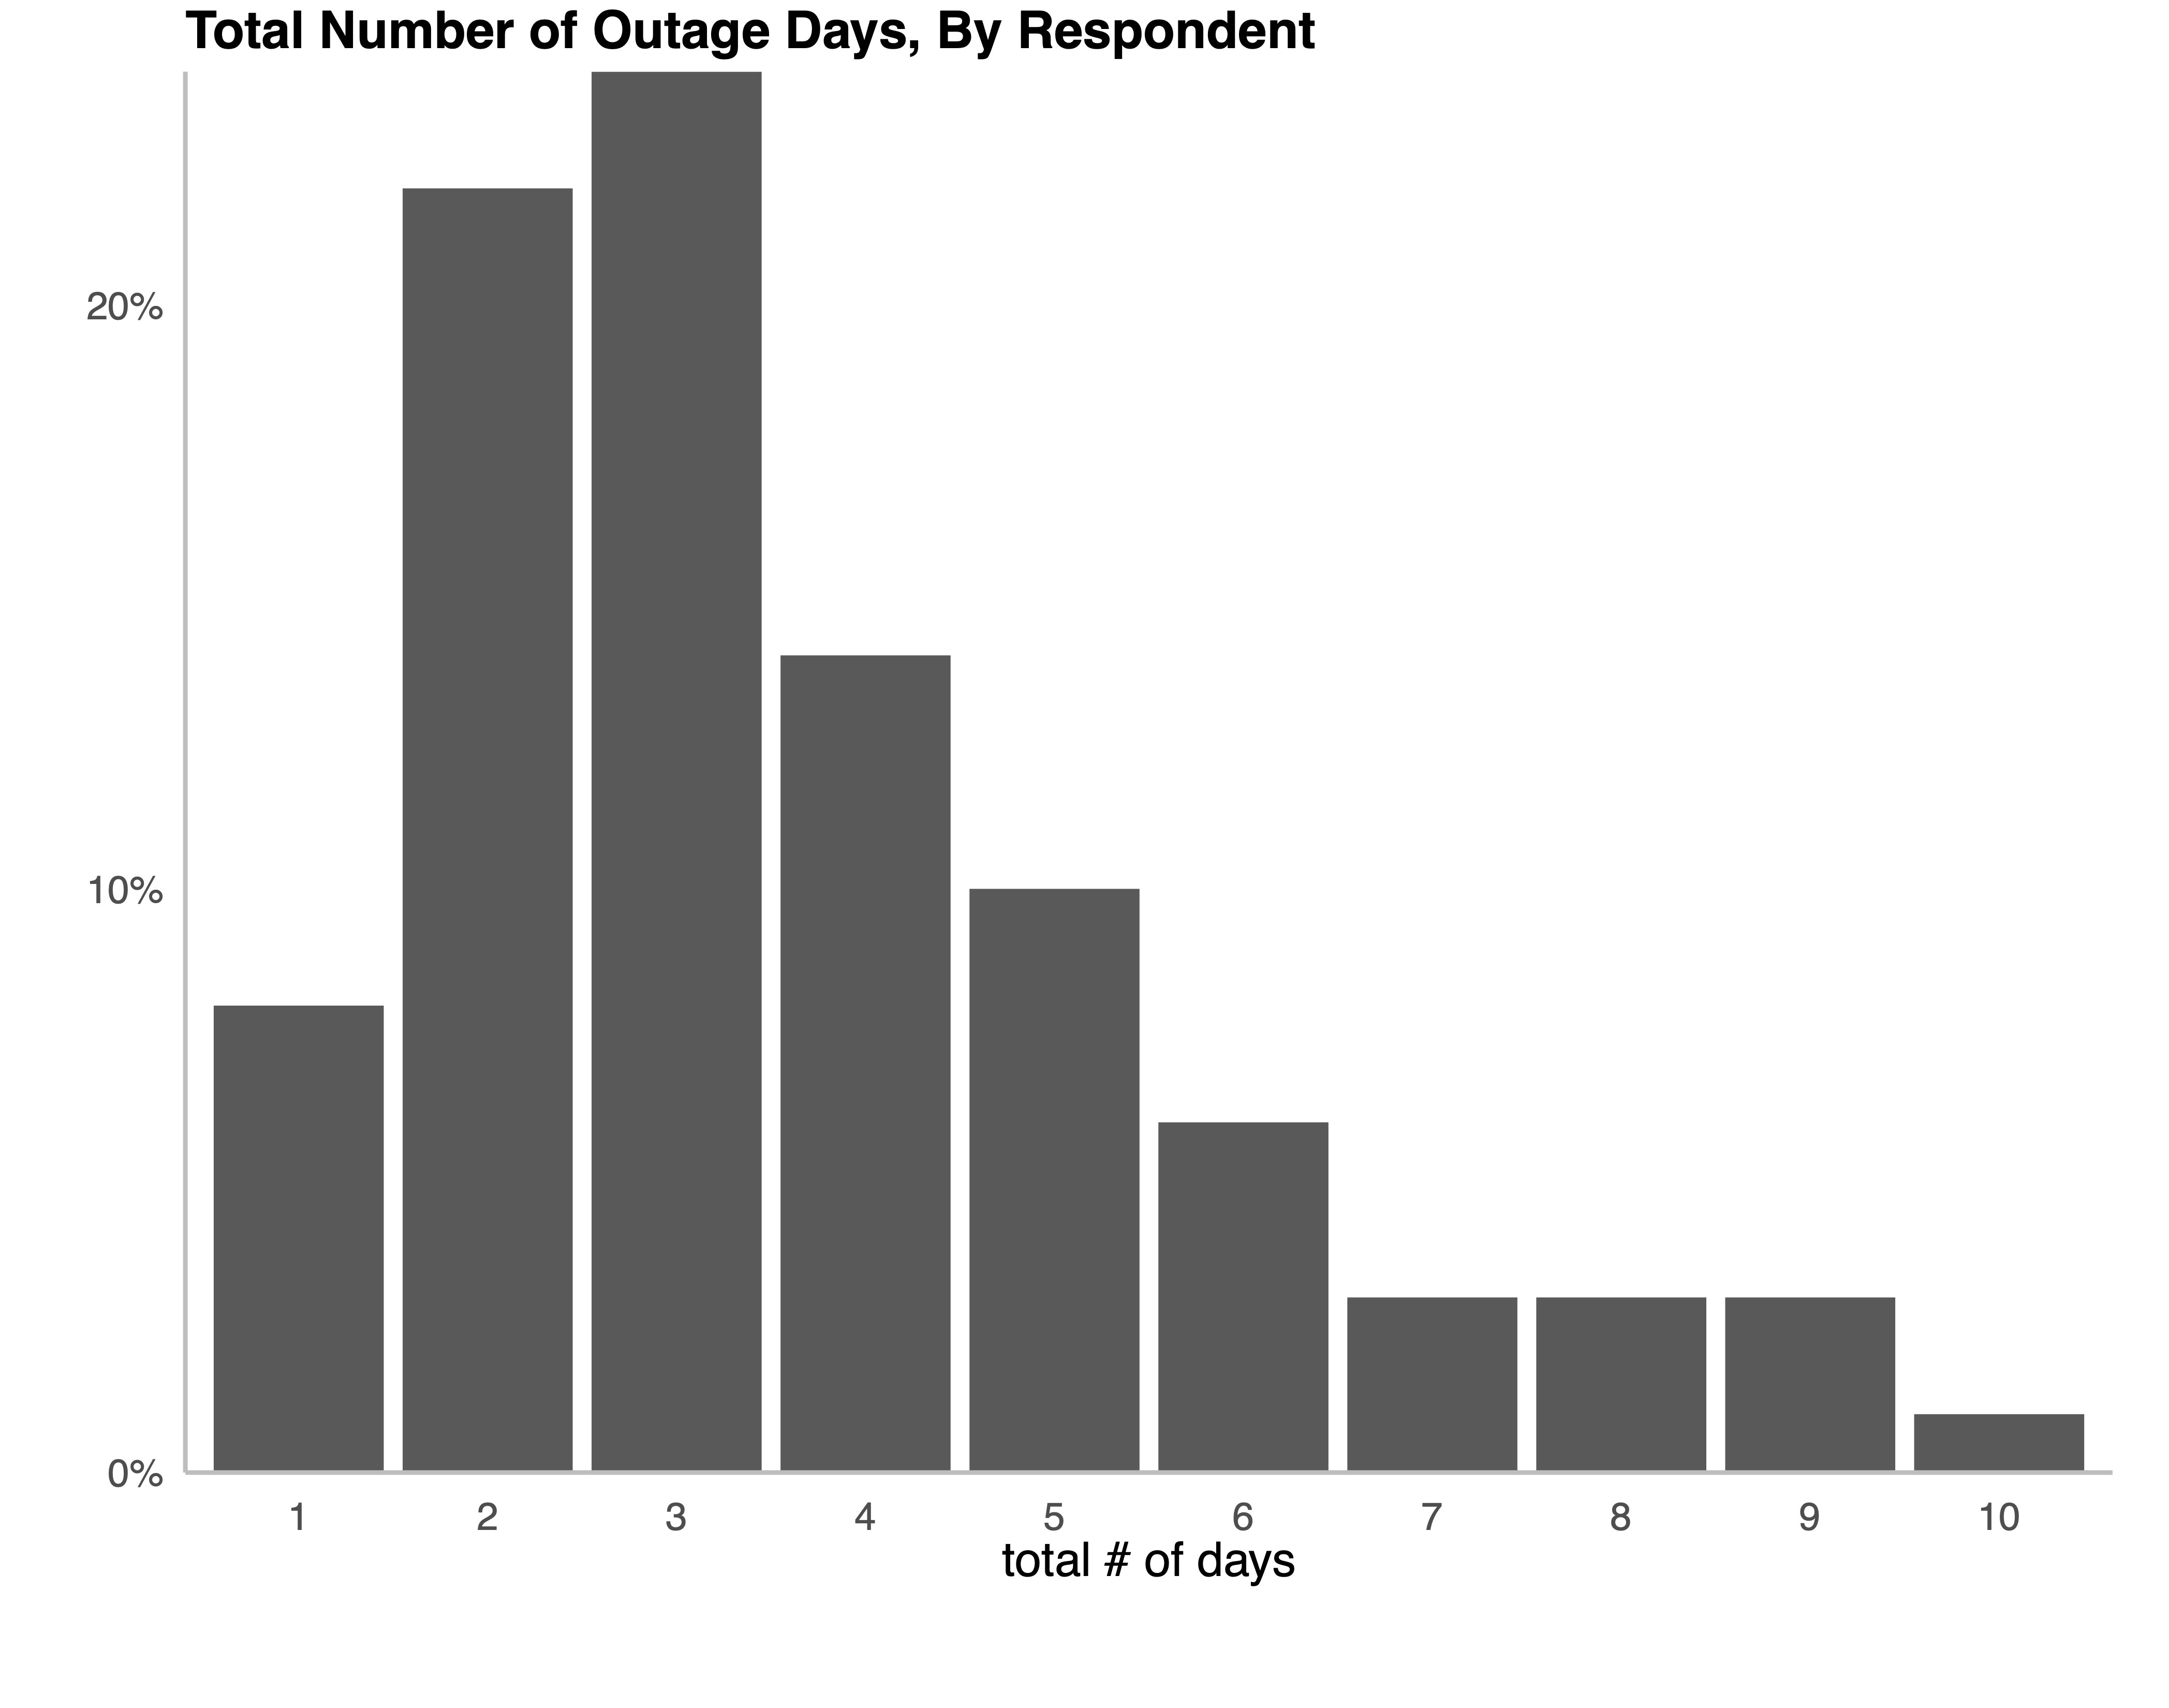
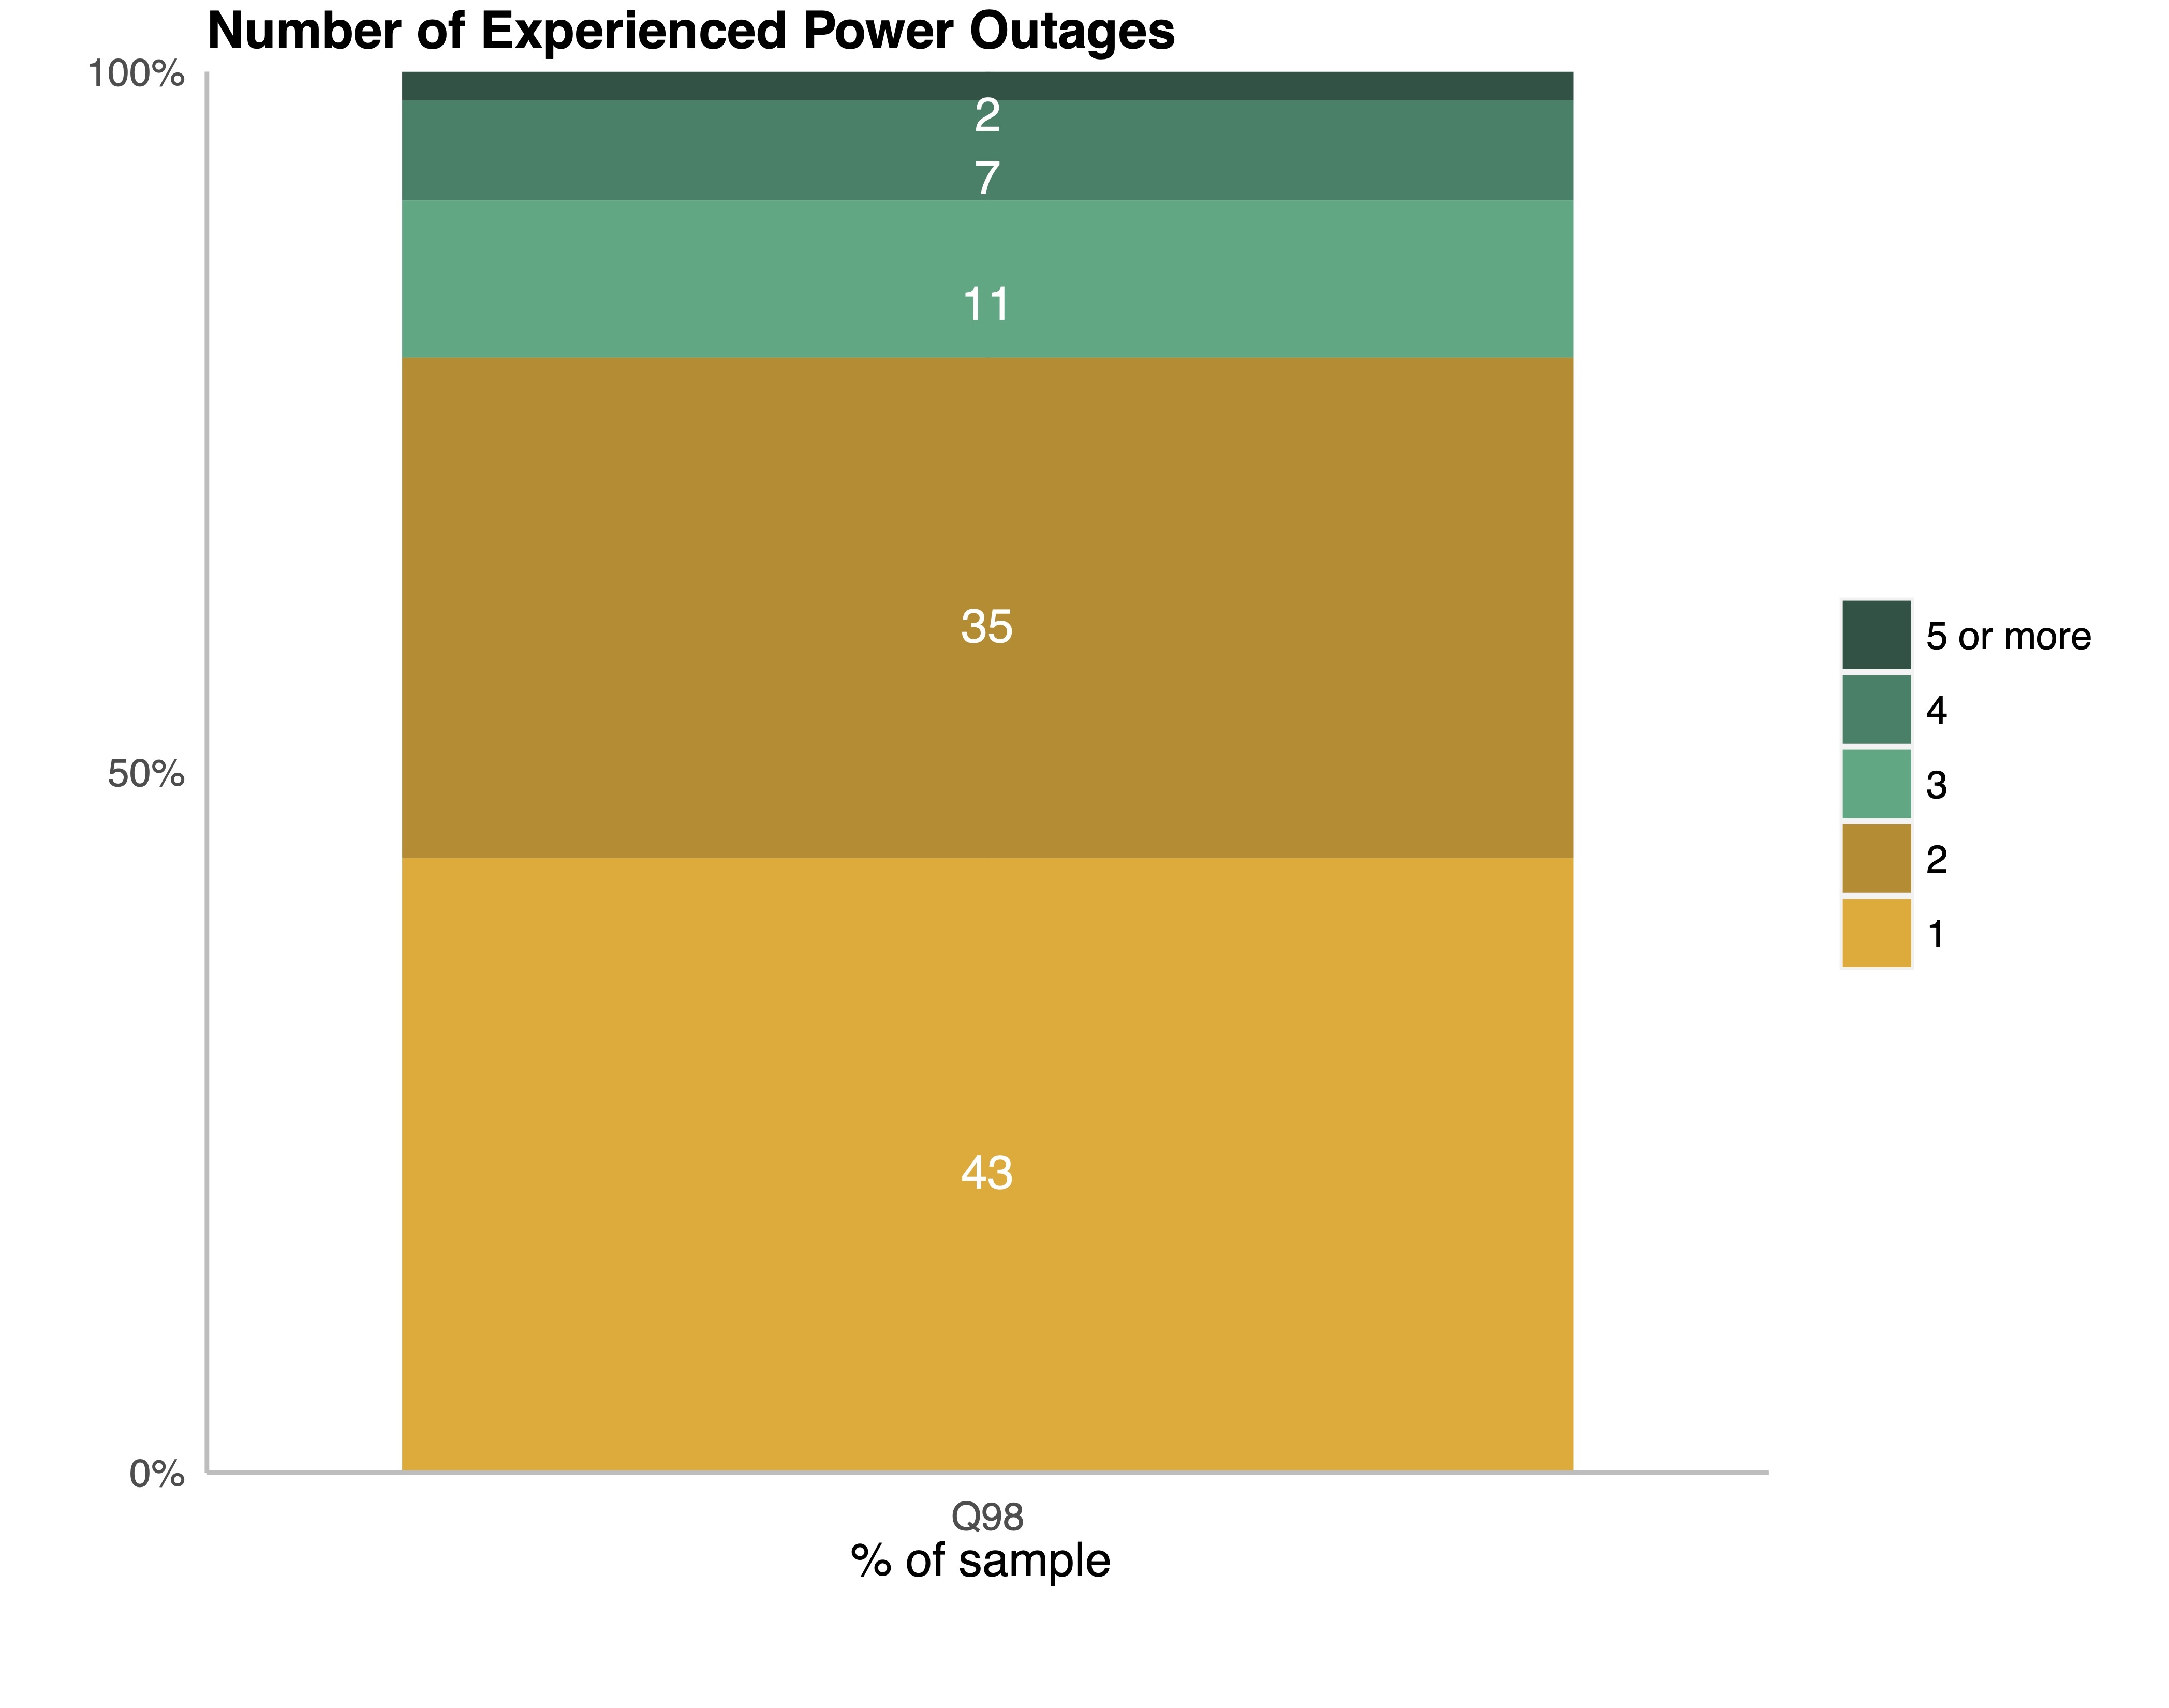
Among our sample of respondents located within the outage zones released by PG&E, 85% reported experiencing at least one recent power outage. Of those respondents, the majority (57%) reported experiencing more than one outage (Figures 4 and 5). Among respondents who experienced an outage, a majority were without power for three or more days.
Figures 4 and 5. Frequency of Power Outages Among Respondents Reporting an Outage
Respondents were also asked if they received adequate warning about the planned power shutoffs. Of respondents in the outage zones, 60% reported that they received adequate warnings to prepare for the PSPS. By contrast, 36% reported receiving a warning but felt they did not have adequate time to prepare. 4% of respondents reported being surprised by the power shutoffs and had not received any warning.
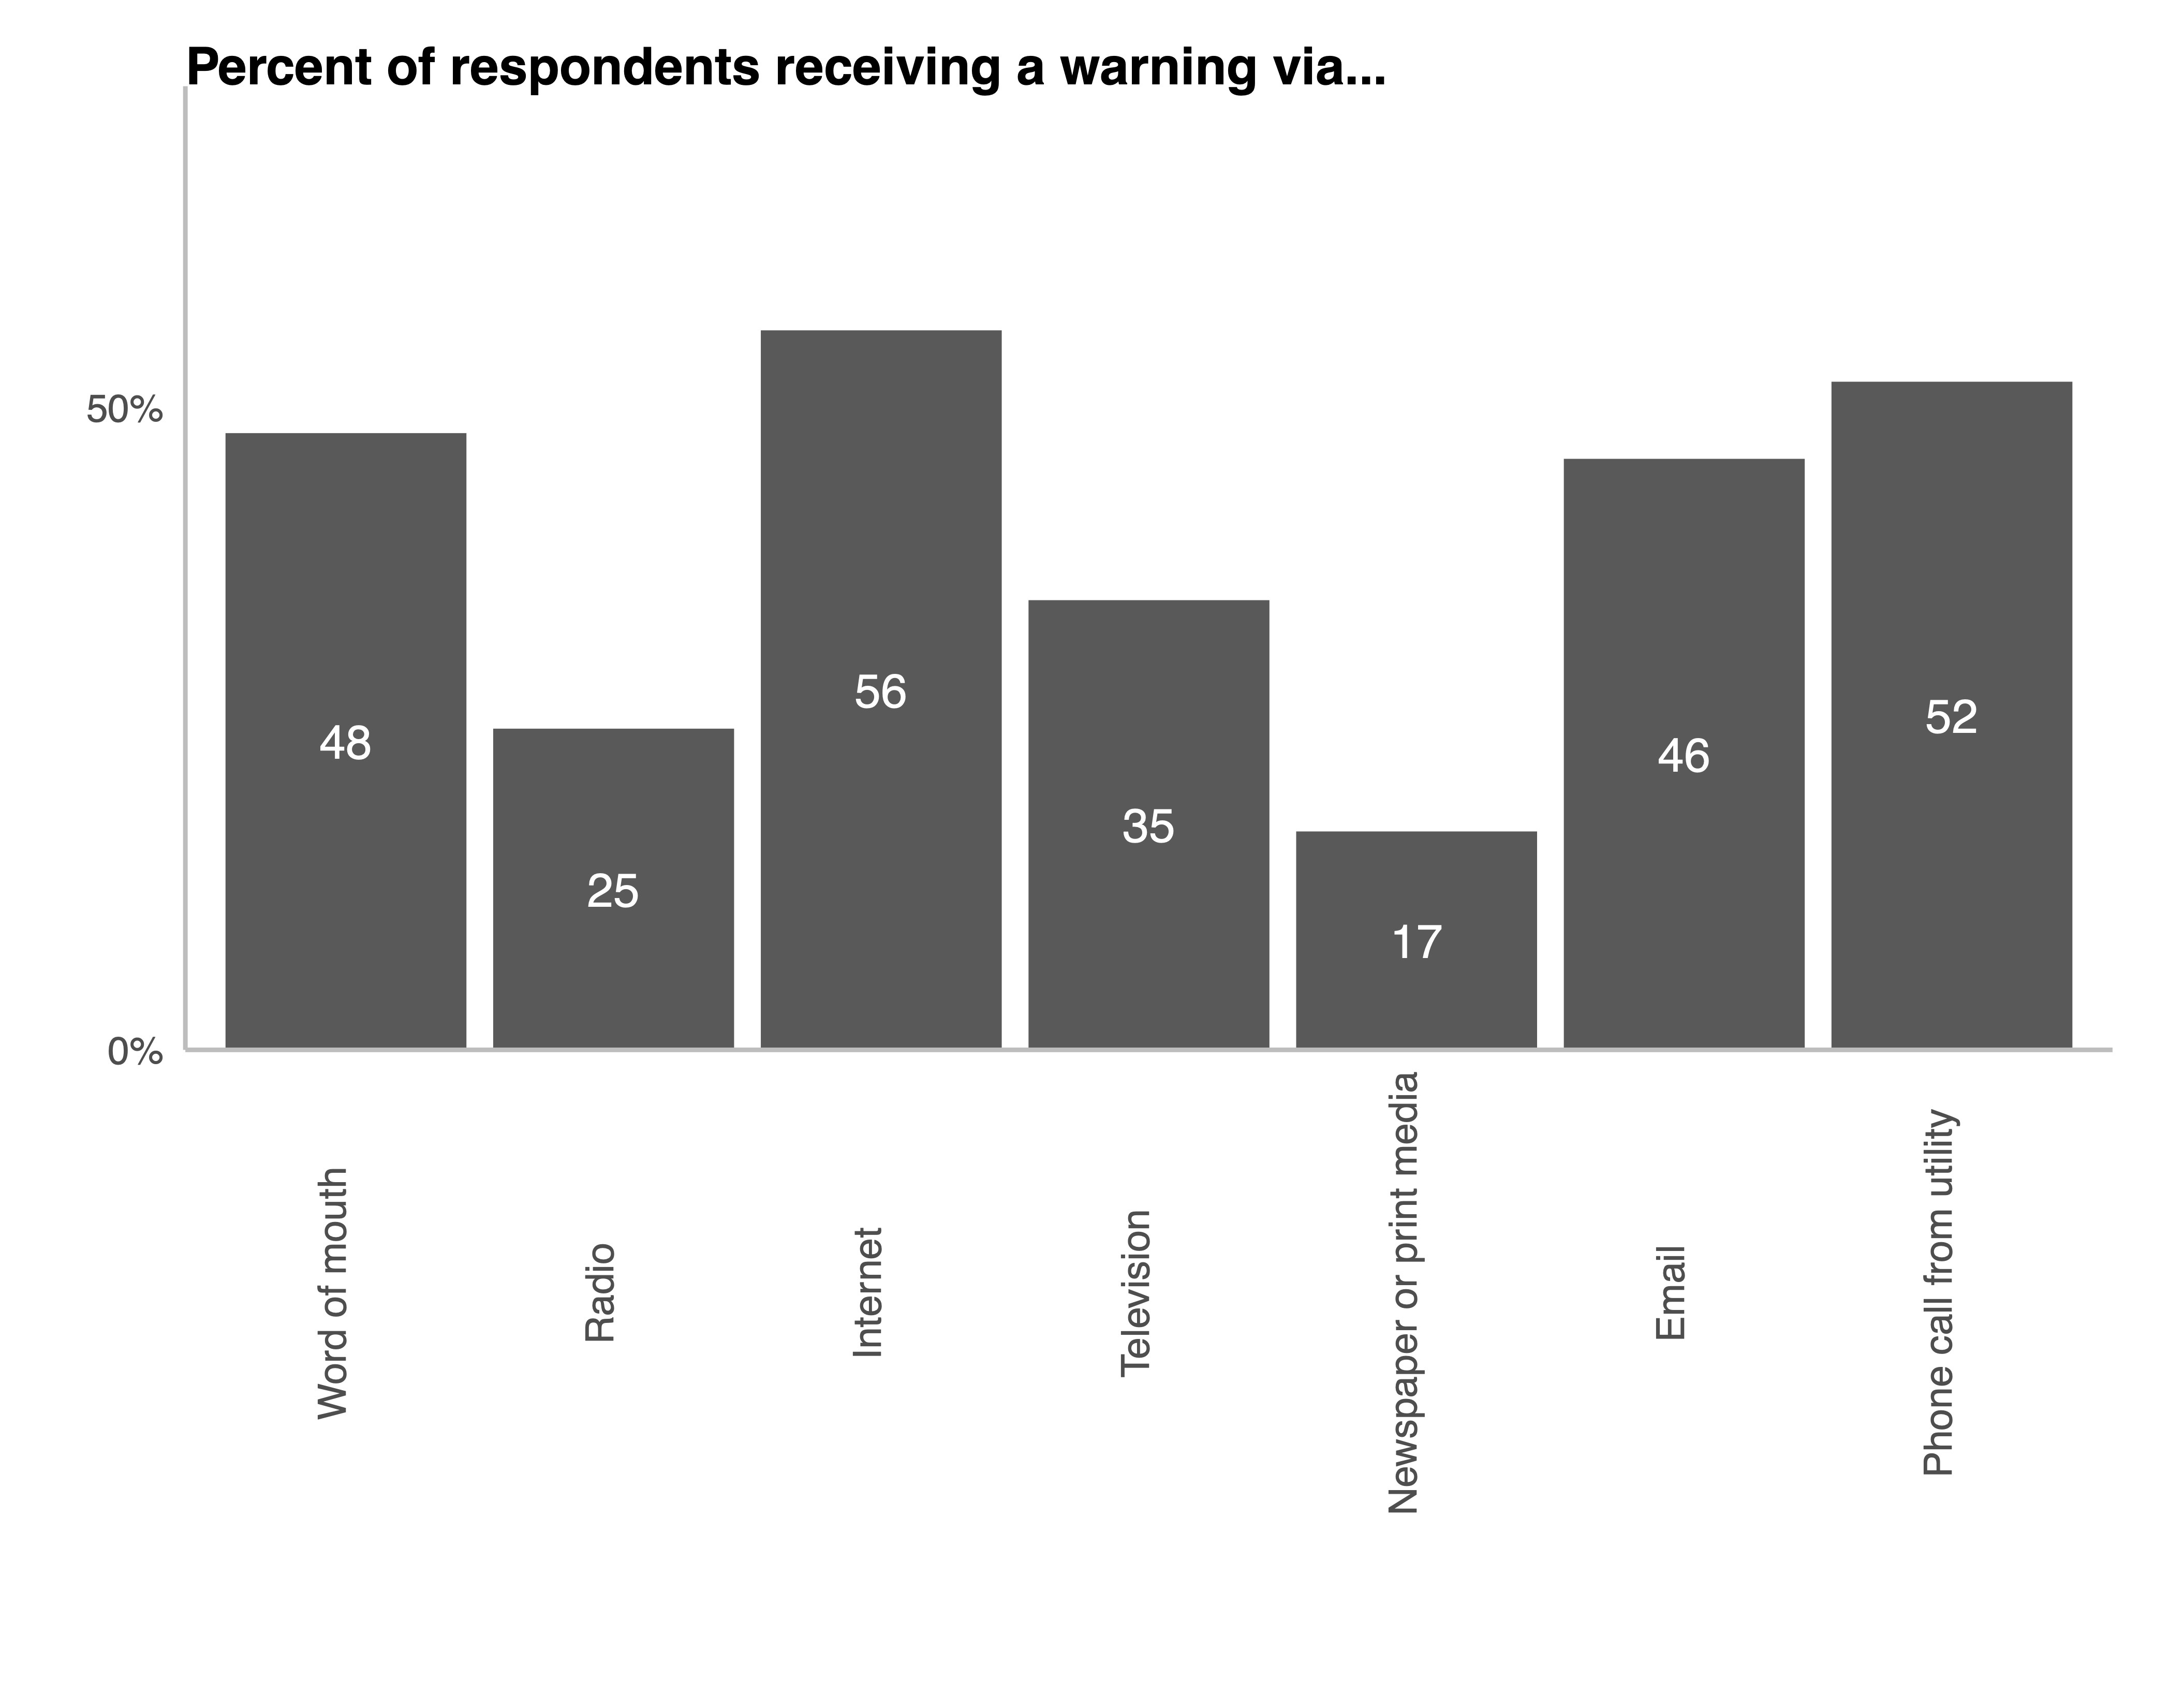
Respondents received these warnings in a variety of ways (Figure 6). About half of respondents received warnings via the internet, a phone call from their utility provider, word of mouth, or email.
Figure 6. Percentage of Respondents who Heard About the Power Shutoffs Beforehand, by Source of Warning
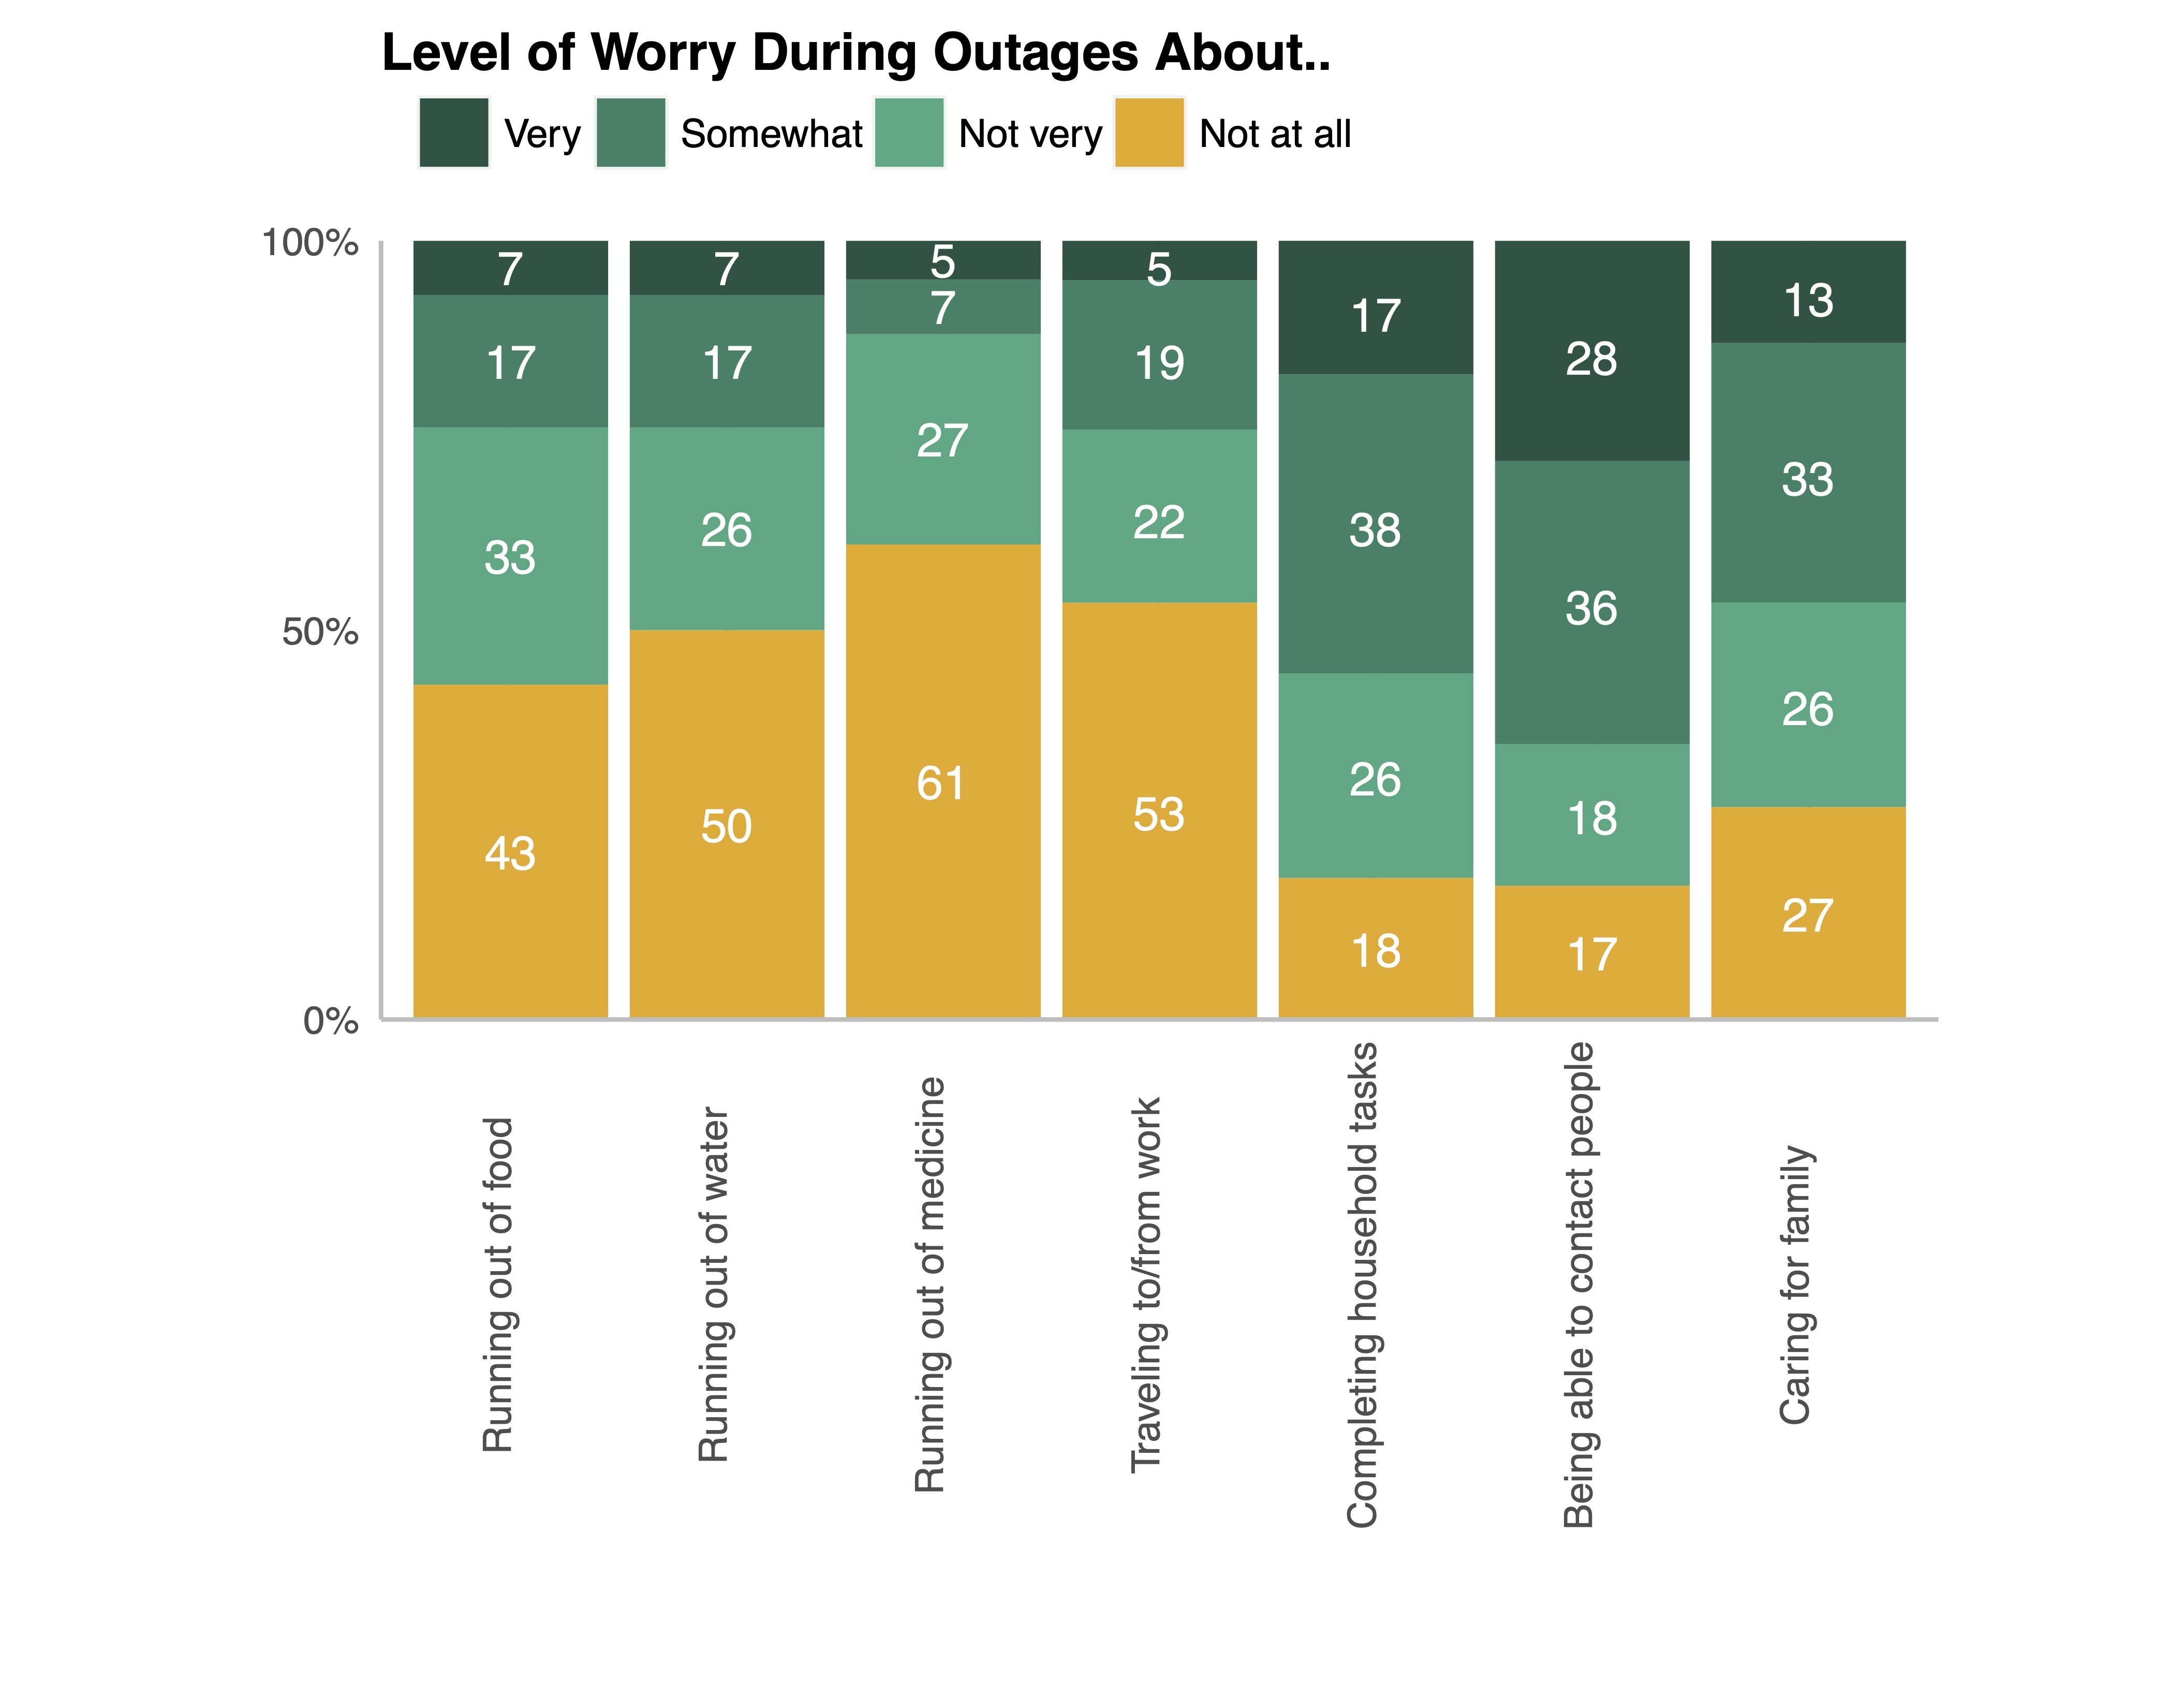
We asked respondents about specific worries during the outages (Figure 7). A majority were "very" or "somewhat" worried about being able to contact people and complete household tasks, and about half were "very" or "somewhat" worried about caring for family. About a quarter of respondents were "very" or "somewhat" worried about traveling to and from work, running out of food, or running out of water. About one in eight respondents were "very" or "somewhat" worried about running out of medicine during the power outages.
Respondents only took a limited set of actions in preparation for the outages. Twenty-eight percent reported buying additional food, 42% reported buying gasoline, and 5% reported buying a diesel generator. No respondents reported a wide range of other preparatory activities including getting additional refills for their medicine; filling their bathtub with water; buying extra drinking water’ buying flashlights, candles or rechargeable batteries; or buying a camp stove.
Most respondents who experienced power shutoffs stayed in their own homes (90%), even if their power was shut off overnight. A small proportion stayed with friends or relatives (4%) or at a hotel or motel (1%) during the shutoffs.
Figure 7. Level of Respondent Concern About Experienced Outages
We also asked respondents, “Which of the following statements best characterizes the impact that the recent power outages had on you financially? In answering this question, please consider both the costs of preparing for the outages (e.g., buying supplies) and, if applicable, responding to the outage (e.g., eating out, hotel costs, loss of perishable food, loss of medications)?” In our sample, 7% of respondents reported that they could not afford what they needed during the outages. Fourteen percent of respondents said it was difficult to afford what they needed. Over half (51%) felt the outages impacted their finances, but not seriously. Only 29% of respondents reported that the outages did not impact them financially.
Finally, we asked respondents a series of prospective questions about their intended future behaviors. Fourteen percent had already purchased additional water and food to prepare for future outages, while an additional 30% reported their intention to do so in the next 12 months. In terms of wildfire risk reduction, while 33% of respondents reported that they already had wildfire-resistant landscaping, a further 13% said they would change their home's landscaping to reduce wildfire risks in the next 12 months. Finally, only 17% of respondents reported having previously upgraded their home's building materials to reduce wildfire risks, and only 5% reported an intention to do so in the next 12 months.
Conclusion
Our results highlight the direct lives experiences of Californians who experienced a PSPS in fall 2019. Using a representative sample of impacted residents, we find that few residents prepared adequately for the shutoffs, and over one-third felt they had not received adequate warning to prepare for the disruptions. In turn, the experience entailed substantial financial and psychological burdens on the public. Majorities of the public were worried about their ability to complete household tasks and care for their family. A significant number of others were worried about traveling to and from work, running out of food, or running out of water. In addition, over two-thirds of residents were at least somewhat financially impacted by the disruption.
More optimistically, these direct experiences did appear to translate into proactive mitigation and adaptation behaviors. Impacted respondents were both more likely to undertake household preparations to manage future shutoffs, as well as express interest in managing wildfire risks at the property level. Our analysis is ongoing and is being incorporated into two articles for peer review, a public-facing policy brief, and an op-ed. Additional analysis evaluating the causal effect of these outages on attitudes and mitigation behaviors is ongoing, by comparing outage-experiencing respondents to benchmark respondents outside the outage area and in Southern California. We expect a first paper to examine the causal effect of experiencing an outage on energy policy behaviors and preferences. A second paper will describe the lived experience of residents in the outage area.
References
-
Howe, P. D., Marlon, J. R., Mildenberger, M., & Shield, B. S. (2019). How will climate change shape climate opinion? Environmental Research Letters, 14(11), 113001. ↩
-
Wachinger, G., Renn, O., Begg, C., & Kuhlicke, C. (2013). The risk perception paradox—Implications for governance and communication of natural hazards. Risk Analysis, 33(6), 1049–1065. ↩
-
Rogers, R. W., & Prentice-Dunn, S. (1997). Protection motivation theory. In D. S. Gochman (Ed.), Handbook of health behavior research 1: Personal and social determinants (p. 113–132). Plenum Press. ↩
-
Lindell, M. K., & Perry, R. W. (2000). Household adjustment to earthquake hazard: A review of research. Environmental Behavior, 32(4), 461–501. ↩
-
Grothmann, T., & Patt, A. (2005). Adaptive capacity and human cognition: The process of individual adaptation to climate change. Global Environmental Change, 15(3), 199–213. ↩
-
Tierney, K. J., Lindell, M. K., & Perry, R. W. (2001). Facing the unexpected: Disaster preparedness and response in the United States. Joseph Henry Press. ↩
-
McGee, T. K., McFarlane, B. L., & Varghese, J. (2009). An examination of the influence of hazard experience on wildfire risk perceptions and adoption of mitigation measures. Society & Natural Resources, 22(4), 308-323. ↩
-
Zaalberg, R., Midden, C., Meijnders, A., & McCalley, T. (2009). Prevention, adaptation, and threat denial: Flooding experiences in the Netherlands. Risk Analysis, 29(12), 1759–1778. ↩
-
Office of Consumer Affairs, Government of Canada. (2014). Aid to conducting public opinion research – Contributions program for non-profit consumer and voluntary organizations. Available at: https://www.ic.gc.ca/eic/site/iccat.nsf/eng/05754_5.html ↩
-
Hazlett, C., & Mildenberger, M. (2020). Wildfire exposure increases pro-environment voting within Democratic but not Republican areas. American Political Science Review, 114(4), 1359-1365. ↩
-
Risen, J. L., & Critcher, C. R. (2011). Visceral fit: While in a visceral state, associated states of the world seem more likely. Journal of Personality and Social Psychology, 100(5), 777–793. ↩
-
Li, Y., Johnson, E. J., & Zaval, L. (2011). Local warming: Daily temperature change influences belief in global warming. Psychological Science, 22(4), 454–459. ↩
-
Egan P. J., & Mullin, M. (2012). Turning personal experience into political attitudes: the effect of local weather on Americans’ perceptions about global warming.* Journal of Politics, 74*(3), 796–809. ↩
-
Zaval, L., Keenan, E. A., Johnson, E. J., & Weber, E. U. (2014). How warm days increase belief in global warming. Nature Climate Change, 4(2),143–147. ↩
Mildenberger, M., Howe, P., Lubell, M., and Stokes, L. (2020). How California’s 2019 Pre-Emptive Power Outages Shaped Perceptions and Behavioral Adaptations Related to Future Hazards (Natural Hazards Center Quick Response Research Report Series, Report 306). Natural Hazards Center, University of Colorado Boulder. https://hazards.colorado.edu/quick-response-report/how-californias-2019-pre-emptive-power-outages-shaped-perceptions-and-behavioral-adaptations-related-to-future-hazards