Investigating the Individual Experience in Extreme Heat
Publication Date: 2015
Executive Summary
Exposure to extreme temperatures is the leading weather-related killer in the United States but very little is known about the actual exposures of urban residents.
From August through December 2014, a quick response field study took place concerning the individual experience in extreme heat in Arizona’s Phoenix metro area. This study was supported by the Quick Response Grant Program from the Natural Hazards Center at the University of Colorado Boulder.
The principal investigator was Evan Kuras, a visiting researcher at Arizona State University, partially supported by the Central Arizona-Phoenix Long Term Ecological Research Program. The co-investigators included ASU Professors David Hondula (School of Geographical Sciences and Urban Planning, Center for Policy Informatics) and Benjamin Ruddell (College of Technology and Innovation, School of Sustainability). Eight undergraduate student researchers, Summer Betzel, Christopher Dastan, Jason Eneboe, Miranda Kaml, Mary Munoz Encinas, Lauren Rohan-Kohl, Mara Sevig, Marianna Singh, assisted with every aspect of the study.
The extreme heat period studied occurred from September 13-20, 2014. During this time, 80 residents from five neighborhoods in metro Phoenix carried personal air temperature sensors as they went about their daily lives, thus collecting a sample of Individually Experienced Temperatures (or IETs).
Principal questions explored differences in IETs between and within neighborhoods. In addition, each student researcher developed an independent investigation within the scope of the study that explored themes including urban form, age-based vulnerability, and leisure time physical activity.
The following report documents time-dependent differences between neighborhoods, as well as similar patterns of homogeneity at four of the five study sites. Research questions posed by undergraduate student researchers are also addressed.
The IET approach generates quantitative and qualitative data that help to identify how, where, and when intra-city differences in outdoor temperatures manifest themselves in the heat exposure of urban residents. Insights drawn from examining the individual experience may better enable health providers, emergency managers, and citizens themselves to eliminate preventable adverse disaster-related health events.
Introduction
Extreme heat is responsible for more deaths each year in the United States than most other natural hazards combined. The National Center for Health Statistics reports that in the five- year period 2006-2010, extreme heat was associated with 3,332 deaths compared with the 662 that resulted from floods, storms, and lightning, collectively (NCHS 20141). No major metropolitan area in the country faces higher temperatures each summer than that of Phoenix, Arizona. The Maricopa County Department of Health reports that a total 446 heat-related deaths occurred over the period 2009-2013 among residents of Phoenix and surrounding municipalities (MCDPH 20142), which is only a small fraction of the total health burden associated with heat when considering that the number of heat-related emergency department visits and hospitalizations is several times greater than that of mortality (Petitti et al. 20153).
Despite growing awareness of the health burden of extreme heat (e.g., Anderson and Bell 20094; Harlan et al. 20145) and the preventability of adverse health outcomes with appropriate interventions, heat persists as a public health challenge in Maricopa County. Declines in heat- related mortality observed elsewhere (e.g., Bobb et al. 20146; Davis et al. 20037) are not evident from the recent experience in central Arizona (MCDPH 20142) and most literature anticipates heat-related mortality to increase in Arizona and elsewhere (e.g., Hondula et al. 20148; Knowlton et al. 20079; Sheridan et al. 201210). There is thus an urgent need to re-examine the intervention strategies used to protect the public when a heat disaster is imminent.
This project investigates the individual experience in extreme heat to better understand the conditions people actually experience and their behaviors, movements, and coping strategies when temperatures are high. Most research on this hazard examines aggregated meteorological data and health records, with no information regarding the exposures and activities of individuals (e.g., Anderson and Bell 20094; Bobb et al. 20146; Hondula et al. 201311). By measuring Individually Experienced Temperatures (IETs) of a sample of Phoenix residents under extreme heat conditions, the research team seeks to explore the spatial and temporal distribution of exposure, an important but understudied dimension of heat-health risk (versus, for example, social vulnerability) (Kuras et al. 201512). Qualitative information, including interviews, surveys, activity logs, and ethnographic observations were used to contextualize IET data and to identify mechanisms through which individuals become exposed to or are protected from dangerous heat.
Research Questions
Q1: How does IET vary across time (scale: 24 hour day) and space (scale: neighborhood) during extreme heat conditions?
Q2: How does within-neighborhood heterogeneity in IET vary from one neighborhood to the other?
Eight undergraduate student research assistants, participating in a for-credit research experience led by investigators Kuras and Hondula during the fall 2014 semester, were trained in appropriate field methods in order to collect IET data in a timely fashion. Each student developed an independent research question (below) within the scope of the study.
Q3: How does IET compare with other standard ecological variables used to create heat vulnerability indexes? (Eneboe)
Q4: What demographic and lifestyle attributes are associated with IET among a population of urban residents? (Singh)
Q5: What is the effect of temperature on activity levels with respect to age? (Betzel)
Q6: How does health status affect IET and thermal comfort in a warm, urban setting? (Kaml)
Q7: What is the relationship between heat exposure, occupation, income, and leisure time physical activity? (Rohan-Kohl)
Q8: How does Sense of Place affect IET? (Munoz Encinas)
Q9: How can intergenerational perspectives inform health interventions within a vulnerable community? (Dastan)
Q10: How does a neighborhood community in a warm climate utilize cooling and hydrating resources? (Sevig)
Methods
Participant Recruitment and Data Collection
During the first two weeks of September 2014, 80 study participants were rapidly recruited from among 5 neighborhoods that were selected to provide contrasts in vulnerability to heat-related illness and mortality, geographic/climatic setting, demographic characteristics, and consistency with previous and ongoing research efforts (e.g., survey data, fixed-point microclimate data) (see Table 1). Participants were asked to wear or carry a Thermochron iButton (model DS1921G-F5#), a small passive sensor that recorded ambient temperature every 5 minutes as participants went about their daily lives. The time series of temperatures collected is the participant’s Individually Experienced Temperature (IET) and approximates an individual’s heat exposure (Kuras et al. 2015). The study took place during a one week period from 20:00 September 13 to 20:00 September 20, 2014 and all times are reported in Local Standard Time (LST). Surveys, activity log phone calls, and exit interviews were used to collect additional information from participants about demographics (age, race, gender); housing status; activities and thermal comfort during the week; lifestyle; occupation; orientation toward the neighborhood; uses of indoor and outdoor spaces; as well as public and private cooling resources. Field ethnographic observations were conducted in each neighborhood to understand how residents used space to stay cool and safe during hot days and/or any associated challenges they might face.
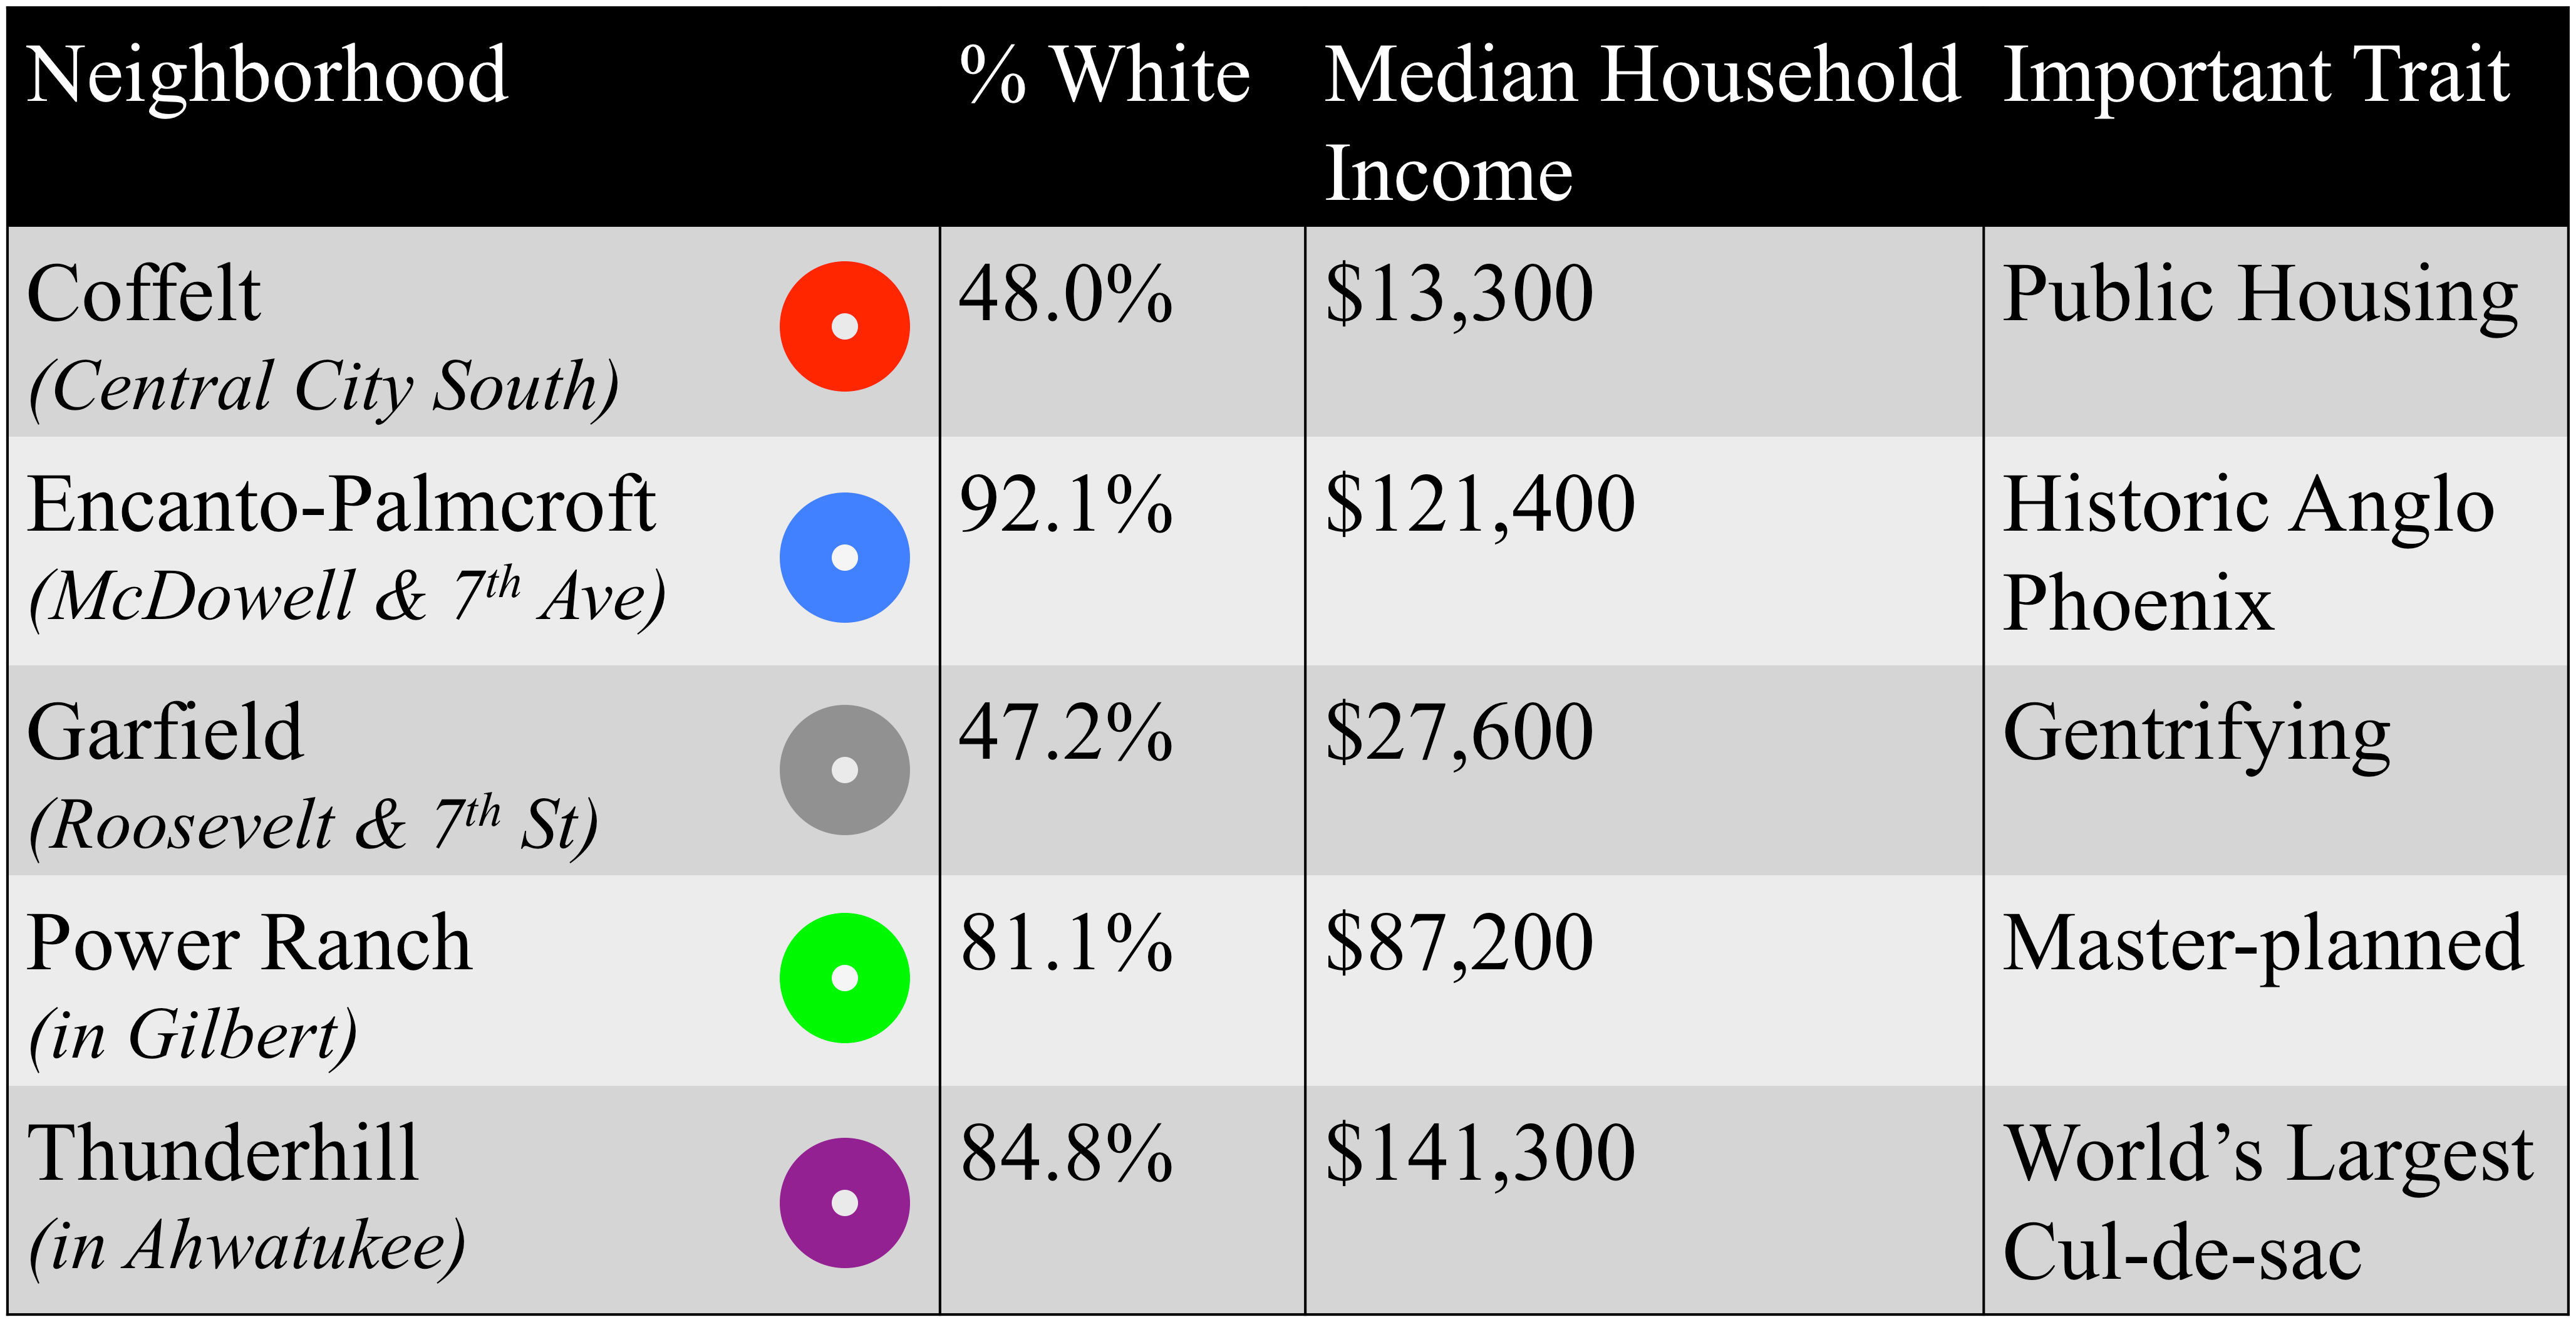 Table 1. Selected traits of the five study neighborhoods located in greater Phoenix, AZ.
Data Analysis and Reporting
IETs were compared with fixed-point environmental data including meteorological measurements (from Phoenix Sky Harbor airport and microclimate observing sites near the study neighborhoods), thermal imagery from satellite campaigns, and iButtons deployed in specific outdoor places in each neighborhood during the study week. Neighborhood context and the lives and experiences of the study participants were used to identify patterns in heat exposure that operate on the person-level scale.
A different analysis was performed for each of the research questions posed above. For Q1 and Q2, the four hottest days during the study week were selected to represent average September conditions. This period included two weekdays and two weekend days (September 14, 15, 19, 20) on which average outdoor temperatures spanned 28.6˚C to 37.0˚C. In each of the five neighborhoods, all IET data were averaged for each hour of the study period, collapsed into 24 hours. Neighborhood mean IETs were compared at each hour (ANOVA, p<0.05/24) and standard deviation at each hour was compared across neighborhoods to assess change in heterogeneity over time.
Each undergraduate student researcher analyzed a subset of the data to answer his or her individual research question (Q3-Q10). Methods for each question are briefly described in the following section. All students wrote end-of-semester reports and seven of the students designed and presented posters at the 17th Annual CAP LTER (Central Arizona-Phoenix Long-Term Ecological Research Program) All Scientists Meeting (January 16th, 2015). All student posters can be viewed online through the CAP LTER website: https://caplter.asu.edu/publications/cap- lter-symposia/seventeenth-annual-scientists-meeting-poster-symposium/. Kuras and Hondula presented research findings to various audiences, including the Maricopa County Department of Public Health (November 19th, 2014), the Center for Policy Informatics at ASU (November 17th, 2014), and the American Meteorological Society 95th Annual Conference (January 8th, 2015). An audio recording of Kuras’ presentation at the AMS meeting was posted online (http://www.ametsoc.org) in February 2015.
Results
Q1: How does IET vary across time (scale: 24 hour day) and space (scale: neighborhood) during extreme heat conditions?
We found that there was significant variability (ANOVA p<0.05/24) in IETs across the five Phoenix neighborhoods examined in this study at most times of day (Figure 1). Inter- neighborhood differences were not statistically significant at the hours of 6:00a.m., 7:00a.m., 8:00a.m., and 9:00a.m. The neighborhood with the lowest IETs during the overnight hours was Encanto-Palmcroft, comprised of a largely affluent population located north of downtown Phoenix. During the daytime hours Thunderhill residents—similarly affluent but geographically distant (15 miles) from the downtown core—had the lowest IETs. The lower- and middle-income neighborhoods examined (Coffelt, Garfield, and Power Ranch) reported higher IETs for most hours of the day with individuals in Power Ranch experiencing slightly higher temperatures during the early hours of the morning.
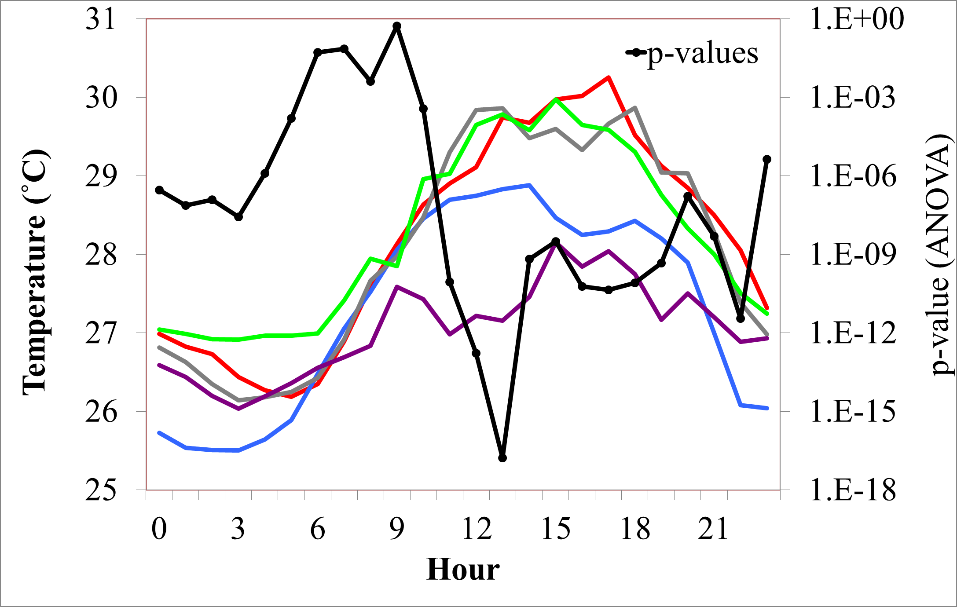 Figure 1. Mean neighborhood IETs during the analysis period plotted on an hourly basis. Each neighborhood’s mean IET is represented by a separate color (corresponding to the symbols in Table 1). The black line indicates the p-value of an analysis of variance test between the neighborhood means.
IETs were found to be substantially below outdoor ambient temperatures as measured at Sky Harbor airport during all hours of the day, with the differences largest in the afternoon (Figure 2). The diurnal pattern in IETs is correlated with the outdoor temperatures but shows a much narrower range over the course of a typical warm season day.
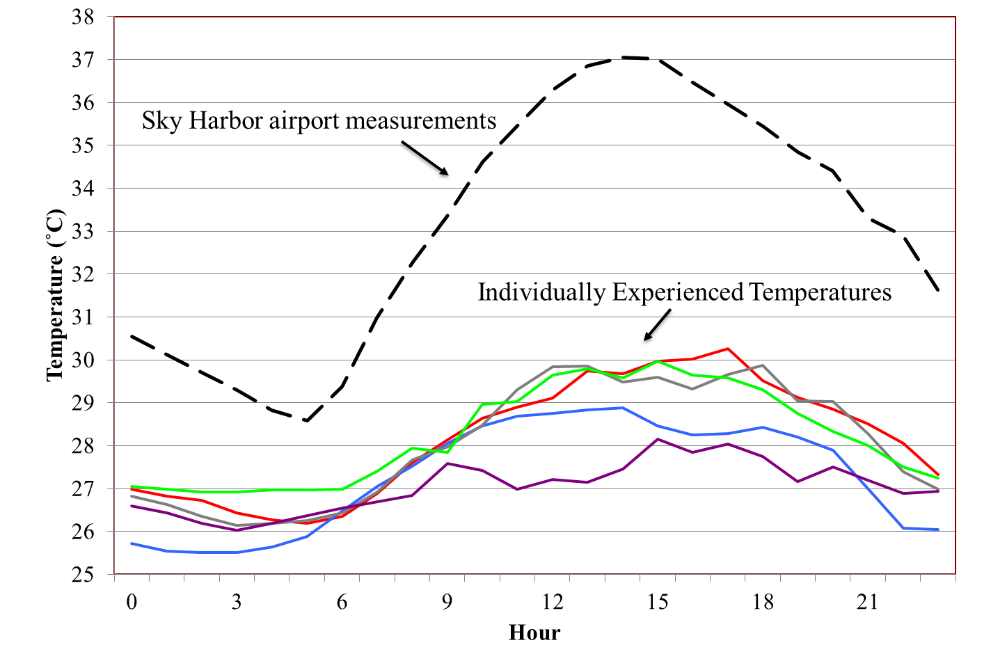 Figure 2. Mean neighborhood-average IETs (colored lines, colors correspond to Table 1) compared to outdoor ambient temperatures (black dashed line) as reported at Sky Harbor Airport during the analysis period.
Q2: How does within-neighborhood heterogeneity in IET vary from one neighborhood to the other?
In four of the neighborhoods, the pattern of heterogeneity was roughly similar throughout the 24-hour cycle. One neighborhood (Thunderhill, shown in purple) had an inverse pattern with elevated variance in the period of 23:00-6:55 (Figure 3). This observation may be driven by A) two participants with relatively high IETs compared to their neighbors and B) a small sample size in that neighborhood (n = 11).
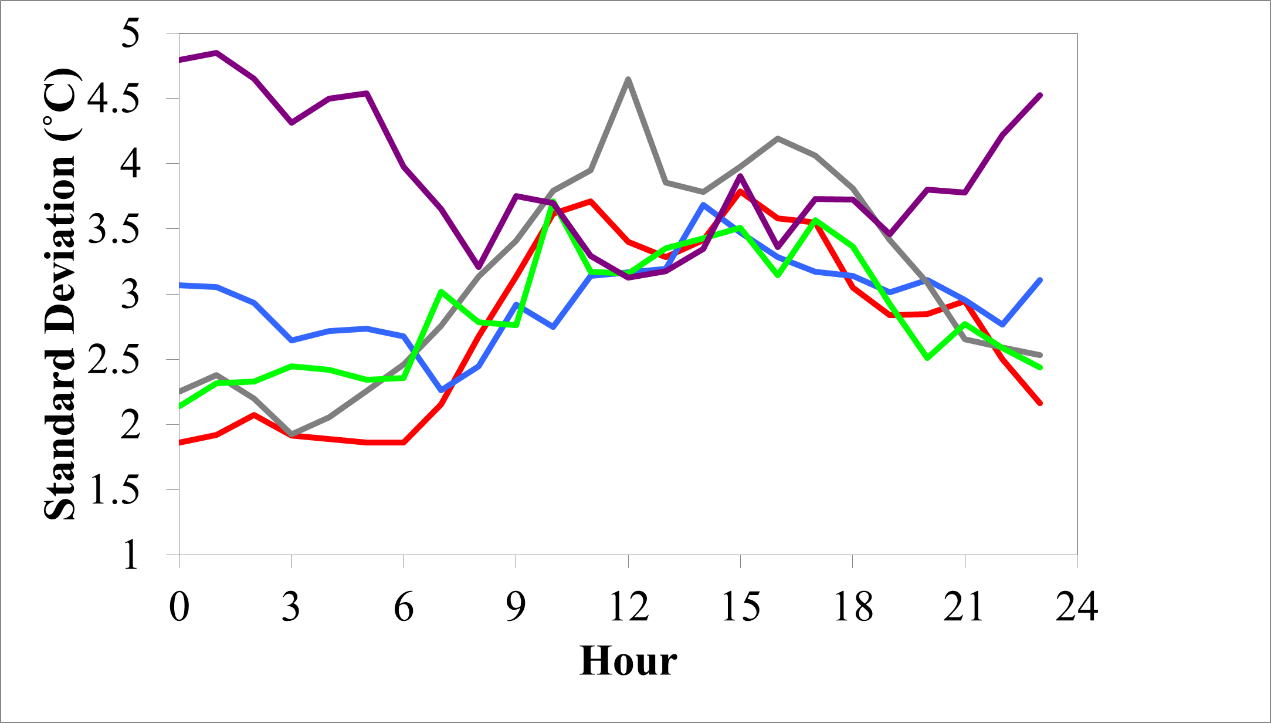 Figure 3. Standard deviation in neighborhood IETs during the analysis period. Each color corresponds to one of five different neighborhoods as illustrated in Table 1.
Q3: How does IET compare with other standard ecological variables used to create heat vulnerability indexes?
Human exposure to heat has increasingly become a prominent issue in public health within the Phoenix, Arizona metropolitan area. Past studies have measured human susceptibility to heat utilizing demographic factors along with surface or outdoor ambient temperatures within certain urban neighborhoods (e.g., Harlan et al. 200613; Reid et al. 200914). These studies are limited in that by only using stationary temperature measurements, the range of possible temperatures actually experienced by people living in the same area are not accounted for, especially as individuals move within and beyond their neighborhood boundaries. The purpose of this project is to utilize IETs to more holistically represent the average actual heat exposure for residents belonging to a neighborhood. By comparing IETs to ecological factors often used to calculate Heat Vulnerability Indexes (HVIs), a more nuanced assessment can be made about the levels of vulnerability for certain neighborhoods. The present study created implications for each neighborhood’s vulnerability to heat from multiple two-dimensional analyses by comparing mean IETs (daytime, nighttime, and all hours) with select variables incorporated in studies by Harlan et al. (200613) and Harlan et al. (201315), including estimated land surface temperature, air temperature, prevalence of vegetation, and impact of urbanization.
Geographic information systems (GIS) were used to create spatial analyses of these ecological factors. An inverse relationship was observed between vegetative cover and air temperature. Despite fairly strong ecological correlation for each neighborhood, these variables did not necessarily follow the trends of IET (and only aligned with two of the five neighborhoods). Past studies on heat vulnerability take into account multiple demographic details of each neighborhood when determining heat vulnerability (Harlan et al. 200613; Harlan et al. 2013[^Harlan et al. 2013]; Reid et al. 200914). Future works involving IETs should include statistical representations of social characteristics and demographic rankings in order to assess non-ecologically based factors for heat vulnerability. (Eneboe)
Q4: What demographic and lifestyle attributes are associated with IET among a population of urban residents?
Climate change and urbanization create an increasing risk of heat related illness (Frumkin et al. 201416). As a matter of prevention, we need to understand if and how heat affects people differently in order to develop more specialized interventions. The severity of the effect of heat on health varies on levels from individual to community and depends on factors such as physiology, demographics, and the built environment (Kovats and Hajat 200817). This study investigated which individual attributes (i.e., race, gender, socioeconomic status, number of pets) may be associated with person-to-person variability in heat exposure. From IET and background survey data, a multivariate regression model was created to assess associations between attributes and average daytime, nighttime, and all-hours IET. Daytime differences were significantly associated with the indoor/outdoor statuses of exercise habits and occupation. Both all-hours and nighttime differences were significantly associated with the nighttime thermostat levels. Quantifying differences in heat exposure associated with different attributes, behaviors, and resource use, can help researchers better identify vulnerable populations. (Singh)
Q5: What is the effect of temperature on activity levels with respect to age?
As people age, their bodies’ ability to efficiently thermoregulate declines, thus increasing the physiological susceptibility of the elderly to heat-related illness and mortality during high temperature conditions (Kenny and Munce 200318; Kovats and Hajat 200817). Concern about heat- related risks may therefore inhibit the elderly from partaking in daily activities. In this study, we examine the effect of temperature on activity levels among participants over 50 years of age within the sample (hereafter the “50+ group”). The 50+ group had homogeneous nighttime IETs, but throughout the day, IETs were more variable and higher midday. Activity intensity levels were similar among the 50+ group, who reported partaking in medium and higher activity levels early in the morning and low levels throughout the day. High activity intensity levels were also observed during the afternoon, which often coincided with higher IETs. Daily routines or acclimatization may play a role in this finding; 83% of the 50+ group lived in a home they owned, which may suggest long-term investment in the region and acclimatization to the hot temperatures in Phoenix. (Betzel)
Q6: How does health status affect IET and thermal comfort in a warm, urban setting?
Heat can have an adverse effect on health, especially for individuals with pre-existing chronic diseases (Kovats and Hajat 200817). Under extreme heat conditions, an individual’s health status may alter their experience with temperature through adaptive behaviors. This study explores how individuals with different health statuses experience heat in Phoenix, Arizona. We paired participants that self-evaluated their health compared to their peers as “fair” or “poor” (hereafter the “low health group”) with participants that evaluated their health as “good” or “excellent” (hereafter “high health group”) while controlling for relative age, race, gender, and neighborhood of residence. We compared the groups in terms of average IET and thermal comfort during all hours, daytime hours (12PM-6PM), and nighttime hours (12AM-6AM). We found that the high health group measured higher average IETs during the study week compared to the low health group, with more pronounced differences during the daytime. In our sample, there was not enough data to suggest that healthier people felt more or less comfortable under similar temperature conditions. However, there were a few cases suggesting that the high health group felt more comfortable in the same temperatures than the low health group. By understanding the relationship between health statuses and thermal experience, we can help to prevent heat related illness. (Kaml)
Q7: What is the relationship between heat exposure, occupation, income, and leisure time physical activity?
Heat is an important part of daily life in the urban area of Phoenix, Arizona; it often causes changes in routines, habits, and activities of valley residents. While it has been shown that workplace heat exposure is a major health concern and that certain occupations require more heat exposure than others (Gubernot et al. 201319), less attention has been paid to Leisure Time Physical Activities (LTPA) as affected by workplace heat exposure. In Phoenix, heat exposure becomes even more important to study in the context of an individual’s occupations, and income can be a factor in determining an individual’s vulnerability or adaptive capacity to heat exposure (Harlan et al. 200720).
This research examines the relationship between heat exposure, occupation, income, and LTPA. We found that the amount of heat exposure during an individual’s workday can be associated with changes in LTPA heat exposure. Income differentials between people and neighborhoods can also be associated with varying heat exposure during LTPA. For example, two case study participants in higher income brackets were more likely to include LTPA as a part of their lives than those in lower income brackets due to heat exposure required through their occupations. Inside workplaces also appeared more likely to induce outdoor LTPA. These results suggest that analyses of heat exposure must be considered in all aspects of an individual’s life, including the workplace, the home, and other leisure-related places; heat exposure in all three of these spaces of an individual’s life likely influences the choices made about LTPA. (Rohan-Kohl)
Q8: How does Sense of Place affect IET?
Sense of Place, a multidimensional construct of emotional and cultural attachment to a specific geographical location, can highly influence people’s behaviors and attitudes regarding the activities they carry out day by day (Macintyre et al. 200221). These activities determine time spent outside and affect personal exposure to heat, an excess of which can have adverse effects on health (Bell 1981)22. The level of Sense of Place and the extent to which it influences IETs was studied in two of the study neighborhoods in Phoenix: Thunderhill, an Ahwatukee residential community, and Coffelt-Lamoreaux, a public housing project in Central City South Phoenix.
IETs were analyzed and contextualized with qualitative Sense of Place data gathered through surveys and interviews. Residents of Thunderhill presented a high level of Sense of Place, while Coffelt-Lamoreaux residents had very low levels. In terms of temperature, Thunderhill participants had lower average daily and all hours IETs and Coffelt-Lamoreaux participants recorded marginally higher average daily and all hours IETs. Data collected suggests that participants from both neighborhoods spend considerable amounts of time outdoors, thus increasing heat exposure. However, the motive (leisure vs. necessity) behind exposure to heat makes a difference in whether those participants feel positively or negatively about the spaces they move through. These findings will help us to further understand human-environment interactions, as well as social complexity in urban areas. (Munoz Encinas)
Q9: How can intergenerational perspectives inform health interventions within a vulnerable community?
The degree to which an individual is vulnerable to heat-related illness or mortality has shown to be related to extrinsic (behavior, infrastructure) and intrinsic (disabilitiy, age) factors (Kovats and Hajat 200817:). The Coffelt-Lamoreaux Public Housing Project (hereafter “Coffelt”) in Phoenix, Arizona is an island of low-income residents currently without air-conditioning amidst a sea of industrial business properties. It is important to study factors of vulnerability within communities like Coffelt in order to create effective and sustainable solutions that mitigate adverse health effects resulting from heat exposure. A Health Impact Assessment (HIA) is a method that seeks to effectively integrate health protection and promotion into future plans for a community through conversations with key informants, stakeholders, and community experts (Quigley et al. 200623). An HIA was conducted in Coffelt and the resulting suggestions included changes in access to healthy foods, increased physical activity, safe streets and transportation, and healthy and safe housing (Majumdar 201424). Through my own interviews with members and stakeholders of Coffelt, proposed renovations for Coffelt Park were reviewed in regard to community building, heat exposure, and cooling opportunities. It was noted how valuable an intergenerational perspective of a community could be in realizing how proposed changes can realistically affect residents and other stakeholders. (Dastan)
Q10: How does a neighborhood community in a warm climate utilize cooling and hydrating resources?
Human exposure to excessive heat is an increasingly important public health problem (Harlan et al. 200613). Within the city of Phoenix, Arizona, individuals must find ways to cope with extreme heat through cooling and hydrating resources and strategies. The lack of resources to cope with this environmental hazard characterizes vulnerable communities and individuals within the city (Harlan et al. 200613). The 13utilization of an air-conditioned resource, for example, would decrease an individual’s harm from exposure and decrease community vulnerability (Chow et al. 201225).
This research study examined the use of cooling and hydrating resources within the Garfield neighborhood of Phoenix, Arizona. Researchers noted the presence and absence of cooling and hydrating resources through field observations. Participants in the IET Study that lived in Garfield were interviewed and asked to draw their neighborhood by hand. Participants shaded in areas they perceived to be thermally warmer and cooler with different color highlighters. Participants then shaded in areas where they felt comfortable and safe, as well as areas where they felt uncomfortable and unsafe. Participants also labeled places where they considered cooling or hydrating resources to be. These heat sketch maps were analyzed using Geographical Information Systems (GIS) and compared to the inventory compiled by the research team. Each participant identified at least two hydrating resources other than their place of residence as cooling and hydrating resources. There was great overlap between thermally cool and comfortable/safe regions within heat sketch maps. In most of the maps, participants marked hydrating and cooling resources near areas deemed uncomfortable/unsafe, thus indicating a potential mismatch between the location of resources and the ease with which individuals may access those resources. Information of this nature can allow policy makers and community leaders to become more aware of what needs to be done to improve hydrating and cooling resource access that can affect the quality of life of individuals in Phoenix, Arizona. (Sevig)
Discussion
This study contributes to a growing base of evidence and support in the scientific literature for approaching interventions for heat and other health concerns from a more localized and personalized perspective (e.g., Basu and Samet 200226; Kamel Boulos et al. 2011 27 for crowdsourcing public and environmental health surveillance; Kuras et al. 2015 12 for extreme heat; Rumbach et al. 2014 28 for examining flood recovery; Sutton et al. 2008 29 for examining social media warnings about wildfires; Swan 2009 30 for using patient-driven health-care models). The personal heat exposure approach allows for investigations into a diverse suite of questions, as evidenced from the range of research topics developed and addressed by the undergraduate student researchers. This methodology also provides opportunities for students in to improve skills (e.g., Excel, GIS, research design, interactions with participants, and science communication) through mentorship, motivation, and trial and error.
Meanwhile, the IET approach helps to explain how, where, and when intra-city differences in outdoor temperatures manifest themselves into the heat exposure of urban residents. This quick response project revealed important inter- and intra-neighborhood differences in heat exposure that have not been explicitly considered or quantified in the scientific literature published to date. In the Phoenix metropolitan area, as well as in many other cities, exacerbating factors for heat vulnerability and adverse heat-related health events disproportionately impact disadvantaged populations (Harlan et al. 201320; Harlan et al. 2013[^Harlan et al. 2013]; MCDPH 20142). Decision makers can use IET information to efficiently target interventions for the places, persons, and times of highest vulnerability. Insights drawn from understanding extreme heat at the individual level may better enable health providers, emergency managers, and citizens themselves to eliminate preventable adverse disaster-related health events.
Acknowledgements. The research team thanks the study participants and the people of all five involved neighborhoods. Professors Sharon Harlan (ASU) and Jennifer Vanos (Texas Tech University) provided valuable support throughout the research process, including lab space and iButtons temperature sensors. Additional funding was provided by the Central Arizona Phoenix Long-Term Ecological Research Program (CAP LTER) and the Center for Policy Informatics (ASU).
References
-
NCHS (National Center for Health Statistics). 2014. Deaths Attributed to Heat, Cold, and Other Weather Events in the United States, 2006–2010. Available: http://www.cdc.gov/nchs/data/nhsr/nhsr076.pdf [accessed 3 August 2014]. ↩
-
MCDPH (Maricopa County Department of Public Health). 2014. Heat-Associated Deaths in Maricopa County, AZ. Final Report for 2012. Available: http://www.maricopa.gov/publichealth/Services/EPI/pdf/heat/2012annualreport.pdf [accessed 1 August 2014]. ↩ ↩ ↩
-
Petitti, D.B, D.M. Hondula, S. Yang, S.L. Harlan, and G. Chowell. 2014. “Multiple Trigger Points for Quantifying Heat-Health Impacts: New Evidence from a Hot Climate. Environmental Health Perspectives 124, no. 2: 176-183 .DOI:10.1289/ehp.1409119. ↩
-
Anderson, B.G., and M.L. Bell. 2009. “Weather-Related Mortality: How Heat, Cold, and Heat Waves Affect Mortality in the United States.” Epidemiology 20:205-213. ↩ ↩
-
Harlan, S.L, G. Chowell, S. Yang,, D.B. Petitti, E.J. Morales Butler, B.L. Ruddell, and D.M. Ruddell. 2014. “Heat-Related Deaths in Hot Cities: Estimates of Human Tolerance to High Temperature Thresholds.” International Journal of Environmental Research and Public Health 11: 3304-3326. ↩
-
Bobb, J.F., R.D. Peng,, M.L. Bell, and F. Dominici. 2014. “Heat-Related Mortality and Adaptation to Heat in The United States.” Environmental Health Perspectives 122, no. 8: 811-816. ↩ ↩
-
Davis, R.E., P.C. Knappenberger, P.J. Michaels, and W.M. Novicoff. 2003. “Changing Heat-related Mortality in the United States.” Environmental Health Perspectives 111, no. 14: 1712-1718. ↩
-
Hondula, D.M., M. Georgescu, and R.C. Balling Jr., 2014. “Challenges Associated with Projecting Urbanization-Induced Heat-Related Mortality. Science of The Total Environment 490: 538-544. ↩
-
Knowlton, K., B. Lynn, R.A. Goldberg, C. Rosenzweig, C. Hogrefe, J.K. Rosenthal, and P.L. Kinney. 2007. “Projecting Heat-Related Mortality Impacts Under a Changing Climate in the New York City Region.” American Journal of Public Health 97, no. 11: 2028-2034. ↩
-
Sheridan, S.C., M.J. Allen, C.C. Lee, and L.S. Kalkstein. 2012. “Future Heat Vulnerability in California, Part II: Projecting Future Heat-Related Mortality.” Climatic Change 115, no. 2:311-326. ↩
-
Hondula, D.M., R.E. Davis, J. Rocklöv, and M.V. Saha. 2013. A Time Series Approach for Evaluating Intra- City Heat-Related Mortality. Journal of Epidemiology and Community Health 67: 707-712. ↩
-
Kuras, E.R., D.M. Hondula, and J. Brown-Saracino. 2015. “Heterogeneity in Individually Experienced Temperatures (IETs) “Within an Urban Neighborhood: Insights from a New Approach To Measuring Heat Exposure.” International Journal of Biometeorology 59, no. 10: 1363–1372. doi: 10.1007/s00484-014- 0946-x. ↩ ↩
-
Harlan, S.L, A.J. Brazel, L., Prashad, W.L. Stefanov, and L. Larsen. 2006. “Neighborhood Microclimates and Vulnerability to Heat Stress.” Social Science and Medicine 63, no. 11: 2847–2863. ↩ ↩ ↩ ↩ ↩ ↩
-
Reid, C.E., M.S., O’Neill, C.J. Gronlund, S.J. Brines, D.G. Brown, A.V. Diez-Roux, and J. Schwartz. 2009. “Mapping Community Determinants of Heat Vulnerability.” Environmental Health Perspectives 117, no. 11: 1730-1736. ↩ ↩
-
Harlan, S.L., J.H. Declet-Barreto, W.L. Stefanov, and D.B.Petitti. 2013. “Neighborhood Effects on Heat Deaths: Social and Environmental Predictors of Vulnerability in Maricopa County, Arizona.” Environmental Health Perspectives 121, no. 2: 197-204. ↩
-
Frumkin, H., J. Hess, G. Luber, J. Malilay, and M. McGeehin. 2008. “Climate Change: The Public Health Response.” American Journal of Public Health 98, no. 3: 435–445. ↩
-
Kovats, R.S., and S. Hajat. 2008. “Heat Stress and Public Health: A Critical Review.” Annual Review of Public Health 29: 41-55. ↩ ↩ ↩ ↩
-
Kenney, W.L., and T.A. Munce. 2003. “Invited Review: Aging And Human Temperature Regulation.” Journal of Applied Physiology 95, no. 6: 2598-2603. ↩
-
Gubernot, D.M., G.B. Anderson, and K.L. Hunting. 2013. The Epidemiology of Occupational Heat Exposure in the United States: A Review of the Literature and Assessment of Research Needs in a Changing Climate.” International Journal of Biometeorology 58, no. 8:1779-88. Doi 10.1007/s00484-013-0752-x ↩
-
Harlan, S.L, A.J. Brazel, G.D. Jenerette, N.S. Jones, L. Larsen, L. Prashad, and W.L.Stefanov. 2007. “In the Shade of Affluence: The Inequitable Distribution of the Urban Heat Island.” Research in Social Problems and Public Policy 15:173-202. ↩ ↩
-
Macintyre, S., A. Ellaway, S. Cummins. 2002. “Place Effects on Health: How Can We Conceptualise, Operationalise and Measure Them?” Social Science and Medicine 55, no. 1:125-139. ↩
-
Bell, P. 1981. “Physiological, Comfort, Performance, and Social Effects of Heat Stress.” Journal of Social Issues 37, no.1: 71-94. ↩
-
Quigley, R., L. den Broeder, P. Furu, A. Bond, B. Cave, and R. Bos. 2006. Health Impact Assessment International Best Practice Principles. Special Publication Series No. 5. Fargo, USA: International Association for Impact Assessment. ↩
-
Majumdar, N.D. 2014. The Coffelt Case: A Case Study of the Coffelt-Lamoreaux Public Housing Redevelopment HIA. Phoenix, AZ: Local Initiatives Support Corporation. ↩
-
Chow, W.T, W.C. Chuang, and P. Gober. 2012. “Vulnerability to Extreme Heat in Metropolitan Phoenix: Spatial, Temporal, and Demographic Dimensions.” The Professional Geographer 64, no. 2: 286-302. ↩
-
Basu, R., and J.M. Samet. 2002. “An Exposure Assessment Study of Ambient Heat Exposure in an Elderly Population in Baltimore, Maryland.” Environmental Health Perspectives 110, no. 12: 1219-1224. ↩
-
Kamel Boulos, M.N., B. Resch, D.N. Crowley, J.G. Breslin, G. Sohn, R. Burtner, W.A. Pike, E. Jezierski, and K.Y. Chuang. 2011. “Crowdsourcing, Citizen Sensing and Sensor Web Technologies For Public And Environmental Health Surveillance and Crisis Management: Trends, OGC Standards and Application Examples.” International Journal of Health Geographics 10:67. ↩
-
Rumbach, A., C. Makarewicz, J. Nemeth, and D. Thomas. 2014. Understanding Household Recovery Following the Colorado Flash Floods (2013). Quick Response Grant Report series; 250. ↩
-
Sutton J., L. Palen, and I. Shklovski. 2008. “Backchannels on the Front Lines: Emergent Uses of Social Media in the 2007 Southern California Wildfires.” Proceedings of the 5th International ISCRAM Conference. ↩
-
Swan, M. 2009. “Emerging Patient-Driven Health Care Models: An Examination of Health Social Networks, Consumer Personalized Medicine and Quantified Self-Tracking.” International Journal of Environmental Research and Public Health 6: 492-525. ↩
Kuras, E., Hondula, D., Betzel, S., Dastan, C., Eneboe, J., Kaml, M., Munoz, M., Rohan-Kohl, L., Sevig, M., Singh, M., & Ruddell, B. (2015). Investigating the Individual Experience in Extreme Heat (Natural Hazards Center Quick Response Research Report Series, Report 255). Natural Hazards Center, University of Colorado Boulder. https://hazards.colorado.edu/quick-response-report/investigating-the-individual-experience-in-extreme-heat-1