The Power of Social Media: How Online Connections Expedited Public Services Following Hurricane Harvey
Publication Date: 2018
Abstract
Disasters and crises place often insurmountable demands on the emergency response apparatus of local, state, and federal authorities. In late August 2017, Hurricane Harvey descended upon Houston, a metropolis of 2.3 million people, and hovered over the city for days. As floodwaters continued to rise, so did the number of 911 calls for rescue, overwhelming Houston’s emergency response services, and forcing many to rely on their offline and online networks to seek help during and after the hurricane. This paper investigates the effect of community-level social capital on fatalities and debris removal, and the impact of social media on the governing infrastructure during Hurricane Harvey. Using geo-data on fatalities, levels of social capital, and debris removal, along with interviews, the author finds that: fatality rates were, in fact, lower in communities with higher levels of social capital; debris removal was expedited across communities with higher levels of social capital; and social media played a Janus-faced role during Hurricane Harvey—placing a heavy strain on government infrastructure—but also aiding agencies in conveying critical information in a time of need.
Background
Hurricane Harvey made landfall in Texas on August 25, 2017. The storm hovered over Houston for four and a half days, resulting in catastrophic flooding from the rainfall and subsequent dam releases throughout the Houston area. The Harrison County Flood Control District (HCFCD) recorded record-breaking rainfall measurements as high as 47 inches (see Figure 1). This disaster, like many before it, raised questions about what coastal cities such as Houston can do to cope with unexpected shocks and disturbances. Social capital—the ties that bind us—has and will continue to play a critical role as communities endure crises and environmental shocks, such as those posed by climate change (Dynes 20061; Chamlee-Wright 20102; Prasad et al. 20143).
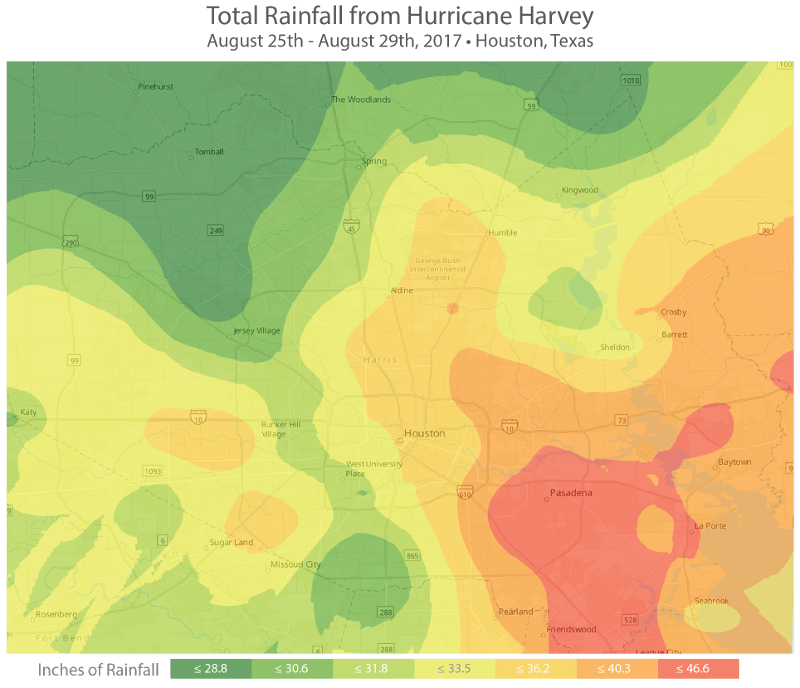
Figure 1: Total rainfall throughout the Houston area from August 25–29, 2017. Data Source: Harrison County Flood Control District
Data and Methods
The aim of this research is twofold: to explore how social capital interacted with different outcomes of Hurricane Harvey and to understand the effect that online social media had on the governing infrastructure. For the first research objective, I explored the interactions between social capital, fatalities, and debris removal. For the second research objective, I conducted a series of interviews in the Houston area to gain a greater understanding of how social media affected the larger governing infrastructure during Hurricane Harvey. To carry out these two research objectives, I tested the following three hypotheses:
- H1: Communities with stronger levels of social capital experienced fewer fatalities.
- H2: Communities with stronger levels of social capital experienced expedited debris removal.
- H3: Higher levels of online social media activity led to greater strain on the governing infrastructure during Hurricane Harvey.
To test H1 and H2, data (see Table 1) were collected on Harvey-related fatalities, debris removal, levels of social capital across communities in the Houston area organized by U.S. Census Block Groups (BGs), and a number of control variables used in linear and logistic regression to account for alternative explanations.
| N | Mean | SD | Min. | Max. | |
|---|---|---|---|---|---|
| Number of days to remove debris | 7215 | 2.27 | 4.27 | 0 | 31 |
| Rainfall (inches) | 7215 | 35.21 | 3.48 | 30.53 | 47.44 |
| Social Capital Score | 7215 | 23 | 6 | 12 | 34 |
| Total Population | 7215 | 2337 | 2185 | 0 | 13315 |
| Owner Occupied Housing (%) | 7215 | 54 | 21 | 0 | 97 |
Dependent variables
Data on Harvey-related fatalities were collected to test H1: Communities with stronger levels of social capital experienced fewer fatalities. Harvey-related fatalities in Houston were provided by the Harris County Institute of Forensic Sciences. A total of 36 fatalities were reported as of September 25, 2017.
To test H2: Communities with stronger levels of social capital experienced expedited debris removal, debris data were sourced from the City of Houston 311 website. Individuals who called to request debris pickup following Hurricane Harvey were added to the 311 database, and the Houston Department of Solid Waste Management issued open and close dates for each request. For this analysis, I calculated the time that elapsed from the time the ticket was opened and closed to measure how long it took for the Department of Solid Waste Management to pick up the debris. This data was used as both an interval variable, to express the total number of days it took to close the request, and a binary variable, to express same-day pickup.
Explanatory variable
Community-level social capital data was generated from indicators from ESRI Business Analyst and organized into 418 BGs across the Houston area. Indicators were aggregated and weighted equally to compute a single social capital index score and spatially joined with each of the 7,215 debris tickets. Indicators include the percentage of people in a BG who: participated in any public activity in the past 12 months, attended a public meeting on town or school affairs, served on a committee for a local organization, volunteered for a charitable organization in the past 12 months, wrote or called a politician in the past 12 months, voted in a federal, state, or local election in the past 12 months, or attended a political rally, speech, or organized protest. Index scores ranged from 12 to 34. Using the Jenks natural breaks classification method, five categories were created to represent the strength of social capital across BGs: very strong (≤ 34), strong (≤ 29), moderate (≤ 24), weak (≤ 19) and very weak (≤ 15).
Control variables
Variables for rainfall, total population, and homeownership were included to test for alternative explanations. Rain measurements were obtained from 231 rain gages throughout the Houston area and provided by the HCFCD; measurements from damaged rain gages were excluded by HCFCD request. The contouring of rainfall measurements in Figure 1 was generated using the Empirical Bayesian kriging interpolation method. The total population and percent of homeownership in each BG were sourced from ESRI Business Analyst.
Interviews
I conducted a series of in-depth interviews to test H3: Higher levels of online social media activity led to greater strain on the governing infrastructure during Hurricane Harvey. The interviews aimed to understand how Houston was affected by Hurricane Harvey, how agencies used social media during Harvey, and what challenges individuals faced when responding to the needs of communities in the Houston area. A description of each interviewee is provided below.
- Major Chad Norvell is the commander of the Administration Bureau of the Fort Bend County Sheriff’s Office. In this capacity, Major Norvell oversees four captains who manage the following divisions: Records, Support Services, Emergency Operations and Communications, and the Gus George Law Enforcement Academy.
- Francisco Sanchez is the liaison for the Harris County Office of Homeland Security & Emergency Management. He is a member of the U.S. Department of Homeland Security Integrated Public Alert and Warning System working group, Houston Urban Area Security Initiative Regional Collaboration Committee, Greater Houston Partnership Disaster Recovery Task Force, East Harris County Manufacturers Association Community Relations Committee, and Harris County Disaster Animal Management Task Force.
- Angela Douglas is a senior police officer at the Houston Police Department (HPD), and currently serves as the social media coordinator, assigned to Public Affairs. Angela has worked in patrol, the Planning Unit, and the Criminal Intelligence Division. She has been the social media coordinator for five years and coordinates the HPD social media presence on Facebook, Twitter, Instagram, Snapchat, Pinterest, Tumblr, and Flickr, as well as on the community service website, the HPD Explorer website, and the HPD Explorer Twitter account.
- David E. Persse, M.D., is the public health authority for the City of Houston and physician director of the Emergency Medical Services for the Department of Health and Human Services.
- Congressman John Culberson is a U.S. Representative for Texas's 7th congressional district, serving since 2001. He is a member of the Republican Party and the Tea Party caucus.
- Cory Stottlemyer is the media relations specialist for Missouri City Government.
- Kelly Matte is the Homeowners’ Association liaison for Missouri City Government.
- Clifford McBean Jr. is the Senior MCTV producer for Missouri City Government.
Results and Analysis
H1: Communities with stronger levels of social capital experienced fewer fatalities.
Fatality rates were, in fact, lower in communities with higher levels of social capital (see Figure 2). Among the victims of Hurricane Harvey, 64 percent (23) perished in communities with weak to very weak levels of social capital. Thirty-six percent (13) of the victims were found in the immediate aftermath of the storm in areas with moderate to very high levels of social capital. This finding is consistent with previous research; for example, researchers found similar outcomes in the 1995 Chicago Heat Wave (Klinenberg 20034) and the 2011 Tōhoku earthquake and Tsunami (Aldrich and Sawada 20155). Community levels of social capital, which were reported in this study, and individual levels of social capital can provide individuals with powerful tools to get through times of uncertainty.
H2: Communities with stronger levels of social capital experienced expedited debris removal.
As a starting point to test H2, I conducted an analysis of variance (ANOVA) to observe whether there were differences between the rates in which debris was removed across communities and varying degrees of social capital. Differences across the five predefined levels of social capital (very strong, strong, moderate, weak, and very weak) were calculated.
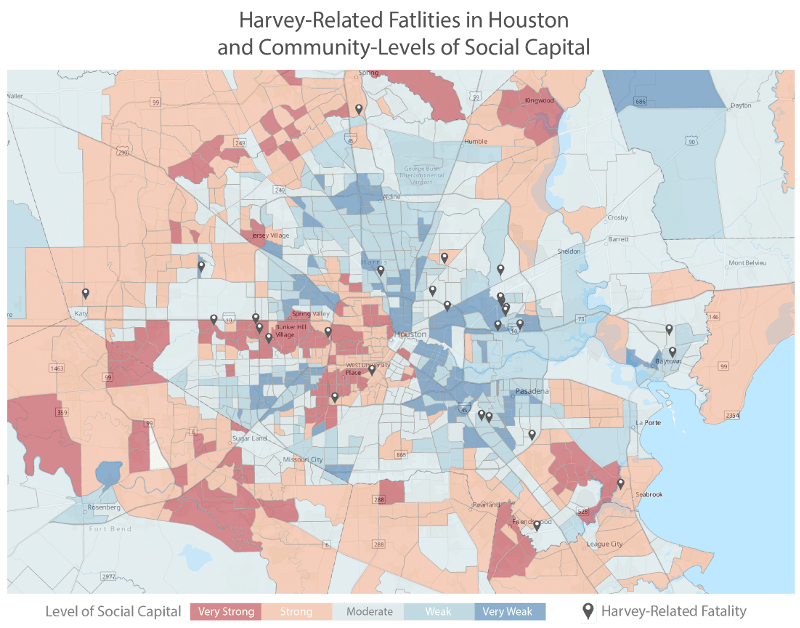
Figure 2: Harvey-related fatalities in Houston and community levels of social capital. Data Source: Harris County Institute of Forensic Sciences and ESRI
The ANOVA confirmed that communities with higher levels of social capital did, in fact, enjoy expedited debris removal. In the analysis of variance, the dependent variable was the number of days it took the Department of Solid Waste Management to remove debris from the site, and the level of social capital within the community was the independent variable. The ANOVA produced a p-value of .000, with descending means from very weak social capital (μ = 3.15) to very strong (μ = 1.32) social capital, allowing us to reject the null hypothesis (see Table 2). In this case, we see that there is a statistically significant difference between the disposal of debris across the five categories of social capital (see Figure 3).
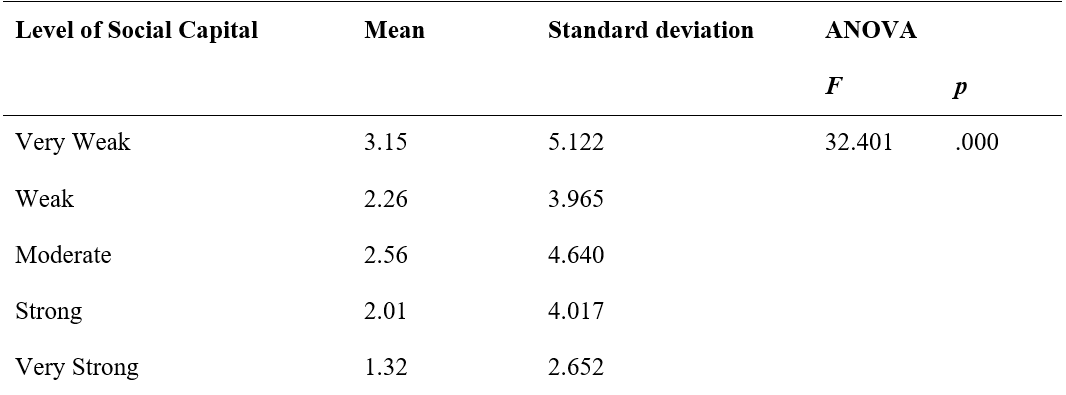
Table 2: ANOVA for the effect of social capital on debris removal
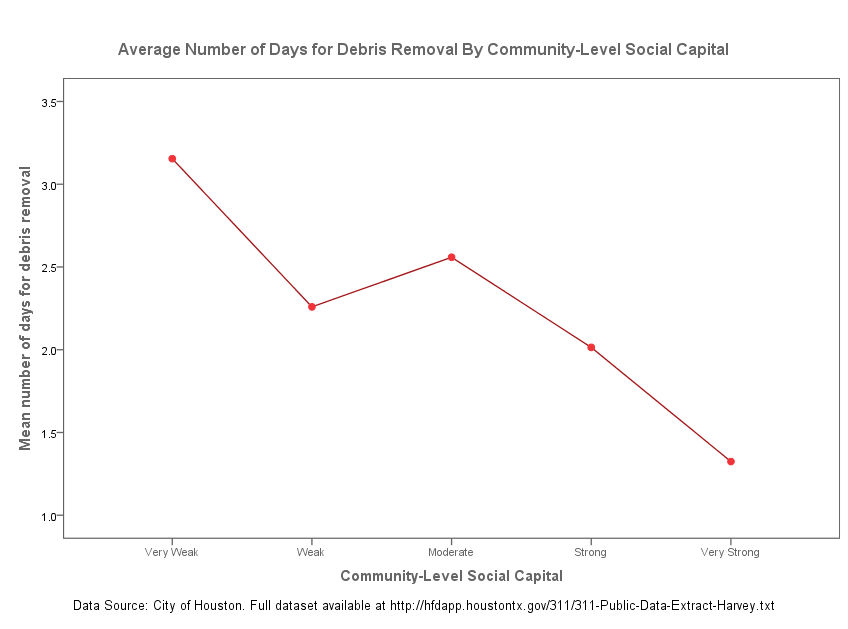
Figure 3: Average number of days for debris removal by community-level measures of social capital.
To further investigate the relationship between debris removal and community-level measures of social capital, I conducted a linear regression to confirm the findings from the analysis of variance. In a series of models, we see that social capital dramatically reduced the number of days it took for the Department of Solid Waste Management to remove debris. In the final model, by regressing together community-level measurements of social capital and the number of days for debris removal, and controlling for Harvey rainfall, total population, and homeownership, we see that all four variables have a statistically significant effect on debris removal, with social capital having the greatest effect (see Table 3). For every unit increase of social capital, we can expect a decrease of 4.707 days for debris removal. As we may expect, we also see that for every unit increase of rainfall, debris removal took .198 more days; this is only a slight increase, but the coefficient is reported in the direction we would expect. Finally, we observe that homeownership does help reduce the amount of time for debris removal, but only by .006 days.
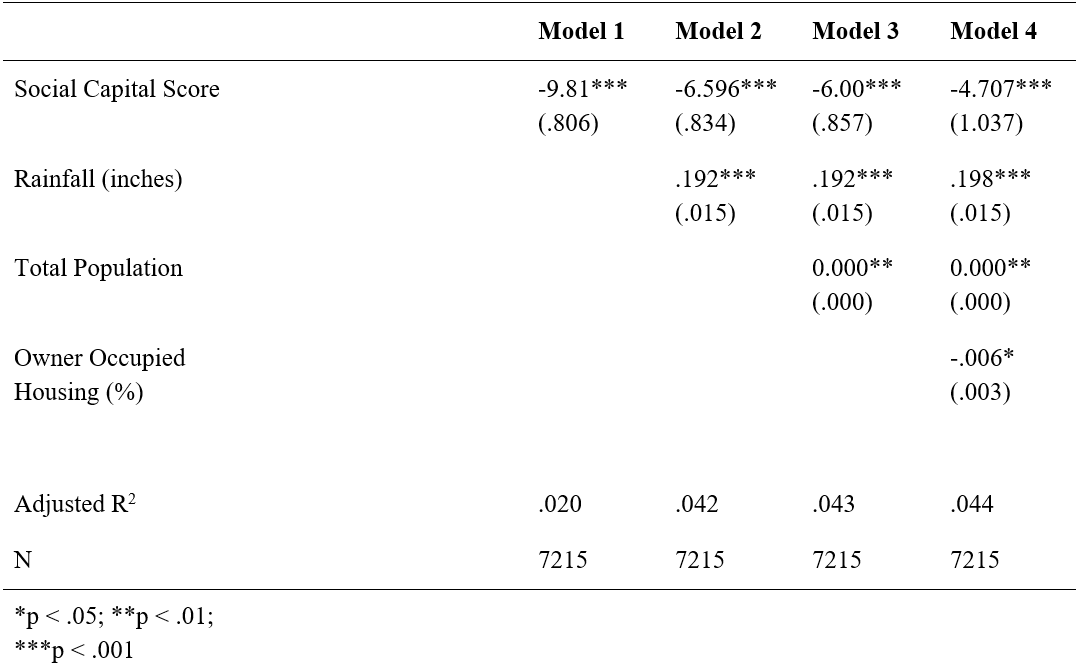
Table 3: Linear regressions of number of days to remove debris on social capital
Finally, in an exercise to see how potent social capital is in expediting debris removal, I transformed the dependent variable of debris removal into a binary indicator, coding “1” for same-day debris removal and “0” for all other values. As in the linear regression, we see that social capital is statistically significant and has the greatest effect (see Table 4). We observe here that for every one-unit increase in social capital, we can expect a 2.783 increase in the log odds of debris removal, holding all other independent variables constant. Further, the interpreted value of 16.16 for social capital indicates that when social capital is raised by one unit, the chance of same-day debris pickup is increased by a factor 16.
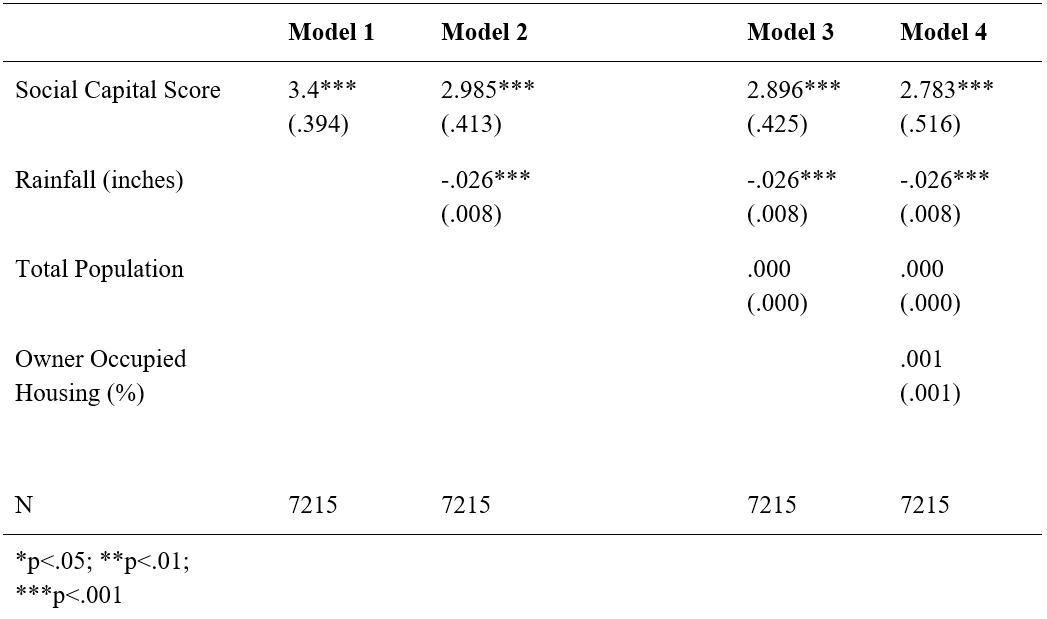
Table 4: Logistic regressions of same-day debris pickup and social capital
H3: Higher levels of online social media activity led to greater strain on the governing infrastructure during Hurricane Harvey.
In the course of my interviews in Houston, it became abundantly clear that social media is both a help and hindrance during large-scale disasters such as Harvey. Calls for help on social media apply great strains on emergency administrators, but social media also offers multiple platforms that agencies can use to convey critical information during and after hurricanes.
The conventional model of emergency response to disasters among local, state, and federal agencies is no more. The Harris County Office of Homeland Security & Emergency Management headquarters, located in Houston, is a stunning visual example of the physical infrastructure needed in a large metro area to process and respond to minute-by-minute changes. The headquarters is equipped with a Joint Information Center (JIC) that allows for the organization of timely information in emergency situations.
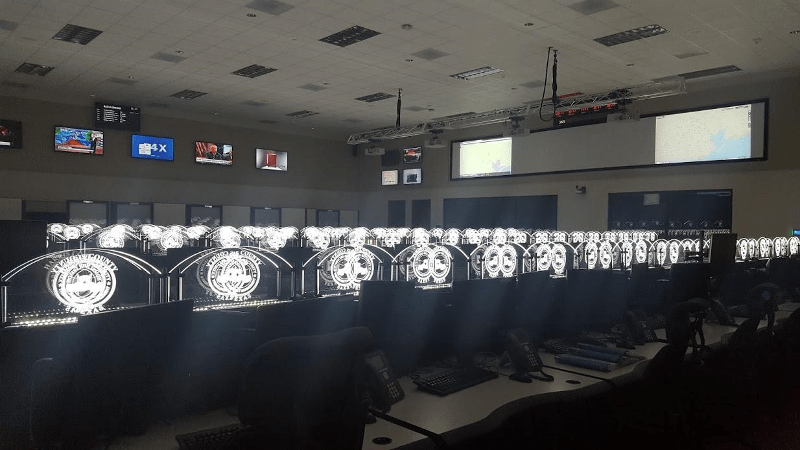
Figure 4: Ground floor of the Harris County Office of Homeland Security & Emergency Management. Photo credit: Courtney Page-Tan, October 16, 2017
However, these agencies are also adapting to the new landscape of high volumes of instant information from individuals across multiple social media platforms. As Officer Douglas from HPD put it, “It’s like trying to drink water from a fire hose.” Emergency dispatchers are now tasked with handling traditional 911 calls, for people whose calls get through, as well as monitoring social media posts. Three HPD officers were assigned to monitor social media calls for help during Harvey. However, as Officer Douglas recalled, the process of cross-referencing social media posts for help across multiple platforms against 911 phone calls was “not efficient” and “sluggish.” “It was way too much, too challenging,” she reported.
As streets became impassable, private citizens with boats and an ad hoc volunteer group known as the Cajun Navy, among others, turned to social media to see how they could help. Using apps like Zello, individuals—even Congressman Culberson, who represents the Houston area—dispatched able individuals to locations posted on Facebook, Twitter, and Nextdoor. Almost overnight, a powerful, informal, bottom-up network of emergency responders was borne.
With the power of social media, the conventional top-down emergency responses from government agencies have changed dramatically. Able and willing private citizens now have access to the information posted within their networks to spring into action. Yet, how the conventional top-down and new bottom-up approaches interact with one another in the future is unknown.
Discussion and Conclusions
As the saying goes, "It's not what you know. It's who you know." In the case of Hurricane Harvey, we observed lower fatality rates and expedited debris removal in communities with higher levels of social capital. We also witnessed the activation of a new bottom-up network of individuals and ad hoc citizen-led groups who responded to calls for help that were broadcast on social media platforms.
Policy makers should consider programs that have the potential to generate trust, norms of reciprocity, and civic engagement. Investment into social ties, and deepening reservoirs of social capital, have the potential to change future community outcomes after disasters. For example, time-banking programs, designed around social networks, have enabled community users to both offer and receive services that are assigned equal value. These programs have shown that the individuals who utilize this form of service exchange benefit from improved levels of social capital and health, especially among low-income individuals and those who live alone (Lasker et al. 20116). Community currencies—forms of currency earned through volunteering or bartering in local communities—have been found to increase levels of generalized trust (Richey 20077). Recent studies have also found that intervention programs designed with goals of leadership development (Brune and Bossert 20098), microfinance, and HIV education (Pronyk et al. 20089) have resulted in increased levels of social capital, despite the fact that these programs weren’t designed with those explicit goals.
References
-
Dynes, R. (2006). Social Capital: Dealing with Community Emergencies. Homeland Security Affairs, 2(2). ↩
-
Chamlee-Wright, Emily. (2010). The cultural and political economy of recovery: social learning in a post-disaster environment (Vol. 12). Routledge. ↩
-
Prasad, S., Su, H. C., Altay, N., & Tata, J. (2014). Building disaster‐resilient micro enterprises in the developing world. Disasters, 39(3) 447–466. ↩
-
Klinenberg, Eric. (2003). Heat wave: A social autopsy of disaster in Chicago. Chicago, IL: University of Chicago Press. ↩
-
Aldrich, D. P., & Sawada, Y. (2015). The physical and social determinants of mortality in the 3.11 tsunami. Social Science & Medicine, 124, 66-75. ↩
-
Lasker, J., Collom, E., Bealer, T., Niclaus, E., Keefe, J. Y., Kratzer, Z., ... & Suchow, D. (2011). Time banking and health: the role of a community currency organization in enhancing well-being. Health promotion practice, 12(1), 102-115. ↩
-
Richey, S. (2007). Manufacturing trust: Community currencies and the creation of social capital. Political Behavior, 29(1), 69-88. ↩
-
Brune, N. E., & Bossert, T. (2009). Building social capital in post-conflict communities: Evidence from Nicaragua. Social Science & Medicine, 68(5), 885-893. ↩
-
Pronyk, P. M., Harpham, T., Busza, J., Phetla, G., Morison, L. A., Hargreaves, J. R., ... & Porter, J. D. (2008). Can social capital be intentionally generated? A randomized trial from rural South Africa. Social science & medicine, 67(10), 1559-1570. ↩
Page-Tan, C. (2018). The Power of Social Media: How Online Connections Expedited Public Services Following Hurricane Harvey Natural Hazards Center Quick Response Research Report Series, Report 271). Natural Hazards Center, University of Colorado Boulder. https://hazards.colorado.edu/quick-response-report/the-power-of-social-media-how-online-connections-expedited-public-services-following-hurricane-harvey