Understanding Vulnerability and Adaptive Capacity to Large-Scale Power Failure in the United States
Publication Date: 2018
Abstract
The risk of U.S. electrical grid failure is growing. Despite this increased risk, there is very little understanding of household vulnerability to power failure as a hazard. Over three weeks in fall 2017, we conducted 42 door-to-door interviews with residents of Highlands and Orange Counties in Florida about their experiences with power failures caused by Hurricane Irma. Our sample of households represented a range of socioeconomic statuses, genders, ages, mobilities, neighborhood characteristics, and places of birth. Classical patterns of hazard vulnerability emerged in Irma-related power failures. Residents relied on material, social, and intellectual resources to protect themselves and recover from the negative effects of the hurricane. Residents with fewer of these resources were less equipped to handle the negative effects of the storm and blackout, and consequently suffered more. Early results also show that respondents who reported higher levels of stress after the storm and lower levels of agency and pathways thinking were of lower socioeconomic status. Qualitatively, these households were more likely to suffer more from the storm and struggle more in recovery. Understanding the patterns and specific mechanisms that lead to differential outcomes in complex hazardscapes, including power failure, may help planners and emergency managers address gaps in preparedness efforts that often leave those with the most need at highest risk.
Research Questions
On September 10, 2017, Hurricane Irma caused a loss of power for 6.7 million Florida electricity customers, representing nearly two-thirds of all accounts in the state (Florida Division of Emergency Management, 20171). Despite the growing risk of U.S. electrical grid failure from increasing physical and cyber threats, increasing demand, aging infrastructure, and a warming climate, there is very little understanding of household vulnerability to this hazard (Van Vliet et al., 20122). This limited understanding makes ensuring public health and safety during large-scale power outage events uniquely difficult, especially with regard to the wellbeing of society’s most vulnerable households. At the same time, hazards research has increasingly focused on multi-hazard events (Kappes 20123, 1925). Multi-hazard research involving large-scale blackouts, however, is limited by the (fortunately) low number of historical occurrences of such events. For example, our current research at Arizona State University (ASU) has attempted to add to this work by modeling the effects of simultaneous regional blackouts and heat waves (NSF #1520803), relying on hypothetical scenario-based interviews to elucidate blackout hazard information. Much of the existing work in this field has relied on synthetic data sources and modeling tools to predict the impacts of coupled and cascading hazard events (Korkali et al. 2017 4, 1; Espinoza, Panteli, Mancarella, and Rudnick 20165, 136; Panteli and Mancarella 20156, 259), while a much smaller set of studies has analyzed the confluence of physical and social hazards using empirical data (Sutley, Van de Lindt, and Peek 20177, 143).
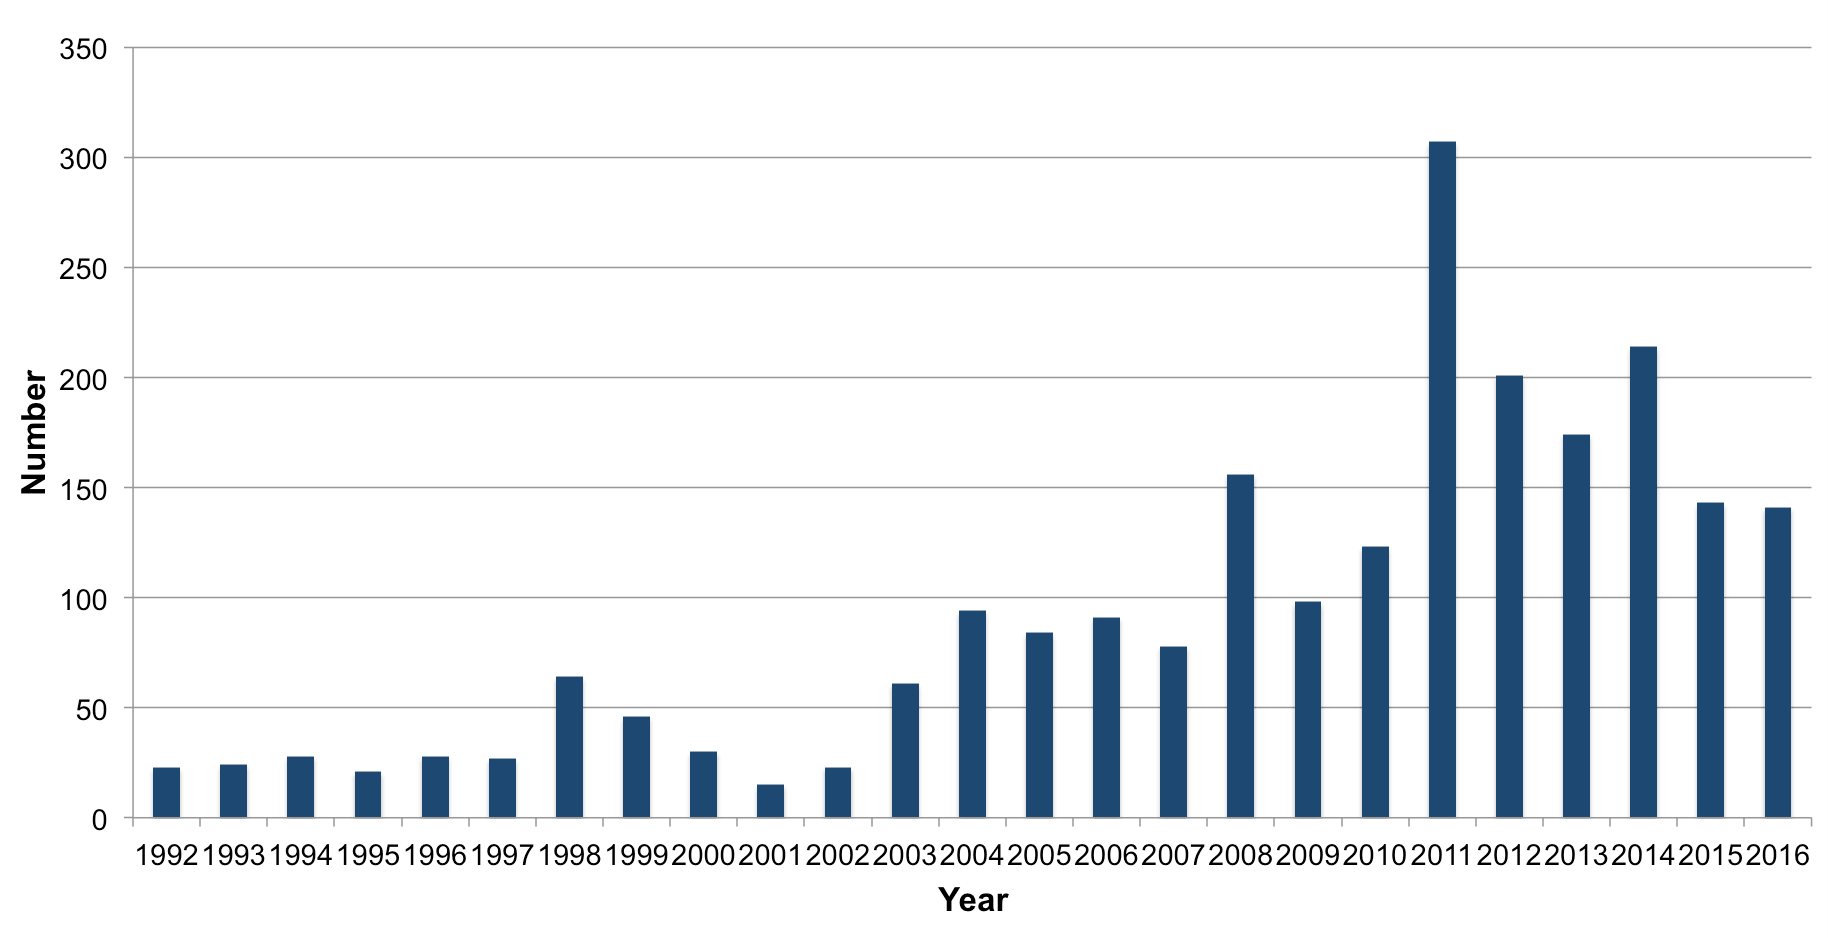
Figure 1. Annual number of major U.S. electrical grid disturbances 1992–2016. Source: NERC Electric Disturbance Events (OE-417) Annual Summaries.
To address this gap, we spent three weeks conducting door-to-door interviews in Florida following Hurricane Irma. The interview protocol allowed us to collect empirical data on how U.S. residents were impacted by large-scale power failure, and what residents did to adapt to the associated challenges. We sought to address the following research questions in conducting our study:
RQ1. What effects did a multi-day regional loss of electrical power have on households in an industrialized Western context? How did these effects differ by socioeconomic status or demographic characteristics?
RQ2. What did different households do to cope with a regional multi-day loss of electrical power, and which households had the least and greatest capacity to cope? Why?
RQ3. How did the independent effects of electrical power failure on households compare to the emergent effects of power failure concurrent with other hazards, such as heat or waterborne illnesses?
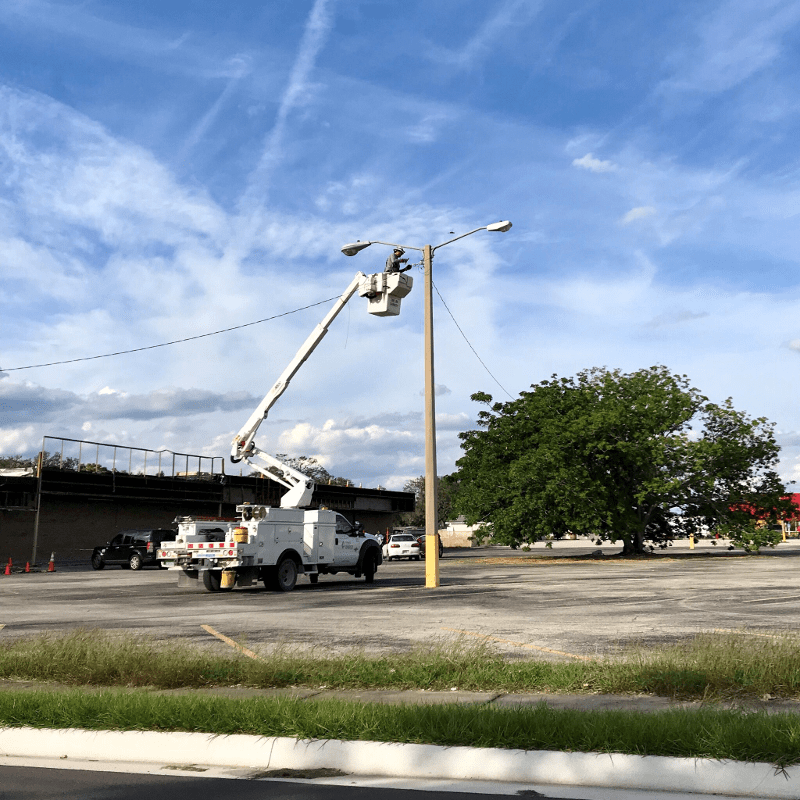
A lineman reconnects power to a light pole in Sebring, Florida, on November 10, 2017.
Methods
Sampling
To answer our research questions, we conducted semi-structured interviews in two specific contexts: One group of 20 interviews was conducted in primarily rural Highlands County, and another group of 22 interviews was conducted in primarily urban Orange County. This final sample size is commensurate with thresholds identified as sufficient for thematic analysis in cross-site research (Hagaman and Wutich 20178, 23). Only households with residents who were living at home without power for at least 72 hours after floodwaters had fully receded were included in the sample. Interviews were conducted daily from October 27–November 14. Our interests in understanding the effects of power failure as an isolated hazard motivated us to conduct our research in parts of the state where infrastructure damage associated with high hurricane winds, rainfall, and flooding was less severe. Hurricane Irma made landfall in the Florida Keys at 05:30 UTC on September 10. Orange County, further north, was chosen because it suffered less wind- and water-related damages than other counties with similar or greater levels of power failure, in part due to its location (Sheets and Glenn 20179). Highlands County was also chosen because of its inland location, reducing the likelihood of impacts from strong storm surge or deep flooding. Finally, Highlands County experienced near 100 percent outage conditions — the most comprehensive power failure in the state. On September 11, 99 percent of utility customers in the county were without power; 47 percent were still without power on September 18 (Florida Division of Emergency Management 2017; Rozyla 201710).
Within each of these counties, we selected 10 census tracts that collectively represented the socioeconomic and demographic composition of the county for our study. Tracts and parcels were selected using data available from the Florida Geographic Data Library (Florida Parcel Data By County - 201011, 2010). First, ten census tracts were randomly selected from all possible tracts in each county. Next, each randomly selected tract was checked for representativeness against each county's population. Median tax assessed home value, median income, percentage of female residents, percentage of non-white residents, percentage of homeowners, and median age were used to assess representativeness. The goal of targeting a representative sample was to capture a range of experiences and not merely the central tendency (i.e., all 10 tracts did not each have the average composition of their county; some individual tracts were predominantly non-white or older, or had a higher percentage of renters, but as a whole, the ten tracts together represented the county's averages. We then randomly sorted a list of residential parcels within each county and solicited participation from two households within each, continuing this through the random list. We went to the first house on these lists to solicit participation at the door. No incentives were offered.
Two canvassing strategies were used. On and before October 30, 2017, a house would be visited up to three times before going to the next house on the random list, and in the event that no one answered the door, we left letters with information about the research and contact information. Houses were skipped if the author failed to make contact after three attempts or if the household refused to participate, was ineligible to participate, was inaccessible, was vacant, or was nonexistent. Once an interview was secured, the author would proceed to the next house on the randomly generated list for that census tract and repeat this same sampling protocol until two interviews in each tract were completed. However, this protocol was reassessed and modified mid-deployment. One reason for our modification was our observation that spatial patterns of power failure were not as homogenous as we anticipated. As a result, neighbors next to each other may not have both been eligible; this made returning repeatedly to a house only to discover that they had power very time-consuming and inefficient. Second, whether or not a household was eligible, the distance between selected census tracts became a major logistical issue. It took considerable time to drive between distant tracts, and often we only spent a few minutes in one tract (e.g., if we experienced two consecutive unsuccessful contact attempts). Because of our short deployment period and extremely limited personnel, we did not have time for these inefficiencies. For this reason, after October 30, the author went to the first random parcel (or last random parcel selected following the previous strategy) in each tract. If the author failed to make contact there, the author then immediately proceeded to the neighbor to the left of that parcel and continued door-to-door in that direction through the neighborhood until two interviews were secured in that tract. In cases where an entire block or subsection of a tract was ineligible (e.g., had power), the author proceeded to the next random parcel in the tract that was eligible and then continued leftward door-to-door from there. Furthermore, after October 30, when information was available to the author that the next house was ineligible (e.g., from a neighbor or Google Street View), that house was skipped.
In addition, we encountered large-scale, private, gated developments in five tracts in Orange County that required us to discard those tracts and select new ones for sampling. Replacements were made following the same procedure as the original selection. This resulted in some sampling bias away from higher-income communities; however, because we were predominantly interested in better understanding vulnerable populations, we considered this an acceptable concession. One tract was inaccessible in Highlands County, but this tract was not replaced because of time limitations. Two tracts in Orange County yielded no successful interviews, and these tracts were not replaced. An average of 2.6 interviews were completed across the 17 tracts; the median number of interviews completed per tract was 2. Our final response rate was 34.7 percent (35.5 percent in Orange County and 33.8 percent in Highlands County).
Data collection
At the start of every interview, households were screened to ensure that they did indeed lack power for at least 72 hours after any floodwaters had receded, and that residents were living in and maintained a physical presence in the home during that time. If a selected household did not meet these criteria, it was not included in the study. For eligible and willing households, interviews were conducted by the primary author and recorded on his Apple iPhone 7 using a semi-structured interview protocol that was developed by our research team (please reference appendix). After establishing eligibility and consent, closed-ended demographic information and responses to two psychological questionnaires were recorded on Samsung Galaxy Tab A6 tablets. We used two psychological questionnaires to assess states of stress and hope. Both scales measured states as opposed to dispositional attitudes given the temporal proximity of our interview to the hazard event. We chose state measures to capture any temporary changes in disposition that would have been relevant during the event. To measure stress, we used the 10-item Perceived Stress Scale (PSS), originally developed as a 14-item scale by Cohen, Kamarch, and Mermelstein (1983). The tool is designed to measure “the degree to which individuals appraise situations in their lives as stressful” (Cohen, Kamarch, and Mermelstein 198312, 385). We used the 10-item variant because it has been demonstrated to have superior psychometric validity and reliability (Lee 201213, 121). In order to measure hope, we used the State Hope Scale, which was designed by Snyder, Sympson, Ybasco, Borders, Babyak, and Higgins (1996) to measure "agency (belief in one’s capacity to initiate and sustain actions) and pathways (belief in one’s capacity to generate routes) to reach goals" (Snyder et al. 199614, 321). We theorized that the construct of social capital drives disparate social outcomes through the mechanism of psychological disposition, which we measured using the PSS and Hope scales. Based on theories of social capital, we anticipated that households that typically identified as vulnerable would have higher PSS scores and lower Hope scores (Bourdieu, Wacquant 199215).
Content analysis is currently being conducted by the authors. We will combine our geographic, demographic, psychological, and interview data in order to better understand the relationships between exposure, demography, psychological dispositions, and hazard experiences.
Data cleaning, processing, and analysis
Recorded interviews were transcribed by a professional transcription company (GoTranscript.com) from January 9–18, 2018. We are currently in the process of a 10 percent spot check for quality control (Bernard, Wutich, and Ryan 201616). Clean transcripts will be coded using analysis software, such as MAXQDA, in order to examine several areas of interests, including:
Disparities between the experiences of more and less vulnerable groups, including low-income households, minority households, socially isolated individuals, households with mobility-impaired individuals, and households with very young or very old individuals.
Categories of behavioral adaptations and the capacities that enable them.
Negative health and wellbeing impacts from the blackout and their proximate and distal causes.
These broad interests will be explored by coding the interview transcripts for themes and constructs using a structured codebook. We will use multiple coders, and results will be checked for intercoder reliability. In some cases, constructs may be value-coded and weighted and then compared with demographic variables and the associated psychological scores for each transcript.
For our preliminary analysis, presented in the results section of this report, all closed-ended results were generated using SPSS version 24. Closed-ended field data was collected on a Samsung Galaxy Tab A6 using KoBo Toolbox open source survey software designed using the Open Data Kit standard for mobile data collection. Psychometric scales were self-administered in the author’s presence, who was available to answer questions about the questionnaire. All other closed-ended data was author-administered over the course of the interview. In some cases, the author did not read all questions to the respondent verbatim. For example, if during the interview a respondent indicated that he or she was driving somewhere during the blackout, the author may have documented that the respondent had access to a working car without asking the respondent this question explicitly. All preliminary qualitative analysis was completed in MAXQDA version 12. Qualitative themes and exemplar quotes were identified using word frequencies of respondents’ speech pulled from MAXQDA version 12 after implementing a stop list of common articles, prepositions, conjunctions, pronouns, and interjections. Text for respondents' speech was isolated using a built-in auto-coding feature for the word "interviewee" and synonyms (e.g., "speaker 2") at the paragraph level.
Results
Sample Descriptives
Our sample ultimately contained a broad distribution of socioeconomic and demographic representation (please reference appendix Table 1). There was an even split between both men and women, and the sample was over-representative of non-white households, homeowners, and single-family homes, compared to all households in the state of Florida (U.S. Census Bureau 2012–201617). The sample represented a range of working statuses and education levels, as well as time living in the current county, household sizes, and incomes. The median and modal income range of the sample was $20,000–$40,000. The sample also included several individuals who did not have access to a working car and/or did not speak English. Residents in our sample had a variety of experiences with Hurricane Irma. In 20 percent of households, at least one person evacuated because of the storm. Other adverse events reported by respondents included problems accessing medical care (12 percent) and difficulty accessing food or water (26 percent). Nearly seventy-five percent of households interviewed reported helping a neighbor or relative outside the home before, during, or after the storm. Nearly half of the sample households interviewed used a generator.
Measurement Validity
To test the validity of our psychological measures, we conducted several tests for which we knew the correct direction of association. After scoring each scale, we tested both the PSS and Hope scores for validity against each other, as there should be a strong negative correlation between the two. Appropriately, our PSS and Hope scores are significantly negatively correlated at a p ≤ 0.01 level when tested using a one-tailed Spearman's Rho (r = -.542). In addition, we tested the PSS score against a simple measure of self-reported stress (r = .391, p ≤ 0.05), and discomfort (r = .649, p ≤0.01) from Irma and found significant positive correlations. Overall, both the PSS and Hope scores appear to have good construct validity.
Preliminary findings
Spatial Disparities
Early in our fieldwork, we noticed spatial disparities in the blocks that were eligible for the study and the ones that were not due to the length of experienced power failure. This pattern was especially evident in Orange County but was also evident to some extent in Highlands. Newer, and often wealthier (as measured by home values), neighborhoods were less likely to be eligible for our interview than older or poorer neighborhoods because the newer neighborhoods had not lost power for a duration that would qualify them for the study (at least 72 hours). This trend led to the formation of a new hypothesis on the spatial disparities and probable social inequities in power-failure events, with respect to both frequency and duration. We are currently testing this hypothesis as part of several new research projects analyzing this theme.

The neighborhood on the right did not lose power due to Hurricane Irma, but the neighborhood on the left lost power for seven days. We suspect that social and political capital interacts with material resources to create these inequities.
Generator Use
Out of our forty-two respondents, 19 households used a generator. Most demographic characteristics of generator users were not significantly different from nonusers, including income. Interviews showed that generators were attained in similar ways by both low and high income households. However lower-income households were more likely to report that doing so—and especially attaining fuel—was a burden. At the same time, purchasing or using a generator was one of the most frequently mentioned things respondents said they would do differently if they found themselves in a similar situation again. This sentiment is exemplified in the following transcribed text:
"Author: Sure. Would you do anything differently?
Respondent 2: Get a generator.
Author: Okay.
Respondent 2: I'm not afraid of the storm.
Author: Just the power outage?
Respondent 2: Yes. It's just being able to survive after the storm is ridiculous.” (Respondent H8617)
Nonetheless, some of the most frequently mentioned complaints about the blackout from generator users and nonusers alike had to do with generator use. In particular, attaining fuel, making repairs, and noise and air pollution were frequent complaints, as exemplified in the following quotes:
"Generator, it's dangerous too. You have to leave it outside.” (Respondent O1734)
"If you're upset because my generator is going, then kick rocks [chuckles].” (Respondent O8229)
"I hooked up my generator and blew up everything in my house.” (Respondent H1813)
"Then—what about the fifth day or sixth day—one of the propane tanks, the one that I took over, had a malfunction, and a fireball came out of it. My brother-in-law was burnt half of his body, and he had severe second degree burns. . . Yes, it was like an explosion, and then when the EMTs and emergency came within, they took the propane because I could smell the gas something awful. They took and then pitched it out in the middle of the golf course. The neighbor next door is the one that heard the explosion. They came over, and they see the fire, they call the fire department; otherwise, I'm not sure we would have. Jill couldn't get out the door because the fire was on that end of it, so she ran outside and picked up the hose. We had three fire extinguishers, they broke. One handle broke off of one, two of them they couldn't get going or working. It was just chaotic.” (Respondent H1708)
Bivariate correlations of the Hope and PSS scales with generator use revealed no significant effects, though the signs were in the anticipated direction. Hope had a positive effect, and stress had a negative effect on generator use. We plan to explore the relationship between the types and degrees of adaptations respondents engaged in and their hope and stress scores more during our deeper qualitative analysis. The knowledge theme was also important across our interviews, and generator use was a clear example of its occurrence. Figure 2 shows the result of our inductive identification of this theme using a basic word frequency search of our transcripts. Several households complained that improper storage and inadequate maintenance of a generator left them without a working source of backup power when they thought they were prepared; more knowledgeable individuals were more likely to overcome these obstacles. Not only could knowledge about proper storage and maintenance ensure a working generator, but more knowledgeable individuals were also better able to take advantage of second-hand equipment that others could not get to work.
"Oh, yes. I mean, generator, we didn't have one. Two days before you couldn't find one. Bought that one for $50 with no carburetor on it. You know, pieced one together, put it on, crank it right up, it works. There aren't many people out there that can do that.” (Respondent H2111A)
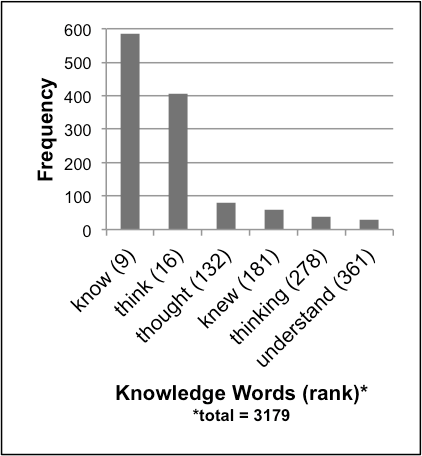
Figure 2. Word frequency counts of the most commonly mentioned knowledge words across 42 semi-structured interview transcripts based on respondents’ speech only. The list was cleaned using a stop list of common articles, prepositions, conjunctions, pronouns, and interjections.
Effects of socioeconomic status
We anticipated that socioeconomic status (SES) would be negatively correlated with our PSS scores (r = -.387) and positively correlated with our Hope scores (r = -.412). We observed a significant association in these directions at the p ≤ 0.01 level using Spearman’s bivariate correlation. Furthermore, we anticipate that SES will be positively associated with an increase in adaptive capacity and that changes in Hope and PSS scores may modify this relationship. We will test this hypothesis as part of our ongoing analysis, wherein we plan to create an index of adaptive capacity and vulnerability based on qualitative structural coding for the constructs in each interview. If this index correlates significantly with our psychometric scales and with SES in the directions we expect, we will conduct a path analysis to test our PSS and Hope scales as mediators. SES, income, and cash on hand were clearly important factors in household resiliency, evident from a word frequency search and an inductively identified financial theme (see Figure 3). Residents living paycheck-to-paycheck complained that they were unable to adequately prepare for the storm, while those who had the luxury of time and money were able to buy what they needed ahead of time.
"I would have been more prepared, but my paycheck didn't come until after the hurricane. I made it right before the hurricane was going to hit, by that time there was no supplies left.” (Respondent H2111A)
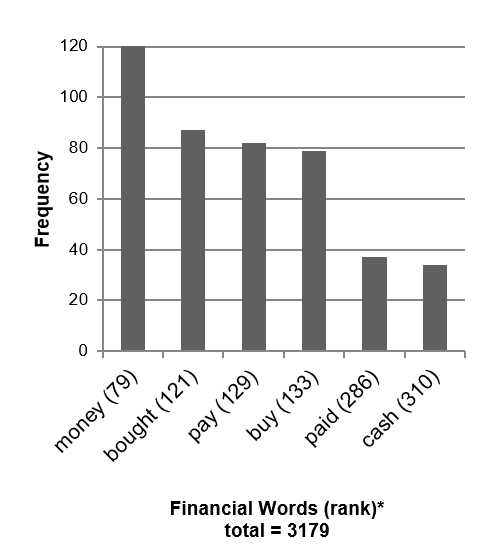
Figure 3. Word frequency counts of the most commonly mentioned financial words across 42 semi-structured interview transcripts based on respondents’ speech only. The list was cleaned using a stop list of common articles, prepositions, conjunctions, pronouns, and interjections.
Helping others
It is clear from our interview results that social connection between family members and between friends was extremely important in preparedness and recovery. During our word frequency analysis, a clear social theme emerged from the data (see Figure 4). We anticipated positive associations among the self-reported frequencies of respondents helping others with Hope scores, SES, and years spent living in the same county, and negative associations with PSS scores. However, we could not find a relationship of any kind between the frequencies of respondents helping others and psychological disposition, SES, or length of residency. We find this result surprising and plan to investigate it further in our ongoing qualitative analysis.
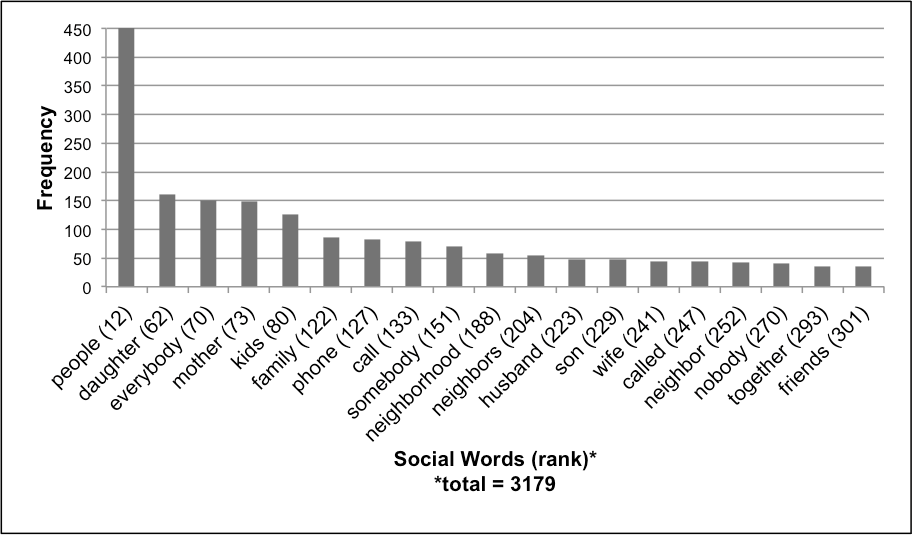
Figure 4. Word frequency counts of the most commonly mentioned social words across 42 semi-structured interview transcripts based on respondents’ speech only. The list was cleaned using a stop list of common articles, prepositions, conjunctions, pronouns, and interjections.
Thermal
Respondents' thermal experience was a major theme throughout our interviews. The majority of respondents listed heat as the most significant factor contributing to their discomfort in the days following the storm, not only from the blackout, but also from the storm altogether. In 38 of 42 interviews, the respondents mentioned the word "heat" or "hot" at least once (see Figure 5). Excessive heat was discussed as a threat to health, as well as a source of discomfort. Heat was typically discussed in terms that conveyed its role in amplifying or multiplying existing problems, making an already problematic situation worse.
"It was really stressful because I have a one year old in the house, and it's hot in there and you have no power. I'm using my battery for my car too much, and the battery end up dying, and I can't start it and it can't work. I just have to leave them with no clothes in the house, and we all sleeping right here on the carpets because we can't sleep on the room, it's really hot.” (Respondent O1838)
"Well, just nauseous because you're so hot.” (Respondent H1127)
"Author: Were you guys involved in helping other people in any way? Emotional support, giving somebody a sandwich, or anything like that? Interviewee: No. We didn't have the opportunity because we were so tired and so sick because of the heat. We couldn't.” (Respondent O3950a)
"When this hurricane goes through, I guarantee you, there's not going to be any atmosphere left. When they go, they take everything with them. It was hot. My puppies’ tongues were hanging out, I thought they were going to die. We were hot, we were miserable, we were getting on each other's nerves, we had every fan possible we could have, running.” (Respondent H593)
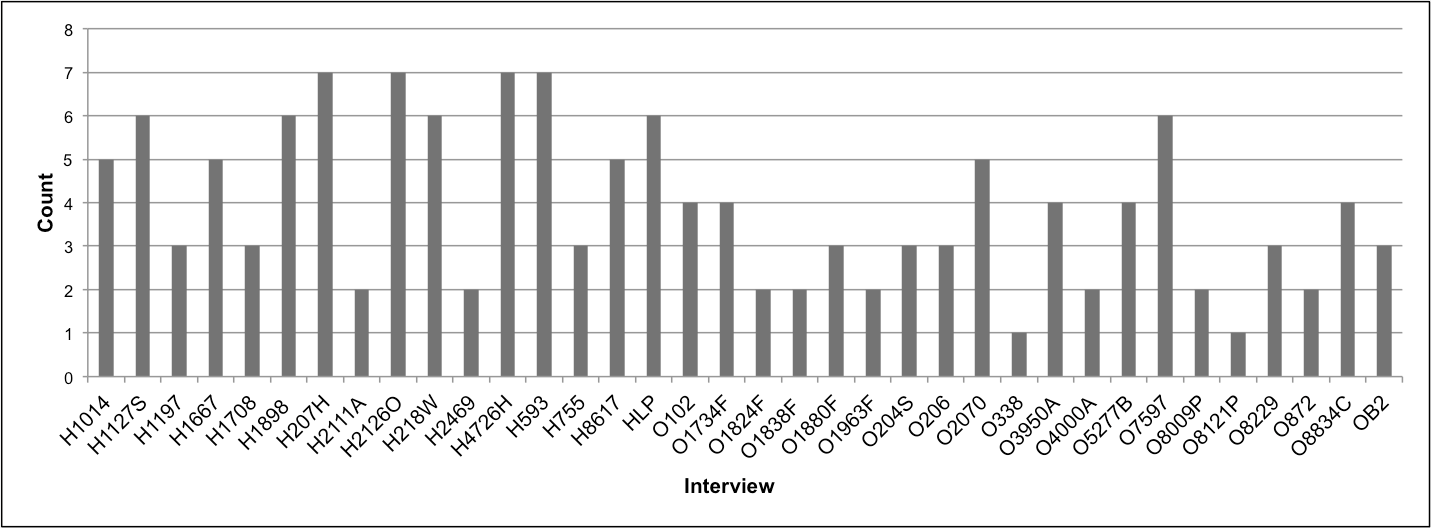
Figure 5. Count of “heat” or “hot” in respondent-only segments by interview. Thirty-eight of forty-two interviews included one or both words.
Hazard Outcomes
We explored several hazard outcome variables. First, we tested two closed-ended variables: limited access to food and water due to the storm and limited access to medical care due to the storm, regressed by SES and psychological disposition using binary logistic regression. We did not find a predictive association between SES or psychological disposition and limited food or medical care, although we did find that the two outcomes themselves (i.e., limited food and limited medical care) are highly correlated with each other using Spearman’s Rho (r = 0.61 p ≤ 0.01). We would like to better understand the circumstances in which these two outcomes co-occur and what mechanisms drive their coupling, and we plan to investigate this further using the interview data. While we suspected that SES and psychological disposition may each independently predict the ordinal degree to which respondents self-assessed their recovery (1 = not recovered at all, and 5 = completely recovered), neither was a significant predictor. We plan to explore respondent geography as potentially correlated with these outcomes using respondent parcel data and measures of spatial autocorrelation. We believe geography could be an important variable due to spatial differences in the physical vulnerabilities of the electric grid, as well as differences in the degrees of different neighborhoods’ community resilience. In addition, we would like to test our psychometric measures on additional outcome variables that will be quantified from the interview transcripts, such as days without power, the extent to which the event was a financial hardship, and the presence or absence of damage to the home.
Adaptive Capacity
From our preliminary interview analysis, we identified the most common adaptive strategies and capacities based on word frequencies (see Figure 6). Based on these early results, in combination with the themes identified above, we believe that households' experience with this hazard generally fit with accepted disaster theory (Adger and Kelly 199918, 253). Respondents in Highlands and Orange Counties relied on their material, social, and intellectual resources in order to shield themselves and recover from the Hurricane. Of the major problems caused by the blackout itself, the most common complaint mentioned was the heat, and this is reflected in the dominance of the key word “water” in the interviews, which was mentioned more often than “gas,” “food,” or “generator,” as well as by the inclusion of the word “ice,” mentioned more frequently than “battery.” Many respondents noted the use of water or ice as their only options for cooling off. Somewhat sensibly, the second most common keyword was “generator,” which of all the possible adaption techniques most directly solves the lack of electricity. Also frequently occurring was the word “gas,” which was a prerequisite to generator use and a scarce commodity during the blackout. Other keywords include “money” and “car,” both of which are involved in the procurement and use of gas, and in the use of the strategy of leaving (“leave”/“left”), which was frequently mentioned. We have not yet deeply analyzed the proportion of respondents who left at certain times or for which reasons (e.g., power failure versus storm damage or getting help versus providing help). In order to participate in the study, respondents must have lived in their home without power for at least 72 hours, but in many cases, respondents had previously evacuated, or they left their homes after spending three days without power.
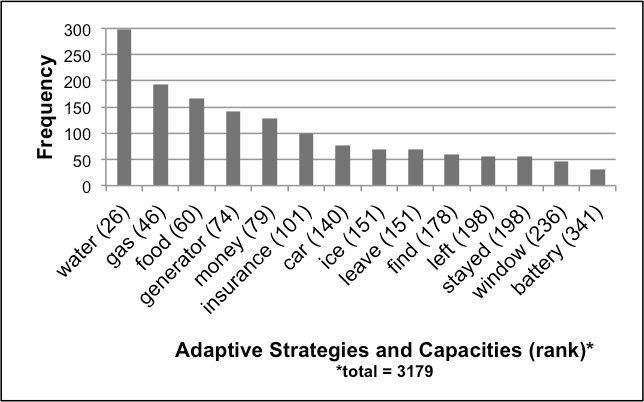
Figure 6. Word frequency counts of the most commonly mentioned adaptive strategies and capacities across 42 semi-structured interview transcripts based on respondents’ speech only. The list was cleaned using a stop list of common articles, prepositions, conjunctions, pronouns, and interjections.
Ongoing Analysis and Future Applications
This work is novel and ongoing. To date, there is a dearth of empirical information on the effects of power failure on this scale in a modern context, leaving emergency mangers and policy makers little information on how best to help those with the most need. Moving forward, we would like to continue to investigate the different attributes of our respondents in comparison with their interview content. In particular, we plan to create an index of adaptive capacity and of vulnerability and value code each interview for these concepts. We plan to test the effects of psychological stress and hope on the adaptive capacity and vulnerability scores.
The use of psychometric instruments to measure the mediating effects of social structure on hazards outcomes is a new method for better understanding how more vulnerable populations come to experience worse outcomes. This innovation allows us to empirically test the theorized effects of social structure on health outcomes.
Hazards researchers and managers are increasingly interested in multi-hazard events, and natural hazards of all types often carry the risk of power failure. Our understanding of the blackout hazard is often obscured or modified by the effects of the primary event. Because of the long delay in the restoration of power to many Florida residents after Hurricane Irma, there was a distinctive opportunity to discover what effects a widespread lack of utility power had on U.S. households. Using semi-structured interviews to conduct this research on the ground immediately after the crisis allowed us to collect fine-scale data on precisely why and how this hazard affected residents and exactly why and how it affected more and less vulnerable residents differently. This work will be submitted to a peer-reviewed journal and presented at professional meetings. In addition, we are actively seeking new funding opportunities to examine research questions that were generated from these initial results. We are using our developing understanding of this event to better prepare households for future power outage events and to better inform emergency managers about the potential roadblocks to preparedness—and to recovery—that many residents faced.
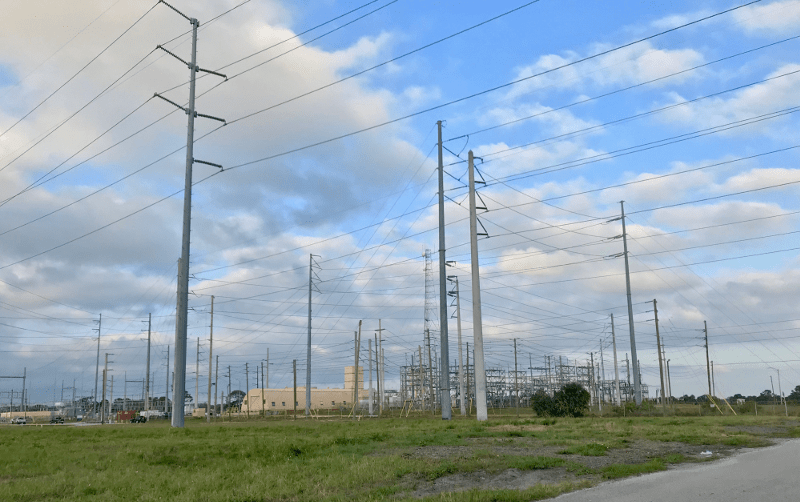
Electrical substation near Sebring, Florida, that became inoperable due to Hurricane Irma.
Appendix
Download The Appendix
Download the Report Tables
References
-
Florida Division of Emergency Management. “Outage Reports.” Florida Disaster, 2017. ↩
-
Vliet, Michelle T. H. van, John R. Yearsley, Fulco Ludwig, Stefan Vögele, Dennis P. Lettenmaier, and Pavel Kabat. “Vulnerability of US and European Electricity Supply to Climate Change.” Nature Climate Change 2, no. 9 (2012): 676–81 ↩
-
Kappes, Melanie S., Margreth Keiler, Kirsten von Elverfeldt, and Thomas Glade. “Challenges of Analyzing Multi-Hazard Risk: A Review.” Natural Hazards 64, no. 2 (2012): 1925–58. ↩
-
Korkali, Mert, Jason G. Veneman, Brian F. Tivnan, James P. Bagrow, and Paul D. H. Hines. "Reducing Cascading Failure Risk by Increasing Infrastructure Network Interdependence." Scientific Reports 7 (2017): 44499 ↩
-
Espinoza, Sebastián, Mathaios Panteli, Pierluigi Mancarella, and Hugh Rudnick. "Multi-phase Assessment and Adaptation of Power Systems Resilience to Natural Hazards." Electric Power Systems Research 136, no. C (2016): 352-61. ↩
-
Panteli, and Mancarella. "Influence of Extreme Weather and Climate Change on the Resilience of Power Systems: Impacts and Possible Mitigation Strategies." Electric Power Systems Research 127, no. C (2015): 259-70. ↩
-
Sutley Elaina J., van de Lindt John W., and Peek Lori. “Multihazard Analysis: Integrated Engineering and Social Science Approach.” Journal of Structural Engineering 143, no. 9 (2017): 04017107. https://doi.org/10.1061/(ASCE)ST.1943-541X.0001846. ↩
-
Hagaman, Ashley K., and Amber Wutich. "How Many Interviews Are Enough to Identify Metathemes in Multisited and Cross-cultural Research? Another Perspective on Guest, Bunce, and Johnson’s (2006) Landmark Study." Field Methods 29, no. 1 (2017): 23-41. ↩
-
Sheets, Tess., and Glenn, Caroline. 2017. “How Orlando fared: Irma's damage from UCF to I-Drive.” http://www.floridatoday.com/story/news/2017/09/12/how-orlando-fared-irmas-damage-ucf-drive/656279001/ ↩
-
Rozyla, Lauren. 2017. “Highlands County residents facing 'desperate situation' after Irma”. WFTS. http://www.abcactionnews.com/news/highlands-county-residents-facing-desperate-situation-after-irma ↩
-
Florida Geographic Data Library. “Florida Parcel Data By County – 2010.” 2010. https://www.fgdl.org/metadataexplorer/full_metadata.jsp?docId=%7B9A3569D1-53E7-4E9D-AB40-2D4BF740DA38%7D&loggedIn=false ↩
-
Cohen, Sheldon, Tom Kamarck, and Robin Mermelstein. "A Global Measure of Perceived Stress." Journal of Health and Social Behavior 24, no. 4 (1983): 385-396. ↩
-
Lee, Eun-Hyun. "Review of the Psychometric Evidence of the Perceived Stress Scale." Asian Nursing Research 6, no. 4 (2012): 121-27. ↩
-
Snyder, C., Susie Sympson, Florence Ybasco, Tyrone Borders, Michael Babyak, and Raymond Higgins. "Development and Validation of the State Hope Scale." Journal of Personality and Social Psychology 70, no. 2 (1996): 321-35. ↩
-
Bourdieu, Pierre, and Loïc J. D. Wacquant. An Invitation to Reflexive Sociology. Chicago: University of Chicago Press, 1992. ↩
-
Bernard, H. Russell, Amber Wutich, and Gery Wayne Ryan. Analyzing Qualitative Data: Systematic Approaches. Thousand Oaks: SAGE, 2017. ↩
-
U.S. Census Bureau, 2012-2016 American Community Survey 5-Year Estimates. https://factfinder.census.gov/faces/nav/jsf/pages/searchresults.xhtml?refresh=t#none ↩
-
Adger, Neil., and Mick Kelly. "Social Vulnerability to Climate Change and the Architecture of Entitlements." Mitigation and Adaptation Strategies for Global Change 4, no. 3 (1999): 253-66. ↩
Chakalian, P., Kurtz, L., & Hondula, D. (2018). Understanding Vulnerability and Adaptive Capacity to Large-Scale Power Failure in the United States (Natural Hazards Center Quick Response Research Report Series, Report 275). Natural Hazards Center, University of Colorado Boulder. https://hazards.colorado.edu/quick-response-report/understanding-vulnerability-and-adaptive-capacity-to-large-scale-power-failure-in-the-united-states