Assessing the 2023 Floods in Rural Vermont
Multimodal Methodology and Community Science for Mitigation in the Black River Valley
Publication Date: 2025
Abstract
Over three days in July of 2023, torrential rains saturated the ground and flooded the Black River Valley, destroying dozens of homes, businesses, and recreational areas along with roads and other infrastructure, and injuring and killing farm and companion animals. This study examined response, recovery, and mitigation work post-2023 flooding in the rural Black River Valley of Vermont. We collaborated with community organizers and municipal officials to develop a research project that addressed gaps and needs identified by community partners. Those needs included: accurate and accessible mapping of flood impacts and relevant resources; monitoring of water infrastructure like culverts, ditches, and drains; collecting data in rural, underserved areas; and making visible impacted community members’ stories. We aimed to understand two things. First, how social scientists and engineers can best collaborate with community groups, activists, and response and recovery professionals to create new knowledge about response, recovery, and mitigation of inland flooding events; and second, what communication strategies can make this knowledge available and accessible for multiple audiences as events increase in frequency and intensity. We used a mixed-methods approach that included community-based participatory research and ethnographic participant observation, participatory mapping using paper maps, community science mapping of critical infrastructure, and interviews. Our preliminary findings are clustered in three areas: (a) the importance of scientific collaboration with community partners; (b) the role of researchers in empowering residents in small scale flood mitigation work; and (c) the need to acknowledge and address barriers to technology access for useful, accessible data visualization about flooding response, recovery, and mitigation efforts. As our research progressed, we developed tools and resources to support and inform local, regional, and state policy and practice on response, recovery, and mitigation. We recommend that research teams seek appropriate local partnerships with community organizations and municipalities and implement initiatives that enhance their partners’ capacity and generate data on specific mitigation needs.
Introduction
This study focused on the social impacts and experiences surrounding what the National Weather Service now calls The Great Vermont Flood of 10-11 July 2023 (Banacos, 20231). Though thankfully loss of life was minimal (only one person died), the flood continues to have significant impacts on health, infrastructure, economies, and livelihoods, with immediate and long-lasting changes to how people live in, relate with, and understand their physical landscape and local communities.
Our study sites in 2024 included the Black River watershed and the White River watershed, both of which flow into the larger Connecticut River basin. Towns in these rural watersheds are characterized by scenic landscapes, close social ties, interconnected municipal needs, vast wealth disparities, minimal to no public transit, and employment that is largely driven by a weather-dependent tourist economy. In the Black River Valley alone, impacts from the flood were many, including and beyond the dozen vertical feet of water rendering many residents’ homes unlivable. Wastewater treatment facilities in Ludlow, Vermont, and several other towns were inundated and rendered inoperable, leading to weeks of boil-water notices and deep damage to local economies catering to out-of-state tourists; fire department buildings and roads were washed out, impacting communities’ access to emergency service and health care; grocery stores and pharmacies went underwater, destroying their stock and making facilities inoperable in one key shopping hub town for a full year; recreational fields were destroyed, removing one key way that locals connect and engage with each other.
More frequent and intense flooding events in these watersheds have prompted town managers, regional planners, and state officials to reassess what counts as critical infrastructure and modify land use in impacted areas. These official reviews of infrastructure (such as dams, culverts, bridges, roads, water treatment plants, health clinics, and fire stations) have demonstrated needs more comprehensive than town budgets can address. Local and national businesses have reconsidered where to site pharmacies, grocery stores, restaurants, and recreational sites.
These layered transformations in mountain river valleys make them a good site to study recurrent floods as socio-technical-natural processes. We used anthropological and geographical theory and methods as well as engineering practice and what we call critical disaster pedagogies (Reddy et al., 20252) to examine and support community response, recovery, and ongoing mitigation efforts. Using these methods, we identified the impact of gaps in communication and information sharing on (a) technical capacities, (b) social structures, and (c) material needs. We kept a specific focus on how people access knowledge about disaster-related planning processes, technical information, and resources for recovery, with parallel attention to how people make such knowledge before, during, and after an acute flooding event. This report describes our research methods and preliminary findings. This project is part of a larger research collaboration that we are spearheading called the Rural Rivers Project. You can find more information about this collaboration—which brings together research partners at Dartmouth College, Colorado School of Mines, disaster response and mitigation agencies, and flood-impacted communities in Vermont—on our website.
Literature Review
Risk Communication and Knowledge Sharing
In Vermont, as elsewhere, town, state, and federal officials often have inadequate insight into local needs and few means to improve community awareness of hazards, risks, and resources. Meanwhile impacted residents engage unevenly with formal communication tools that have been designed to improve their understanding, despite these tools using a variety of media, including digital, audio, televised, and print. These facts mean that gaps in communication and knowledge sharing are two-way gaps—formal knowledge holders do not have local insight, and local knowledge holders do not have access to tools needed to formally communicate locally relevant and accurate information.
Scholarship on disaster response and resilience has long identified such gaps in communications and management practices between people in communities experiencing disaster impacts, on the one hand, and the regional, state, and federal governance systems tasked with supporting response and mitigation, on the other (Birkmann & von Teichman, 20103; Li et al., 20194; Reddy et al., 20245; Ullberg et al., 20236; Wukich & Mergel, 20157; United Nations Office of Disaster Risk Reduction, 20158). In disaster studies literature, numerous stakeholders (including emergency managers; state and municipal officials; and impacted residents) identify communications gaps as a key challenge among stakeholder groups. For instance, Hart et al. (20249) described how a Houston neighborhood experienced attempts by federal agencies to establish Community-Based Disaster Resilience Management, noting that barriers to community members’ engagement included lack of trust in government, meetings being inconvenient to attend, and a sense that people can “do it [better] themselves” (p. 8).
Challenges for communicating risks and resources with vulnerable residents include: (a) uneven knowledge about and access to such tools; (b) varied legibility of each tool; and (c) poor or inadequate representation and maintenance of relevant information (Bezanson, 202510; Malinak & Wells-Spackman, 202411). Further, assumptions about what kind of knowledge should be communicated, and by whom, shapes expectations about whose information should be prioritized. These expectations lead to complex problems in communicating risk, facilitating recovery, and planning for mitigation.
The main sources of flood information in the United States are probabilistic flood maps. However, these maps often fail to reflect lived experiences of flooding. This is in part because flood inundation maps produced by the Federal Emergency Management Agency (FEMA) rely on imperfect data. Rural Rivers affiliate Noah Bezanson, writing on this topic with our team, provides a few very basic examples of this (Bezanson et al. 2025). For instance, topographic data produced by the U.S. Geological Survey, which undergirds FEMA’s flood map as a base elevation map, had ground elevation differences of about 12 feet (National Research Council, 200912). FEMA flood maps in Vermont and other parts of the United States are based on data collected in the 1970s and last reviewed in 2007; they therefore may not represent current conditions. Further, as Gebremedhin and co-authors (202013) have shown, flood heights measured by stream gauges in North Carolina and Florida had an average uncertainty of 1 ft. At normal water levels, 1 ft foot may be unremarkable as a margin of error, but when it is the difference between a flood control dam overtopping and not, it is too wide.
Such variation in reliability of floodplain mapping and water level monitoring may create hazardous situations when homes or other structures are inaccurately excluded from a regulatory floodplain boundary, or dams are believed to be safe unless visually inspected during a flood. These compounding uncertainties impact flood insurance eligibility and requirements before and after flooding. They also raise the chances that emergency managers and residents’ reliance on these tools may put them at unforeseen risks as they seek to make informed decisions. This is, of course, assuming that residents have access to, and training in understanding, the implications of different regulatory designations and presentations of scientific data.
Many critical anthropological and geographic studies of flood response and recovery are conducted in urban coastal areas (Barrios, 201714; Binns, 202315; Hart et al., 2024; Moser et al., 201416; Steinberg, 201817; Swyngedouw, 200418). Studies of rural inland flooding, however, are less common. Though often similarly insightful in terms of the structural economic, social, and political dynamics that create the context for flooding and shape recovery, the lessons learned in urban coastal areas may not be applicable in rural riverine contexts. Lower population densities, distinct land use practices, different flooding and erosion dynamics in river valleys, specific communication and coordination practices, and different infrastructural realities set rural areas apart.
To discuss this common disjunction in scholarly literature (rural vs. urban, coastal vs. inland), public health scholar Probst and colleagues (201919) coined the term “structural urbanism” to call attention to the fact that public health research often focuses on urban areas. They argue that health care solutions created in and for urban contexts translate poorly to rural health contexts because of the specific realities of rural America. This is a problem particularly for the 45 million rural dwellers in the United States who could benefit from research focused on rural realities, in public health and disaster studies alike.

Tools for knowing floods in rural inland areas must be relevant and legible to the communities they aim to help. We designed our community-based participatory research with attention to distinctions between studies of rural and urban problems, resources, and mitigation strategies. We collaborated with community organizers and municipal officials to develop a research project that addressed gaps around formal and informal responses to disaster events. This approach provided us with the conditions to examine the function, strength, and implications of relations between individuals, communities, policymakers, and professional recovery activities in rural climate disasters.
Participatory Mapping With Impacted Communities
We used participatory mapping to address gaps in traditional models for understanding flood impacts. As a collective form of reflection and creation, participatory mapping is also an effective way to preserve memories about the flood through narratives, images, videos, and other shared practices. Participatory mapping has been used in a wide array of flood-related studies, from assessing flood damage (Dashti et al., 201420) and confirming inundation levels (Assumpção et al., 201821) to informing the development of flood models (Gebremedhin et al., 2020). In such processes, scholars and residents share knowledge—observational, experiential, archival, and intergenerational. This knowledge sharing from multiple perspectives improves clarity about local resources, practices, and mitigation options (Garde-Hansen et al., 201622), addressing a gap in bidirectional knowledge sharing. Understanding the importance of multiple perspectives, researchers have used participatory mapping to gain insights into risks related to flood inundation levels that could not be obtained otherwise (de Andrade & Szlafsztein, 201523; Brandt et al., 202024; Kienberger, 201425).
Conducting in-depth participatory mapping with under-resourced communities can facilitate more nuanced relationships with the environment (Jahre & Schmiz, 202326) and also help to understand existing local nuanced relationships with the environment (Kelly, 202127). We build on this approach to participatory mapping by working with participants as community scientists involved in making meaningful knowledge while also acknowledging the traumatic impact flooding has had on some of their lives. McEwen et al. (201628) offer a potent example of how to work with knowledge sharing informed by the reality of trauma when they introduce the idea of sustainable flood memories. Working in a framework they call “sustainable flood memories,” participants can synthesize memories surrounding the flood, combining firsthand accounts about changes in the landscape, hydrological data about flood extent, personal anecdotes, and similar historical events (McEwen et al., 2016, p. 386).
In our field study, participants frequently referenced 2011’s Tropical Storm Irene as a touchpoint memory that helped them contextualize their experience in 2023. Memories of where flooding occurred during Irene helped some residents prepare their homes and mitigate damage during the 2023 flood. Our project has archived these memories through community mapping and interviewing, sharing results as appropriate with residents and town officials. In this way, local knowledge produced by community scientists—that is, people making direct observations and developing questions for further research during and after the flood event—can better inform decision-making and response protocols, generating new strategies and building capacity (Hunter et al., 202329).
Research Questions
Our research was guided by the following questions:
- How might social scientists and engineers best collaborate with community groups, activists, and response/recovery professionals to create new knowledge about and mitigation of future inland flooding events?
- What communication strategies can make this knowledge available and accessible for multiple audiences as events increase in frequency and intensity?
Research Design
Our research engaged two groups: (a) residents who were impacted by flooding and/or involved in response; and (b) town and state officials who had formal roles in the response operations. We used a mixed-methods approach that included the following data collection methods:
- Community-based participatory research and ethnographic participant observation
- Participatory mapping with residents about their flood experience stories on paper and integrating ArcGIS
- “Culvert Crawlers:” Community science mapping of hazardous culverts, ditches, and drains
- Interviews
We describe each of these data collection methods in detail below. We chose this mixed-methods approach to ensure data came from a variety of perspectives and lived experiences and could ideally help uplift members of the most vulnerable populations in the area. The project’s methods emerged from community-identified needs in our conversations across the disciplines of anthropology, geography, engineering, and emergency management, and with community partner organizations.
Our research was informed by a problem-oriented ethnography (Carpenter-Song, 202330), which is an anthropological method using the problem or issue identified by a community or individual—in this case, floods and response—as the starting place for developing questions and ways of asking them. As such, our primary methodological focus was on remaining flexible to community partner needs while tracing those needs as they shifted and were re-articulated over time. For example, our initial plan to conduct a series of iterative participatory mapping meetings evolved after the first meeting where we received feedback from community partners that we should consider a different and more varied approach, which we document below.
Study Site and Access
We chose the Black River Valley in Vermont as the study site for two main reasons. First, Principal Investigator (PI) Boke has a direct connection to this area, as Boke lives in the watershed and was involved in mutual aid response in the towns of Cavendish and Ludlow after the 2023 floods. Second, the economic and social conditions of these two towns provided an excellent opportunity to better understand the reciprocal impact of tourism-based economies on response, recovery, and mitigation and vice versa, primarily through a close look at the way primary and secondary homeowners’ experiences aligned, differed, and informed each other.
Vermont’s politics and social relations are characterized by an ethos of local control over many decisions, and some community members view the intervention of state government with suspicion. An emphasis on localized governance traces to European settlers’ small-scale, town-meeting-based decision-making by property-owning white men, though after Universal Suffrage and the Civil Rights Movement in the 20th century, other people also participated in local-control governance (Leslie, 201831). A plethora of regional organizations, state regulations, and federal law shape municipal-regulatory decisions on management of land, water, and human community, on preparation for and response to flooding, and on deployment of aid. For instance, the newly implemented statewide River Corridor Management system creates a layer of policy, practice, and relation with land and floodplain use (Vermont Department of Environmental Conservation, n.d.32). The River Corridor Management system is one of many overlapping efforts at regionalizing planning, decisions, and impacts, and relates to the fact that Vermont has no county-level governance—a fact which plagues the federal aid process facilitated by FEMA, which is accustomed to working with county-level governments. Research on organizational activity at the scale of the watershed, as in this project, reflects the tension between local control, minimal county-level management structures, and the specter of state intervention resented or resisted by some community members, and embraced by others.
Community-Based Participatory Research and Ethnographic Participant Observation
We chose an approach to ethnographic participant observation that incorporated several specific approaches. First, we relied on methods from the community-based participatory research tradition which orient the research design to address community needs (Austin, 201033; Kelly, 2021). Second, we engaged in anthropological approaches to long-term relationship building in communities. And third, we attended and observed forums planned by others.
This community-based participatory research (CBPR) project is informed by PI Boke’s work with local mutual aid groups in the aftermath of the 2023 floods, and the project foregrounds mutual aid as both theory and practice. PIs Boke and Kelly discussed and identified a need for research on communication during and after flooding events and designed this interdisciplinary research project to meet that need. PI Boke’s existing connections with mutual aid volunteers grew into community research partnerships.
The project is also informed by PI Kelly’s (2021) long-term work with Mapuche-Williche communities in Chile using participatory mapping and CBPR. CBPR is an established approach to scholarly research that puts the needs and questions of the community first (Austin, 2010; Kelly, 2021). In our CBPR approach, interested members of local community participants provide iterative feedback on any products (e.g., maps, papers, news media, teaching resources) as they are refined. Through those partnerships we conducted iterative snowball sampling to recruit participants. PIs Boke, Kelly, and Spang also maintained regular presence at community events—such as the Ludlow Farmers Market, the Cavendish Tag Sale, and other community meetings. In addition to active mapping at those events, they were also key sites to recruit potential interviewees.
At the invitation of community partners after three months of research, we began attending regular meetings of the Ludlow Area Long Term Recovery Group (LTRG) in July 2024. This LTRG includes members from several neighboring towns, including Mt. Holly, Cavendish, Ludlow, and Plymouth. We attended as community-based participatory scholars conducting ethnographic research and also contributing to the mitigation efforts of the LTRG. At the end of the 2024 field period for this Natural Hazards Center award, we attended five such meetings and maintained communication with the group’s members about their work and priorities via email, phone, and text message. Additionally, PI Kelly has attended one community lunch in Ludlow, hosted by the Black River Valley Resources organization, and one select board meeting in the town of Cavendish.
Participatory Mapping With Residents About Their Flood Experiences
Participatory mapping of resident stories was used as another method for data collection for two primary reasons: (a) the process of mapping with community members generated conversations and revealed insights about the floods that would otherwise go unreported, and (b) mapping created a database of spatial information, memories, stories, shared images, and other qualitative data that could be preserved and used to inform future floods. To effectively carry out this method the team decided to use a system of printed maps and stickers for residents to mark important locations. This method was used at five different events: one planned community workshop dedicated to mapping, and four existing community events at which the team set up a table.
Workshop
We held a workshop using this community mapping method on June 28, 2024, at the Ludlow Community Recreation Center. We invited participation through advertising on local physical bulletin boards, press releases to local newspapers and topical email lists, updates on relevant Facebook pages, and through word-of-mouth.
In deciding an area to depict on base maps for the community participatory mapping workshop in Ludlow, we narrowed down the large region of the Black River watershed to include only the towns of Cavendish and Ludlow. We used a simple base map with labels for place names and topographic features indicated by hillshade (a spatial analysis technique that uses shaded relief to depict elevation) and contour lines. PI Spang created and printed 42 in. by 36 in. paper maps of these predetermined areas. The team identified key themes we hoped to map, including flood damage, erosion, obstructed roads or bridges, hubs of resources for recovery, and other critical infrastructure. In this process, we intentionally broadened the definition of critical infrastructure to consider specific context and elements identified by local people such that a local store that becomes a hub for distributing resources and coordinating volunteers, in this frame, becomes critical infrastructure. In this, we follow insights from Indigenous studies literature in Canada on the need to have culturally relevant ways to define critical infrastructure outside of official state designations (Spice, 201834).
On arrival at the meeting site, the team distributed maps, stickers, note paper, pens, pencils, and markers on tables around the room prior to participant arrival. We arranged spaces for our childcare providers and dinner, both of which were provided to make the meeting as accessible as possible. Research Assistants Sullivan and Valenciano Coronado used pre-established workshop procedures (documented in Appendix A ) to greet participants as they entered and ensure they understood that they were arriving at a research event. Sullivan and Valenciano Coronado also facilitated sign-ins and handed out IRB-approved information sheets. These described the project and provided PI contact information. The PIs counted and retained contact information for all participants in a way that de-identified the information they shared during the workshop. Participants included 15 residents from towns in the Black River Watershed and two officials from state and local government. Two participants left the meeting early in this process because their town was not represented on the team’s base maps.
PIs Boke and Kelly opened the meeting with an overview of the research project, consent information, and time for questions. PI Kelly then proceeded with a more detailed explanation and orientation to the activities for the session. To begin the activities, we asked participants to collectively decide what theme each sticker color would correspond to, rather than predetermining a theme-color relationship. We also asked participants to number each sticker sequentially as they applied them. Teams of 2-5 people then sat at each table and placed colored round stickers on the map at locations where they had, or saw, a flood experience and discussed that experience with others at the table.
While participants went through the process of mapping, research team members (PIs, undergraduate research assistants, and affiliated researchers) would sit with them and capture detailed field notes about flood experiences. One of the people at the table, either the participants or researchers, would write down the number and explanations about what happened at that associated location on a printed legend made up of a two-column table. This conversation also enabled community members to discuss their concerns and observations directly with government officials who were present, including a state senator representing the county and a watershed coordinator from the Department of Environmental Conservation.
After the exercise, the remaining participants gathered to listen to each group present their maps, memories, and representational process. This group discussion of the mapping process helped to identify what information about flooding was important to participants while the research team took notes. The resulting paper maps and corresponding legends and notes were collected and are maintained in a secure drive with de-identified participant contact information.
Community Event Procedures
We used the same process when participating at four local events in Mt. Holly, Ludlow, and Cavendish during June and July 2024. At these events, we captured stories about the flood response and recovery with additional maps of areas beyond Ludlow and Cavendish town boundaries. We placed base maps in a stack on a table and provided stickers, pens, and legends for participants to annotate locations of flood experiencesEndnote 1, allowing participants to flip through the map stack and find the one that showed places most relevant to their stories. Team members conversed with participants, took detailed field notes of their flood experiences, and collected contact information for participants interested in future interviews.
At the Mt. Holly Energy Fair, 12 residents stopped at the table to talk about their flood experiences and draw points on the map to visualize locations where these events had occurred. At the Ludlow Farmers’ Market and the Community Luncheon, twenty-two residents participated in this event and contributed 45 different data points. At the Cavendish Tag Sale, the research team interacted with approximately 15 people. While only five points were mapped, the mapping method elicited in-depth conversations with public works employees and residents with extensive knowledge of stormwater and road infrastructure maintenance.
Data Analysis and Visualization
Over the course of these five events, we heard flood experiences from 66 residents and collected 10 paper maps with annotations, as shown in Table 1 below. The annotated paper maps were scanned and digitized, generating 320 points of spatial data.
Table 1. Data Collected From Participatory and Community Mapping Events
| Mount Holly Energy Fair | ||||
| Ludlow Commnunity Center Workshop | ||||
| Ludlow Farmer's Market | ||||
| Cavendish Tag Sale | ||||
| Total |
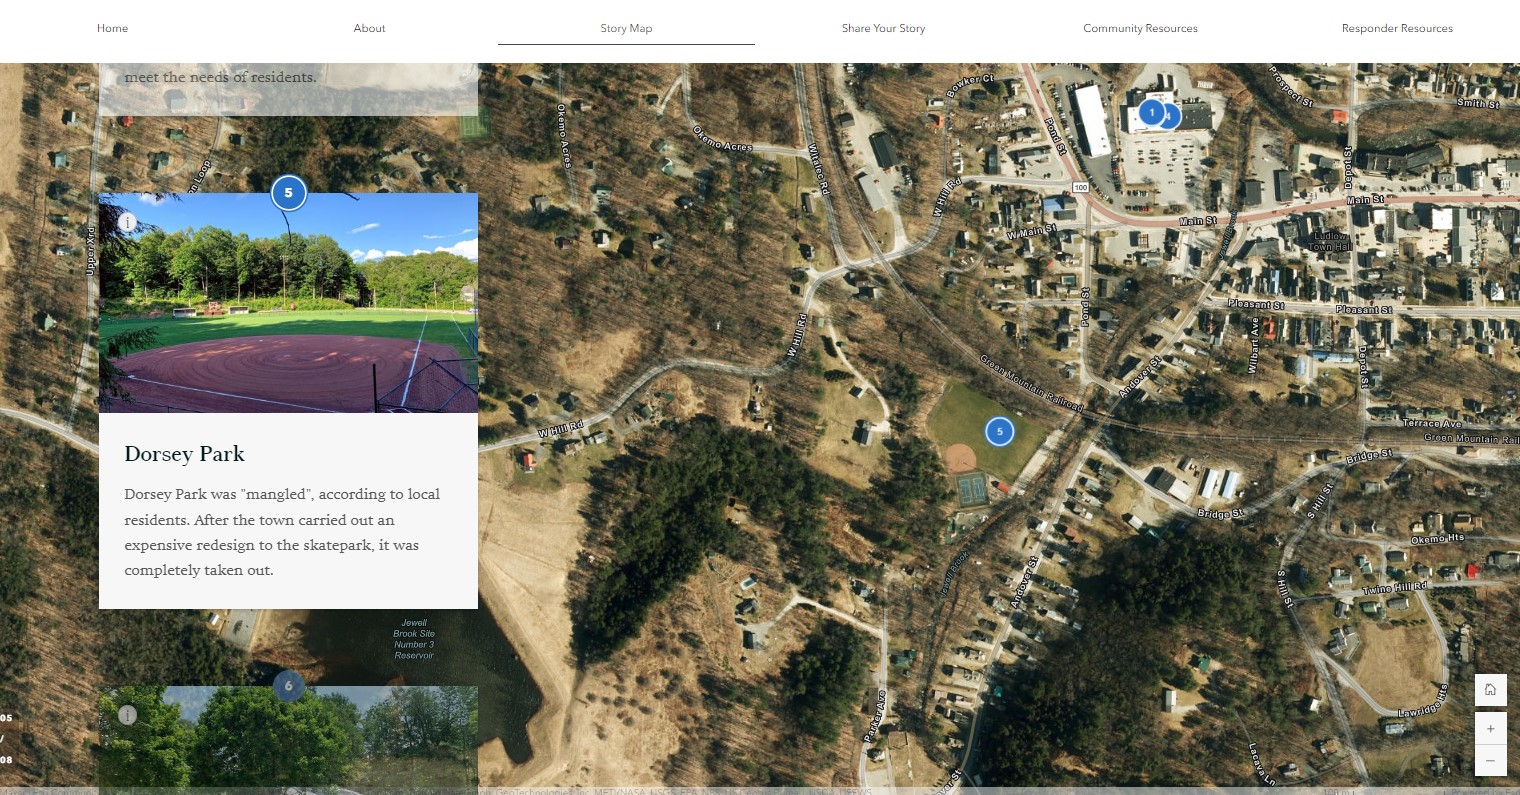
The annotated paper maps were scanned, digitized, and edited to include narratives and themes. We used this qualitative coding to analyze this dataset, classifying each point into associated themes. The resulting data layer was published to ArcGIS Online, where we used it to create an interactive web map, which has been reviewed by the research team for legibility and ease of access. PIs Spang and Kelly are experimenting with data visualization, creating an ArcGIS StoryMap and artistic renderings of the maps so that the data can be shared with the community in a way that is easy to interpret. Figure 1 shows a screenshot of the ArcGIS StoryMap that we created to share community stories of flooding at locations as indicated on a map.
Figure 1. ArcGIS StoryMap Created With Data From Community Stories
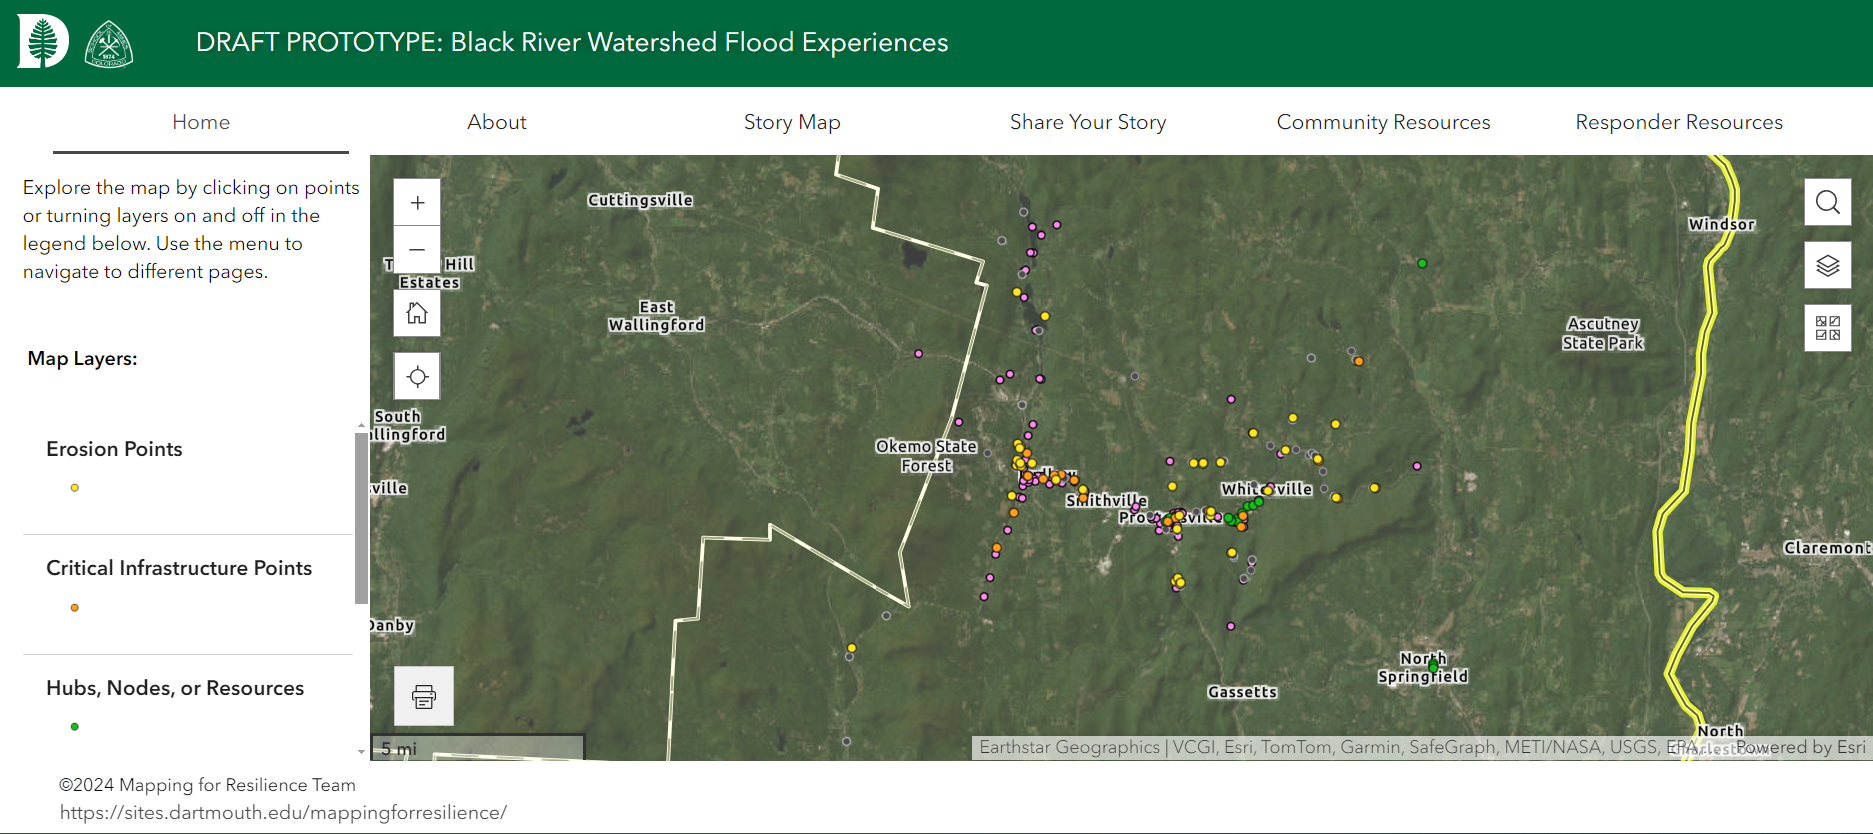
The research team created a prototype mapping tool using ArcGIS Experience Builder (1.18.0) , which hosts the web map, StoryMap, and other resources as a website to be made public in late 2025 . Figure 2 shows the draft homepage of the tool, which displays locations of flood stories collected through the community mapping process. The tool will be shared with the impacted communities for feedback and iterative editing. We will determine where the tool will ultimately be hosted with community input.
Figure 2. Early Prototype of Mapping Tool in ArcGIS Experience Builder
“Culvert Crawlers:” Developing a Phone App Prototype for Community Science Mapping of Culverts, Ditches, and Drains
Stormwater infrastructure like culverts and ditches are sites of concern for the towns of Cavendish and Ludlow. Conversations between PI Kelly, PI Boke, and representatives from two local partners, Kelly Stettner from the Black River Action Team (BRAT) and Margo Caulfield from Cavendish Connects, revealed the need for an accessible method that community members could use to locate and monitor hazardous culverts, ditches, and drains and report any changes in their conditions over time. The team including PI Spang collaborated to design an accessible, accurate tool for community science monitoring. These activities occurred in parallel with the community meetings, events, and interviews described above, and have been publicized through outreach materials, which include flyers, web-based newsletters, and video tutorials (see Appendix B for examples of our outreach materials).
Culverts are tubes of metal or plastic that are buried under roadways to enable the movement of water from one side of the road to another. Culverts are often used to provide passage of small streams under roadways and sometimes used to channel runoff from roadside ditches downhill to minimize erosion. Since they’re part of the movement of water which moves debris, culverts can become blocked with vegetation, sediment, or trash and cause flooding, erosion, and unexpected inundation. Flooding and erosion caused by blocked culverts is a common occurrence in this region (Dawes et al., 202535).
In conversation with our partners, we decided that a phone-based mapping application (or “app”) that residents could download onto their phones would be ideal for this purpose. But before we could design an app, we needed a prototype, which we made one of our research tasks for this project. Out of this research task, we generated the Culvert Crawlers program as a community science effort under the collaborative guidance of BRAT, Cavendish Connects, and ourselves at Dartmouth College. This approach aligns with the participatory stormwater research of Hendricks et al. (201836), who used Survey 123. We expanded the project in coordination with local town officials and road crews. In March 2024, one local town manager described the need for attention to stormwater infrastructure as follows:
With the ditches and culverts, people don't realize how vital they are. You drive by ‘em every day. You don't realize how vital they are until they don't work in these towns, especially. And I’ve dealt with it. People love—and we all do, we love our back roads. Love ‘em. When you get in there and you start ditching and you got to pull it out, people get pissed [because it is bare dirt]. So, we try to hydroseed it [to grow grass quickly and make it look nicer], but it’s gotta happen.
Developing the app prototype involved several phases. First, PI Kelly collaborated with students in her spring 2024 Energy Justice course to design a simple inspection survey for stormwater infrastructure using ArcGIS Survey 123, a smartphone data collection app that interfaces with Esri’s mapping capabilities and can be used by residents as a community-friendly monitoring tool (Kingsbury et al., 202137; Adams, 202238). By the end of the class, students created an app to map stormwater infrastructure and record its conditions based on input from community partners on what information would be most helpful, such as the level of erosion in the road above a culvert, or whether there was debris blocking the flow of water.
In the next phase of the project, during summer 2024, we used the Survey 123 app as a site survey tool to capture information about the current condition and location of culverts, drains, and ditches on key roads identified as particular gaps in knowledge about culvert condition by town road crew managers in Cavendish, Ludlow, and Hartford. PI Kelly tested the app prototype with Community Resilience Fellows in the Energy Justice Clinic (EJC) that she leads.Endnote 2 PIs Kelly and Spang and these summer fellows completed site surveys of 250 culverts in Cavendish. Results were automatically stored as a feature layer in the ArcGIS Online database. All collected data was verified and reported to community partners.
PI Boke continued this method, leading 24 students in her Anthropology of Disaster course alongside and community members to conducting surveys of culverts on key roads in Ludlow and Cavendish in Fall 2024 and Summer 2025 as part of Culvert Crawlers, in collaboration with the town of Ludlow and community partners Kelly Stettner, Melissa Rockhill and Margo Caulfield. PI Kelly continued surveys in Hartford with Boke’s students in fall 2024, as well as with undergraduate thesis student Kalyn Dawes, other students, and community members in Hartford on the White River in Fall, Spring, and Summer 2025. At the time of writing, a total of 407 surveys has been entered in the app platform; data collection is ongoing.
After completing initial surveys via the Survey 123 app in spring and summer of 2024, we verified the accuracy of the results using two steps. First, our team used handheld GPS units to confirm the locational accuracy of the stormwater infrastructure mapped by the app, which were determined to be within an average range of 4 meters. Next, our partner at Ludlow Area LTRG, Melissa Rockhill, cross-referenced the data generated by the app with extant state culvert databases. Both verification processes confirmed the app was accurately capturing locational data. Findings were presented to the Town of Cavendish Selectboard in November 2024. The team is currently working with support from the Natural Hazards Center Weather Ready Research-to-Operations award and Dartmouth’s Neukom Institute Faculty grant to make this method accessible to community members to participate in community science through gathering data.
Interviews
At the time this report was prepared in October 2024, we have conducted 12 interviews with local officials, residents directly impacted by flooding, and representatives of regional or state organizations. Additional interviews are being scheduled on an ongoing basis. These interviews have helped us understand legal, political, and social debates about what is needed in flood recovery response and communications.
Sampling Strategy
We used purposive sampling for our initial interview sample, identifying key local, regional, and state actors for our study area and topic. We then used snowball sampling, asking our initial interviewees to recommend other potential participants. We also used opportunistic sampling based on our participatory mapping meetings, where we offered impacted people an opportunity for a longer conversation.
Participant Consent and Interview Guides
During interview scheduling, the PI or other interviewer shared the IRB information sheet, as well as details about what to expect in the interview and a request for permission to record the interview in audio or audiovisual Zoom format. Interviewees had at least three days to review the consent materials before the interview. During the interviews, the interviewer shared a hard copy (if in person) of the informational and consent materials and reviewed it with the interviewee, restating the request to record the interview and asking for verbal consent to proceed.
The research team developed two interview guides (see Appendix C). The first guide was intended for people who did not hold formal, paid roles in local or state government at the time of the flooding. The second guide was intended for officials or employees in state or local government (e.g., municipal managers or other town employees). Both guides included questions asking the interviewee to reflect on their experiences during the flood; what activities they engaged in during response and recovery; how they accessed information during the periods of active hazard and recovery; and anything else they wanted to reflect on. Additionally, the second guide included questions asking officials to speak about which tools they used to plan for, respond to, alert residents about, and recover from the flood, as well as how they viewed the relationship between government roles at different levels, including town, state, and federal.
Data Analysis
PI Boke and Research Assistant Holly Sullivan used an inductive coding approach to analyze interview transcripts. This approach to developing codes is called thematic analysis (Braun & Clarke, 200639). Thematic analysis “is a method for systematically identifying, organizing, and offering insight into patterns of meaning (themes) across a dataset… identifying what is common to the way a topic is talked or written about and of making sense of those commonalities” (Clark & Braun, 2021, p. 5740). It entails (a) ensuring researcher familiarity with the immediate context of the interview and interviewee itself; (b) researcher familiarity with the broader context of the focus of the interview, in this case, this specific inundation event; and (c) close and careful repeated readings by several researchers to identify emergent themes in and across interviews. From these themes, researchers inductively develop codes (a narrower set of groupings) that are centrally important to the research questions—and those that we did not know would be important, but that have emerged in the research. These codes help us categorize different statements by interviewees and analyze them together.
Ethical Considerations and Researcher Positionality
Our team approaches research with an understanding that the most meaningful work involves long-term commitment to a community. One PI was raised in the study area; as a rural, white, middle-class person working with rural, predominantly white people of many socioeconomic backgrounds, her connections and cultural familiarity have eased the process of communication, planning, and locally appropriate engagement. One PI was raised in nearby New Hampshire and has similar experience in rural areas. One PI was raised in a white, middle-class family in a New England city and grew up visiting family in nearby New Hampshire, so has familiarity with and connections to the region, as well as experience working with rural communities in Colorado. Our nuanced understanding of rural, white cultural practices and political dynamics meant that we were well equipped to begin and commit to longer term work in these places.
This project was initially approved for human subjects research by Dartmouth College’s Committee for the Protection of Human Subjects on March 1, 2024 (STUDY00032839) with updates approved on September 23, 2024. In addition to adhering to all legal requirements for ethical human subjects research, our research design is grounded in trauma-informed research and researcher sensitivity to the emotional and social burden of disaster-related losses. Our consent practices include the choice for participants to be named, should they wish. In dissemination we invite community input on final written or reported products.
Findings
Scientific Collaboration With Community Partners
Research question one asked: How might social scientists and engineers best collaborate with community groups, activists, and hazards professionals to advance inland flooding research and mitigation practice? We found that scientific collaboration with community groups, activists, and professionals is most effective when conducted in person. Specifically, some community partners preferred to invite us to join their existing meetings rather than scheduling new ones. In addition, we found that sharing our research materials (i.e., maps, interview templates, and water quality kits) at the meetings allowed for more hands-on conversations on how scientific disciplines, local knowledge, and community needs come together.
Our in-person, collaborative approach allowed us to show how we valued diverse forms of knowledge on flooding recovery, response, and mitigation outside of formal professional expertise. We brought together impacted and concerned residents and local elected government representatives at our research events and meetings, providing opportunities for government agencies to learn about community needs in ways that technical reports do not.
We found that there is a significant need for such data gathering and analysis in small rural communities, which is due, in part, to the small size of municipal staffs and the tendency for municipal workers to hold multiple responsibilities, as well as to larger socioeconomic forces shaping service-work based economics and tax base. For example, we learned in a March 2024 interview that local municipal officials and road crew did additional overtime work during the active rainstorm to manually monitor dam sites of concern that lack digital monitors, putting their own lives at risk. Pointing at labeled dam sites on a 3 ft by 5 ft paper map of the town tacked alongside other maps on his office wall, one official said of these sites:
So, all of these are dangerous, or the ones is that this is a West Hill site. One site three. Those are the big ones that if they go, that's going to be a problem because this essentially is going to go right down here [pointing at the road running along the river]. Same thing here [pointing at another location in the same steep valley]. They've estimated that if these (dams) were to fail, you'd have an 8 ft wall of water. A lot of them would go straight down.
In an October 2024 interview, this official shared details about the cost, timeline, and process for installation of dam sensor equipment to enable early warning that does not rely on individuals driving in dangerous conditions:
We had, you know, we had major spillway damage to three of our dams. So, the auxiliary spillways, they were activated, and there was a ton of like major, major scouring that happened when it went over so that had to be repaired.
The sensor should be installed, I would think, within the next month… And actually, work on that's beginning next week. So, we—this project was a hundred percent funded by the USDA Engineering. And it, you know, it's a $700,000 project. But you know, on the flip side, here we are thanking—thank goodness, you know. The damage to the spillways was very significant, but it did nothing to jeopardize the structure of the dam. So, we weren’t gonna have a breach or anything. Thank goodness, because, you know, here we are. Thankfully, we got the funding. Because one, I don't know where we’d get a million dollars to fix it, but it also took over a year to get everything in place to do it.
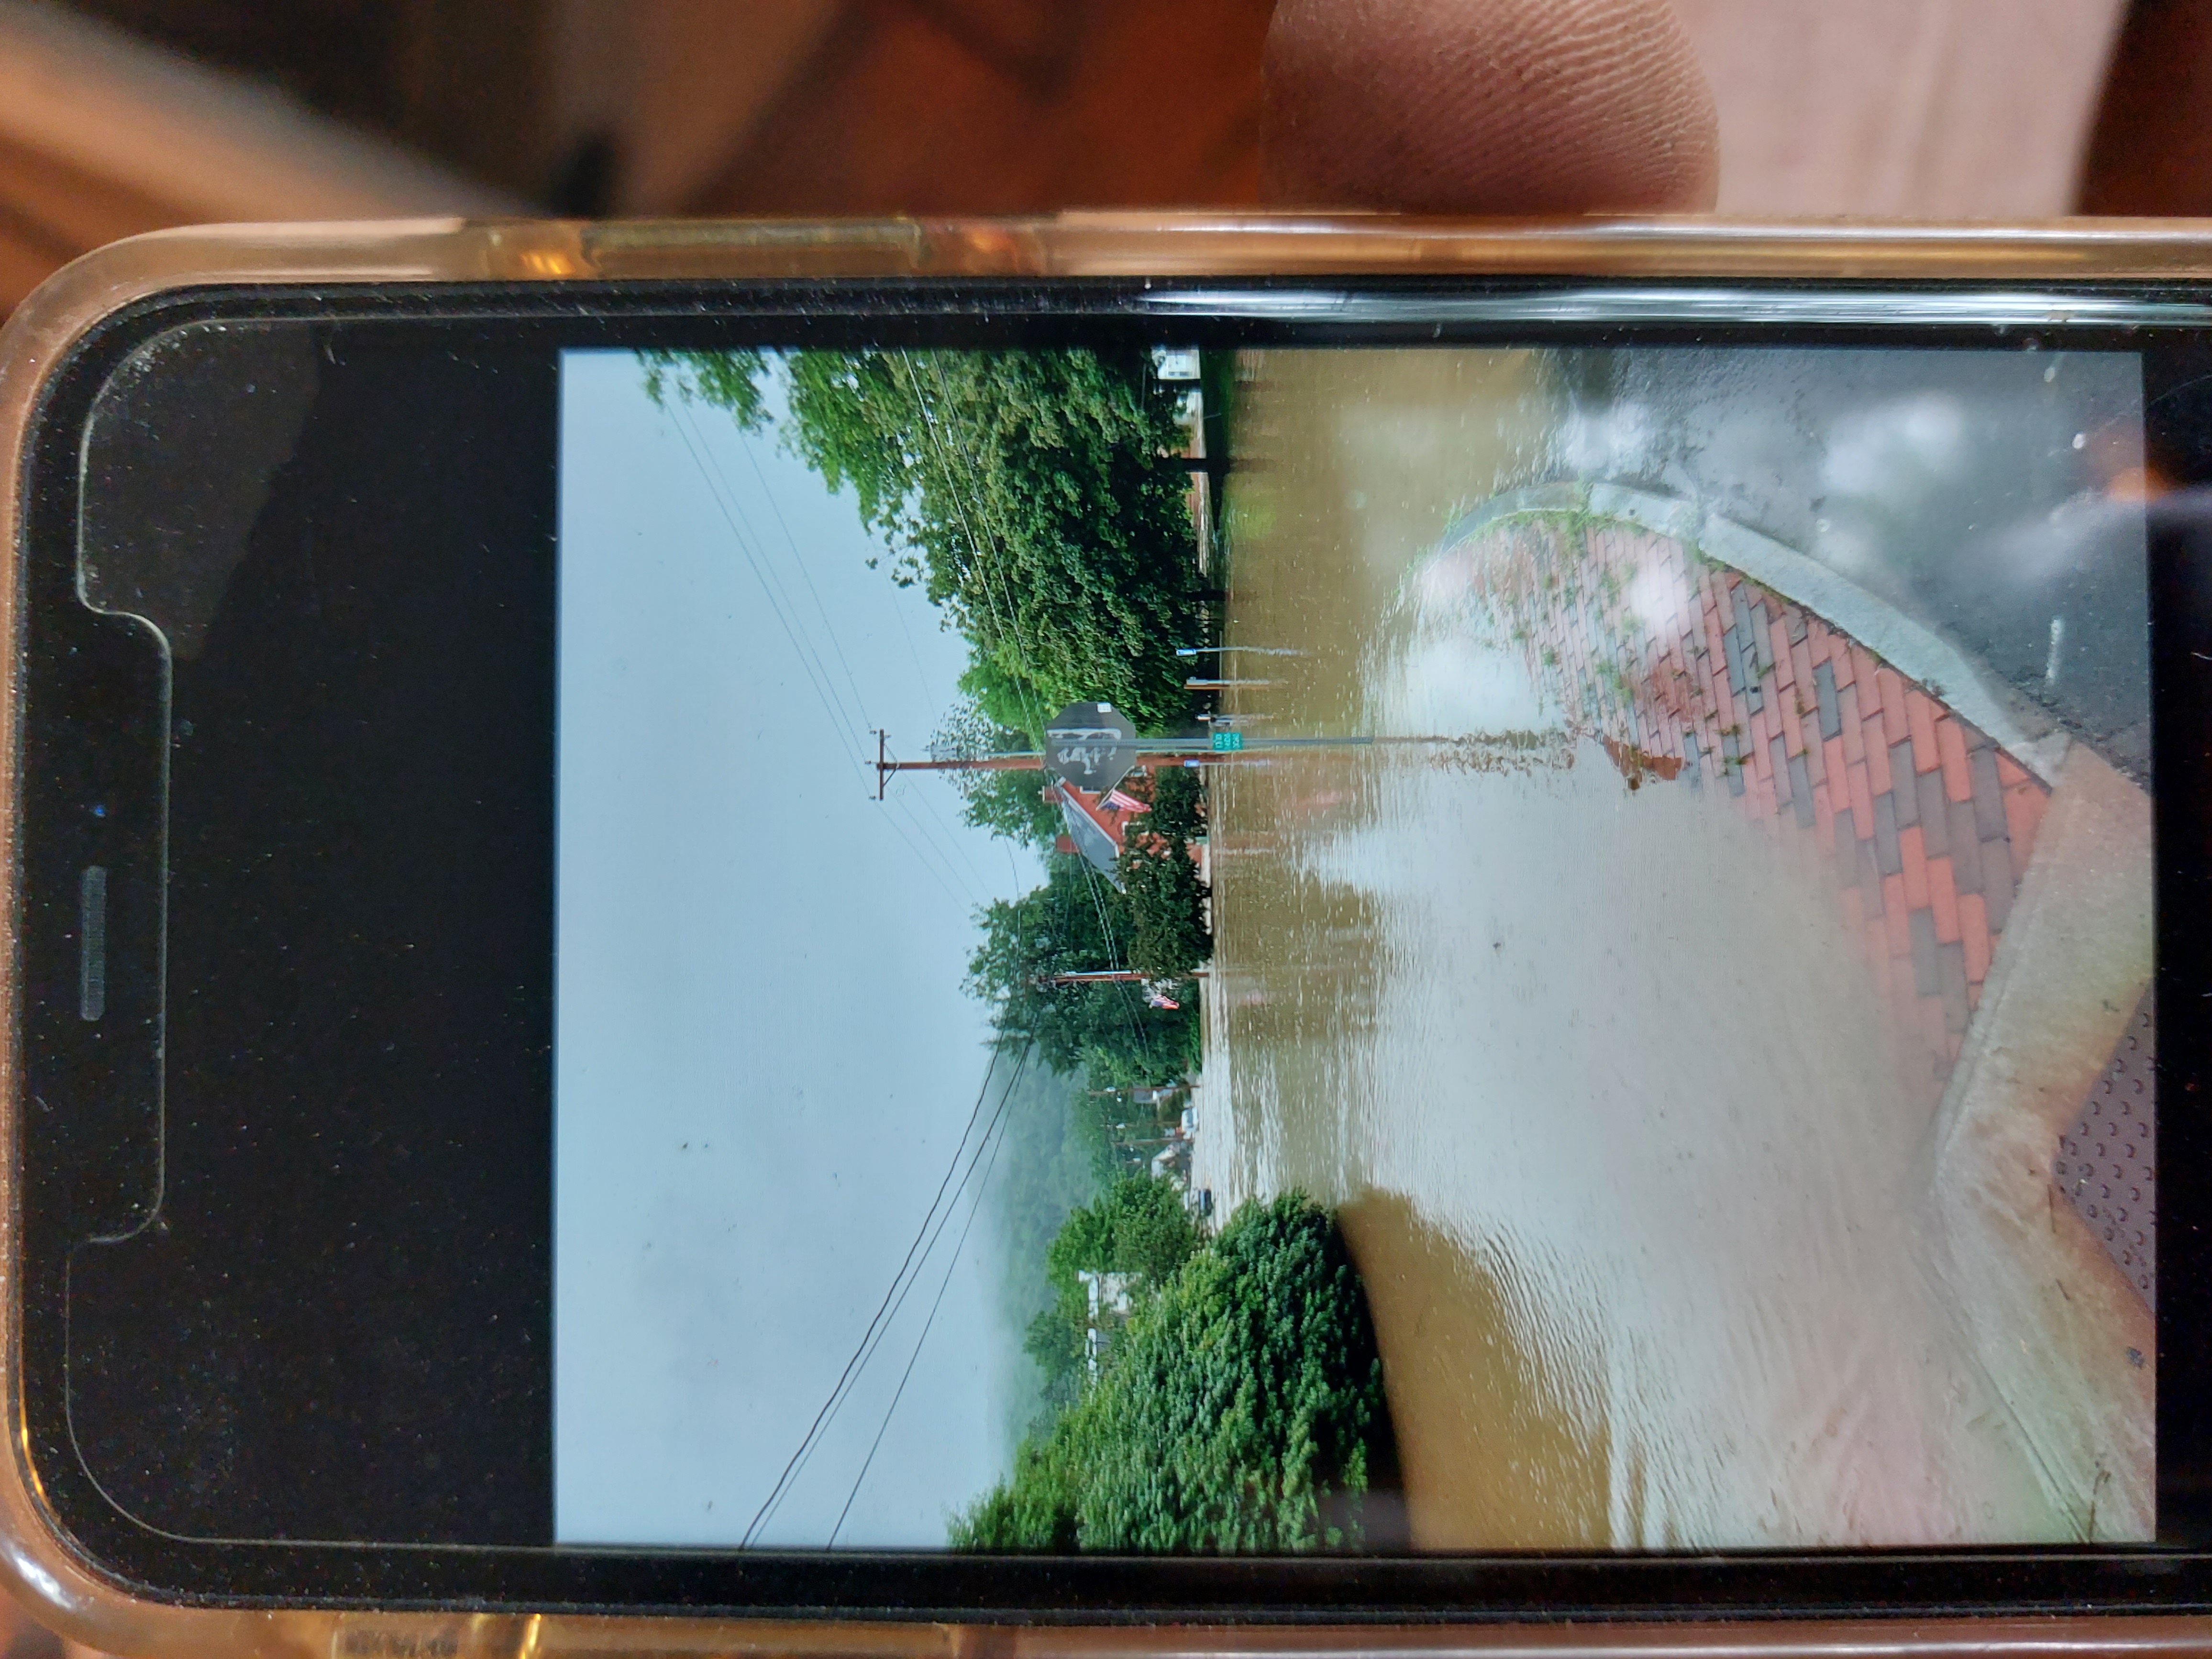 A person shares a photograph on their phone which depicts the Black River jumping its banks and flooding the town of Proctorsville, Vermont, on July 10, 2023. Photo credit: Charis Boke, 2023.
And you know, we’re still… we've got actually the funding paid for in finance for the engineering because they have to—I think we talked about how they have to rehab all of those dams? Five of them. That's a $40 million project! The engineering phase is going on right now, which is, I think it's $3.2 million for that. Thankfully that's funded. But we're trying. You know. We're on the hook for $11 million to fund [this rehab]. And we have to, because if one of those dams goes, probably it’s “see ya, Ludlow”.
Having this greater insight into the impact of lack of digital monitoring capacities of the town’s infrastructure managers means our team can sharpen research attention on questions of monitoring, knowledge sharing, and warning.
Our events and meetings combined insights from professionals in disaster management; municipal managers dealing with dam sensors; residents whose basements were flooded; people who hosted shelters (formal or informal) and fed displaced individuals. Residents shared with government officials the strains that they experienced after having their home flooded as well as the practical knowledge they had gained from the experience, including about making decisions on which part of their house to repair first; who to ask for financial assistance; and how to navigate multiple overlapping jurisdictions and funding mechanisms. A municipal official described the impending political challenge of raising money through a bond vote to relocate town infrastructure that had been damaged.
At another table during the community mapping session, a participant who had helped run a local informal shelter and soup kitchen for volunteers remarked, “How much detail on damage do you want here? I could keep going.” She gestured at the already dense array of multicolored dots meticulously placed by the group to represent flooding impacts, resources, and infrastructure in the village center of Proctorsville. A researcher said, “however much detail you want to give is fine.” She turned back to her tablemates and continued placing colored dots in a dense cluster around parts of the Proctorsville green. As she did this, she talked about how the size of the dots and scale of the map meant she couldn’t show all the stories about a particular place on the map, as there were multiple types and timings of damage to represent.
This moment demonstrates to us that the lived experiences held by people directly involved in response often exceed the capacity of any one research method to document them. Collaboration across disciplines and among multiple types of expertise is necessary for effective documentation, which is in turn necessary for effective mitigation.
At the end of the community workshop, all participants and researchers gathered to hear from each group about their map and the information represented on it. Attending state officials and political representatives expressed gratitude to the group for the insight into hyperlocal needs that they were able to access during the meeting. At least one community member, in response, critiqued the Department of Environmental Conservation’s communication and resource practices, and for a few minutes there was a palpable tension in the room as community members shared their frustrations, directed at state officials present. Some impacted residents expressed their needs for faster disaster response and more effective communication. Other residents expressed a sense of self-sufficiency and pushed back on the idea that state and federal funding was necessary for disaster recovery. These moments demonstrate the diverse array of needs, capacities, and approaches represented even in communities with a low population density.
These are some of the insights from local observers that help us co-generate scientific data about flooding aftermath. Collaborating with community partners also expanded our vision of what a community science phone app should monitor and map, as we collaborated to design the Culvert Crawlers monitoring program and app. Input from an environmental organization working in the Black River watershed revealed to us the ways that natural infrastructure—such as pitched hills, weedy areas, stands of shrub willow, and quality soils—can mitigate flooding. We found it was necessary to shift our initial mapping frame from focusing solely on stormwater infrastructure in the Survey 123 map and in the community mapping definition of “critical infrastructure” to include “natural infrastructure.” In future research, we will build on the observation that green infrastructure is another critical form of flooding protection to expand the categories of information we collect.
We found that there were major concerns among impacted people about different local, state, and federal timeframes for response, recovery, and mitigation activities, which impacted their willingness and ability to engage with federal- and state-led efforts. That is to say that the urgency of crisis felt by residents was not reflected, they say, in their experience of state response (a common observation across disaster studies literature). However, participants also described a local response rich with resource hubs, active support, volunteers for digging mud out of houses, and sandwich-makers from several towns away who contributed by nourishing volunteer laborers during the initial acute response time. This observation by community scientists about different senses of urgency and different capacities to respond shaped our subsequent successful application for National Science Foundation (NSF) funding.
Lived experiences of risk and vulnerability emerged alongside lived experiences of emergent aid, solidarity, collaboration, and unexpected benefits. For instance, in a story our team coded as related to “resources,” “risks” and “communication,” (three of our key codes) one participant shared a story about an older couple with concern. The couple left their house in Cavendish during the rainstorm and active flooding because they were worried that others would put themselves at risk trying to check on them. Upon leaving, they found themselves walking dangerously in floodwater up to their waists. They made their way to the shelter at the local church soaking wet. The participant said that if that couple had better information about how to decide when to shelter in place, and better communication with local shelter personnel, they may have been able to make a safer choice. This observation about a specific information access gap has shaped our co-design of community outreach materials on evacuation and sheltering-in-place. It also demonstrates that “resources” and “risks” are not mutually exclusive in terms of how people experience them on the ground – the shelter-as-resource, and the understanding that people would come look for them, shaped the couple’s decision to leave their home.
In terms of local resources, we also documented that although social networks are robust in some areas, they are thin or lacking in others. This led to pockets of active collaboration and mutual aid work in the immediate aftermath of the inundation, and areas where such collaboration was less present. We found that year-round residents were more likely to be included in networks of collaboration and aid. Part-time residents—such as those who own a second home in the area—potentially had more economic resources, but they did not always have the social capital or local knowledge to navigate flood events as easily as year-round residents. Restrictions on non-primary homeowners’ access to state and federal sources of disaster relief aid meant that part-time residents spent astronomical sums repairing or rebuilding damaged property (Federal Emergency Management Agency, 202541). A financially stable or wealthy second-home owner may seem to have more resources than a part-time worker in the tourism industry who is renting their apartment. However, both individuals are vulnerable, even if the type and the impact of their vulnerability are different.
Community Participatory Mapping: Toward Empowering Residents to Understand and Mitigate Flood Risk
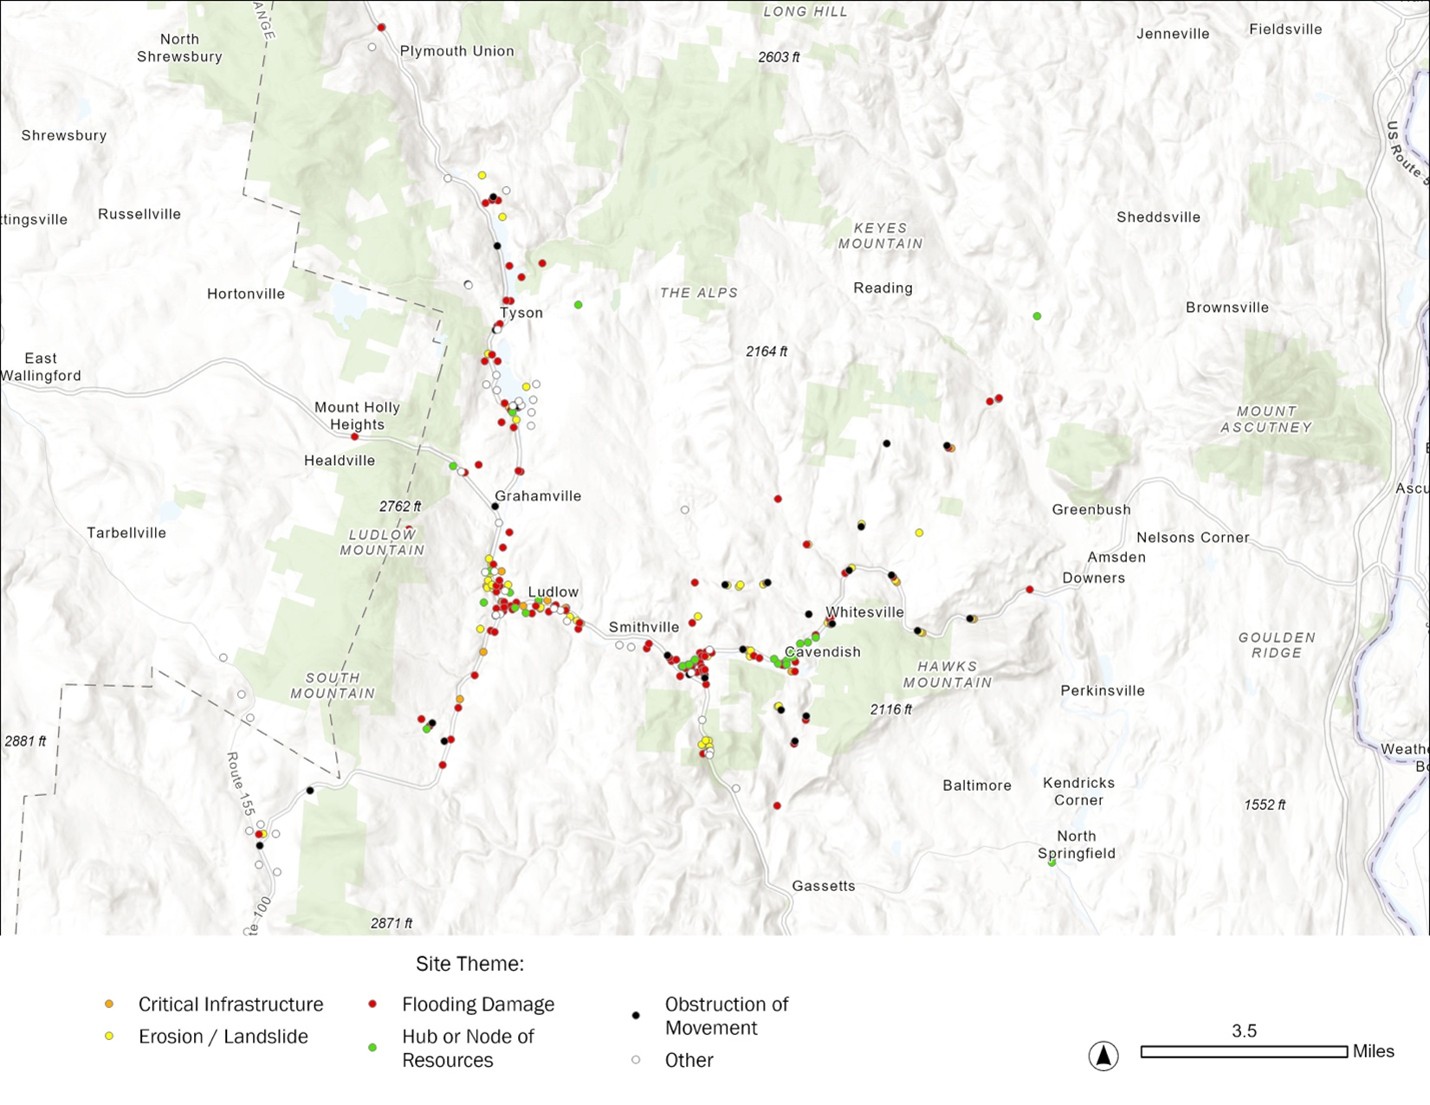
Our two-part second research question asked: What mapping strategies can make state and federal knowledge about land, place, and response reciprocally available alongside local knowledge and mutual aid on those subjects? How and where can such mapping strategies be housed to become resources for future weather events? Our first finding is that using multiple modalities for mapping can help assess the diverse issues faced by communities experiencing flooding impacts in areas outside of FEMA-designated floodplains. Through the community mapping events, we collected 10 paper maps on which residents had marked 320 sites of flooding damage, erosion, obstructed roads, and hubs for recovery. Figure 3 shows the locations of these 320 sites, which are spread out across Ludlow, Cavendish, Plymouth, and surrounding towns, and each of their associated themes.
Figure 3. Sites of Flooding Damage, Response, and Recovery in the Black River Watershed Identified by Residents Through Community Mapping
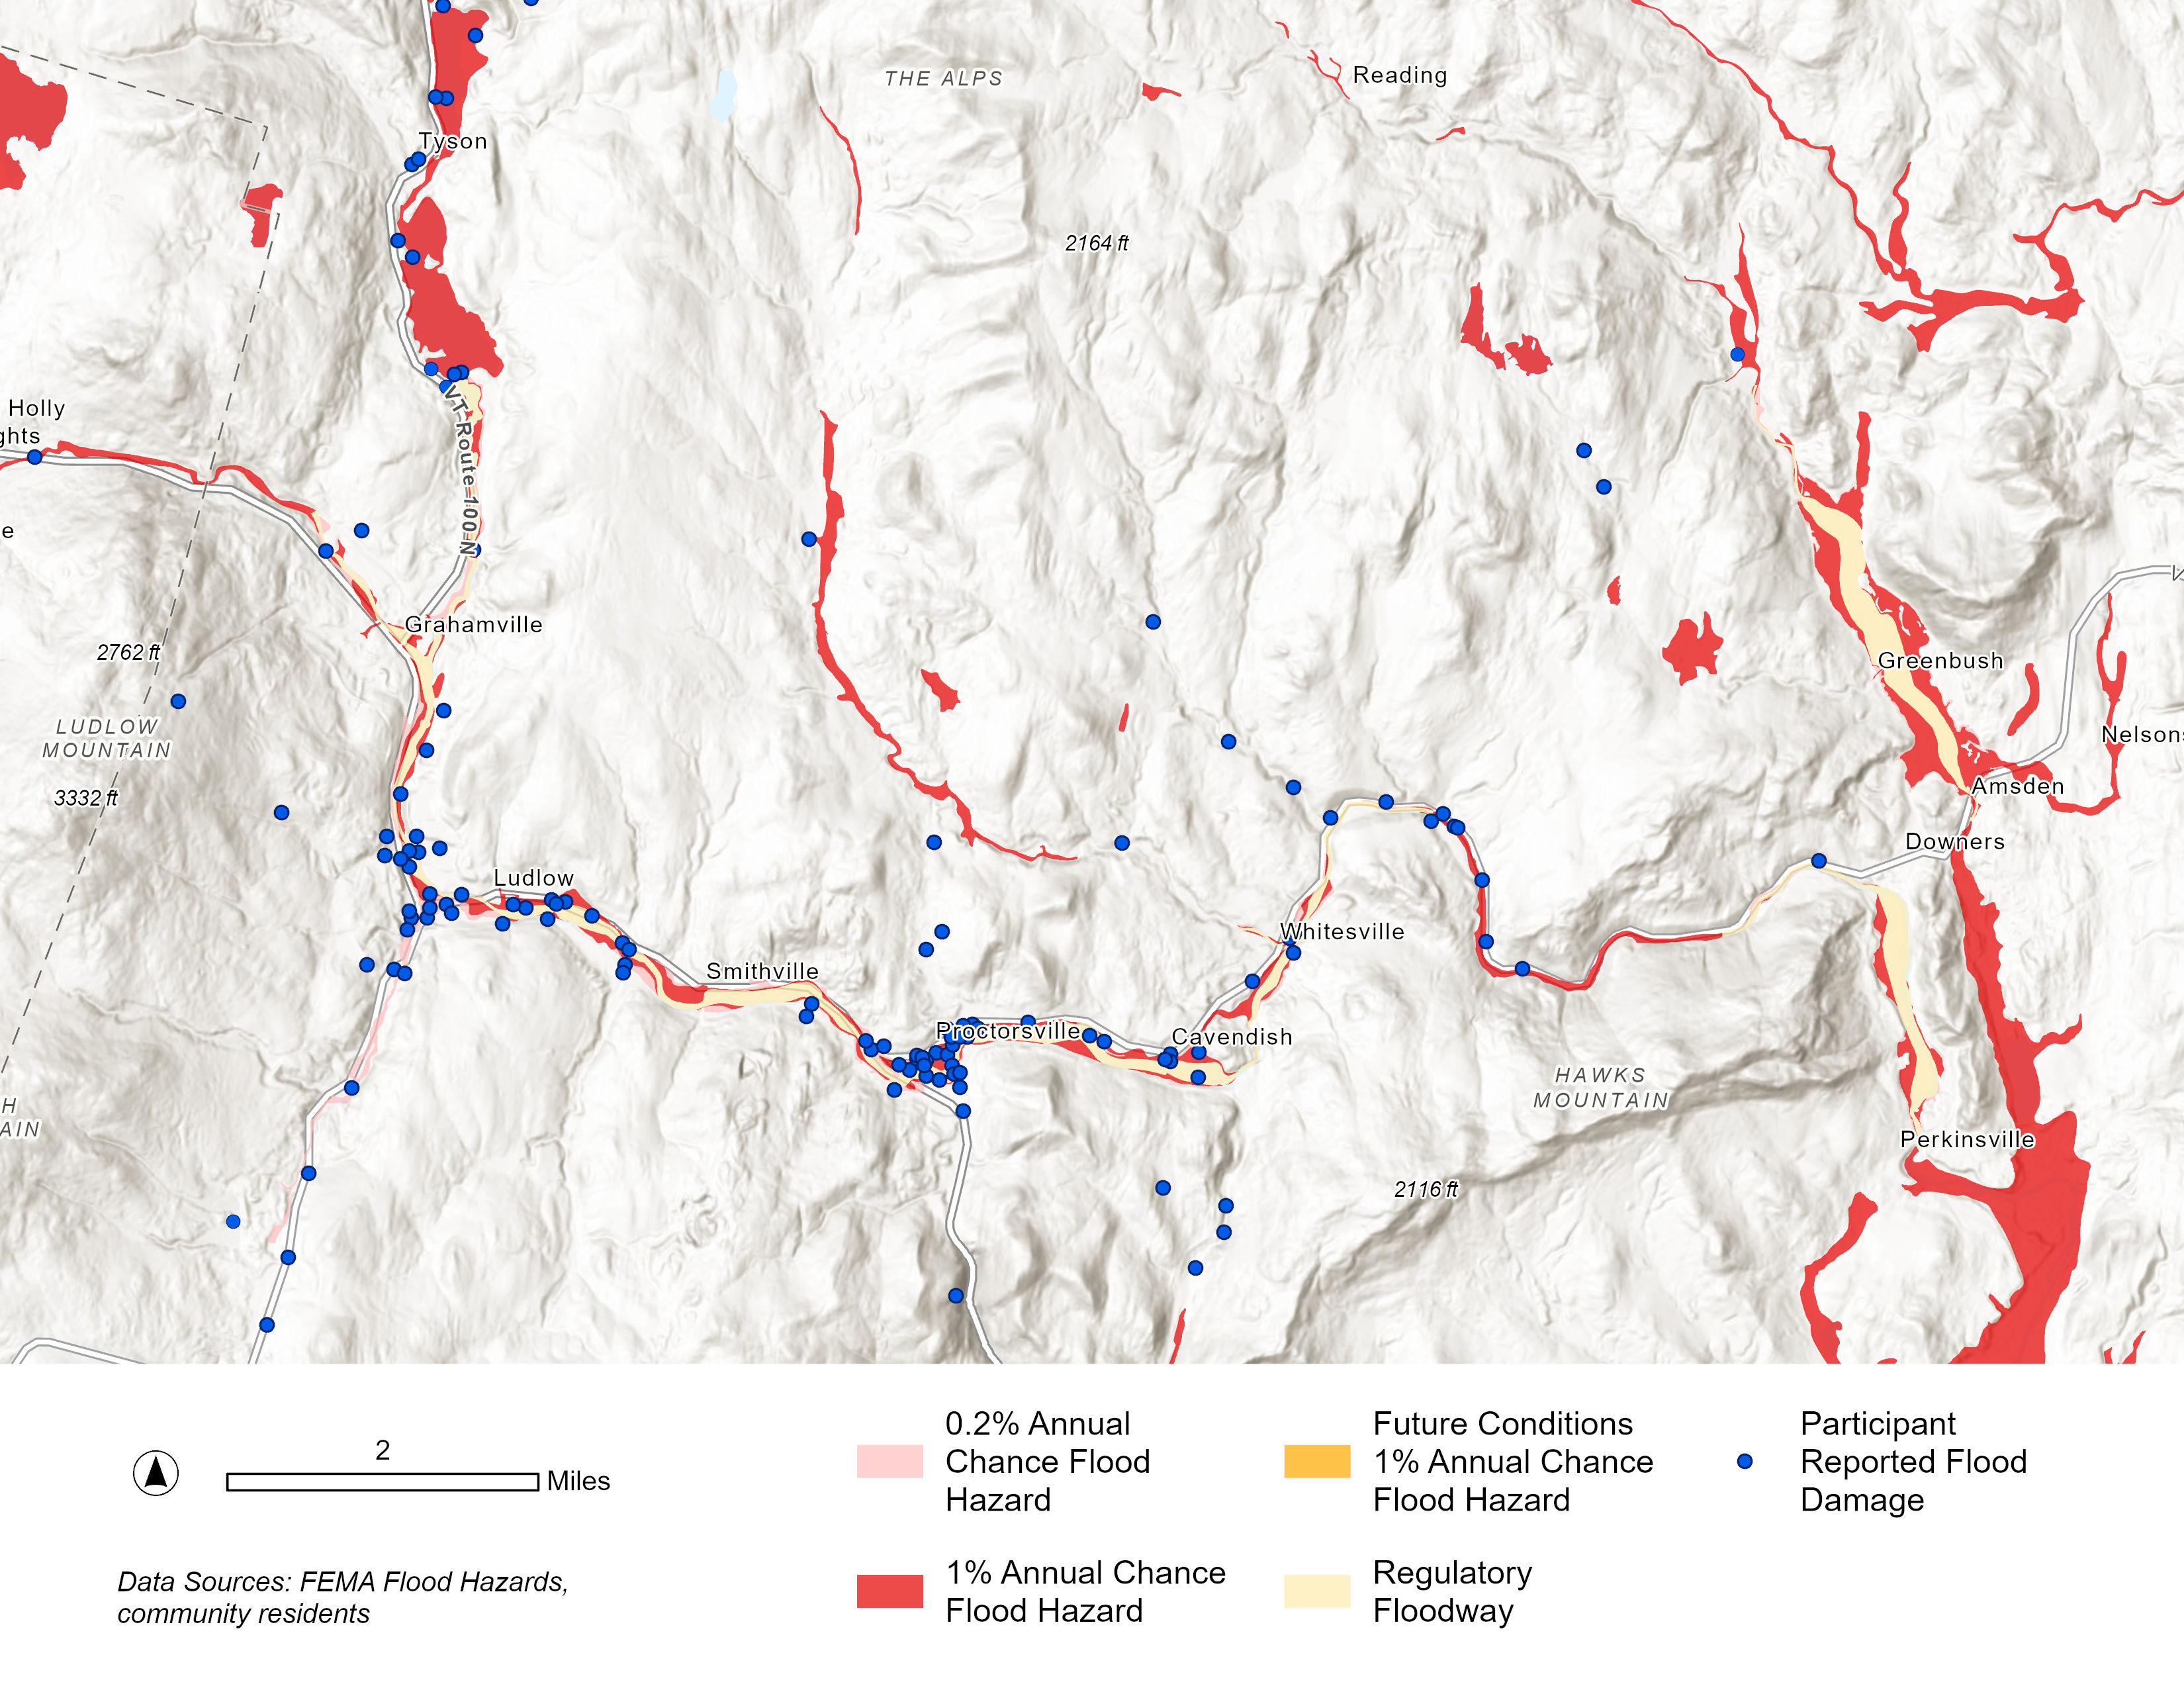
Additionally, we found that roughly one-third of the sites indicated by residents as experiencing direct damage (erosion, undercutting, inundation, seepage) from floodwaters were outside of the FEMA-designated floodways and floodplain areas. In other words, flood waters reached beyond mapped floodplains. Figure 4 illustrates areas where community member observations of areas impacted by inundation differed from FEMA’s flood maps.
Figure 4. Comparison of Participant Observations of Flood Damage With FEMA National Flood Hazard Layers
We suspect a low-to-medium level of locational accuracy on these sites from community mapping of stories. Participants had varying levels of map literacy, and while some were able to find locations easily, others struggled to connect the top-down image of the map with their own mental perception of spaces and relied on the help of their phone maps or input from people at their table (Bezanson, 2025). This introduced locational error into the collected data points, along with digitization into a point-based computer data model, which implies a level of precision in the findings that were absent in the smaller scale paper maps. However, since the purpose of those maps was not only to generate locally accurate data, but to generate a more robust understanding of memory and experience, this low level of locational accuracy does not necessarily limit the findings reported here. Follow-up meetings to get map feedback from the community will help to address some of these errors.
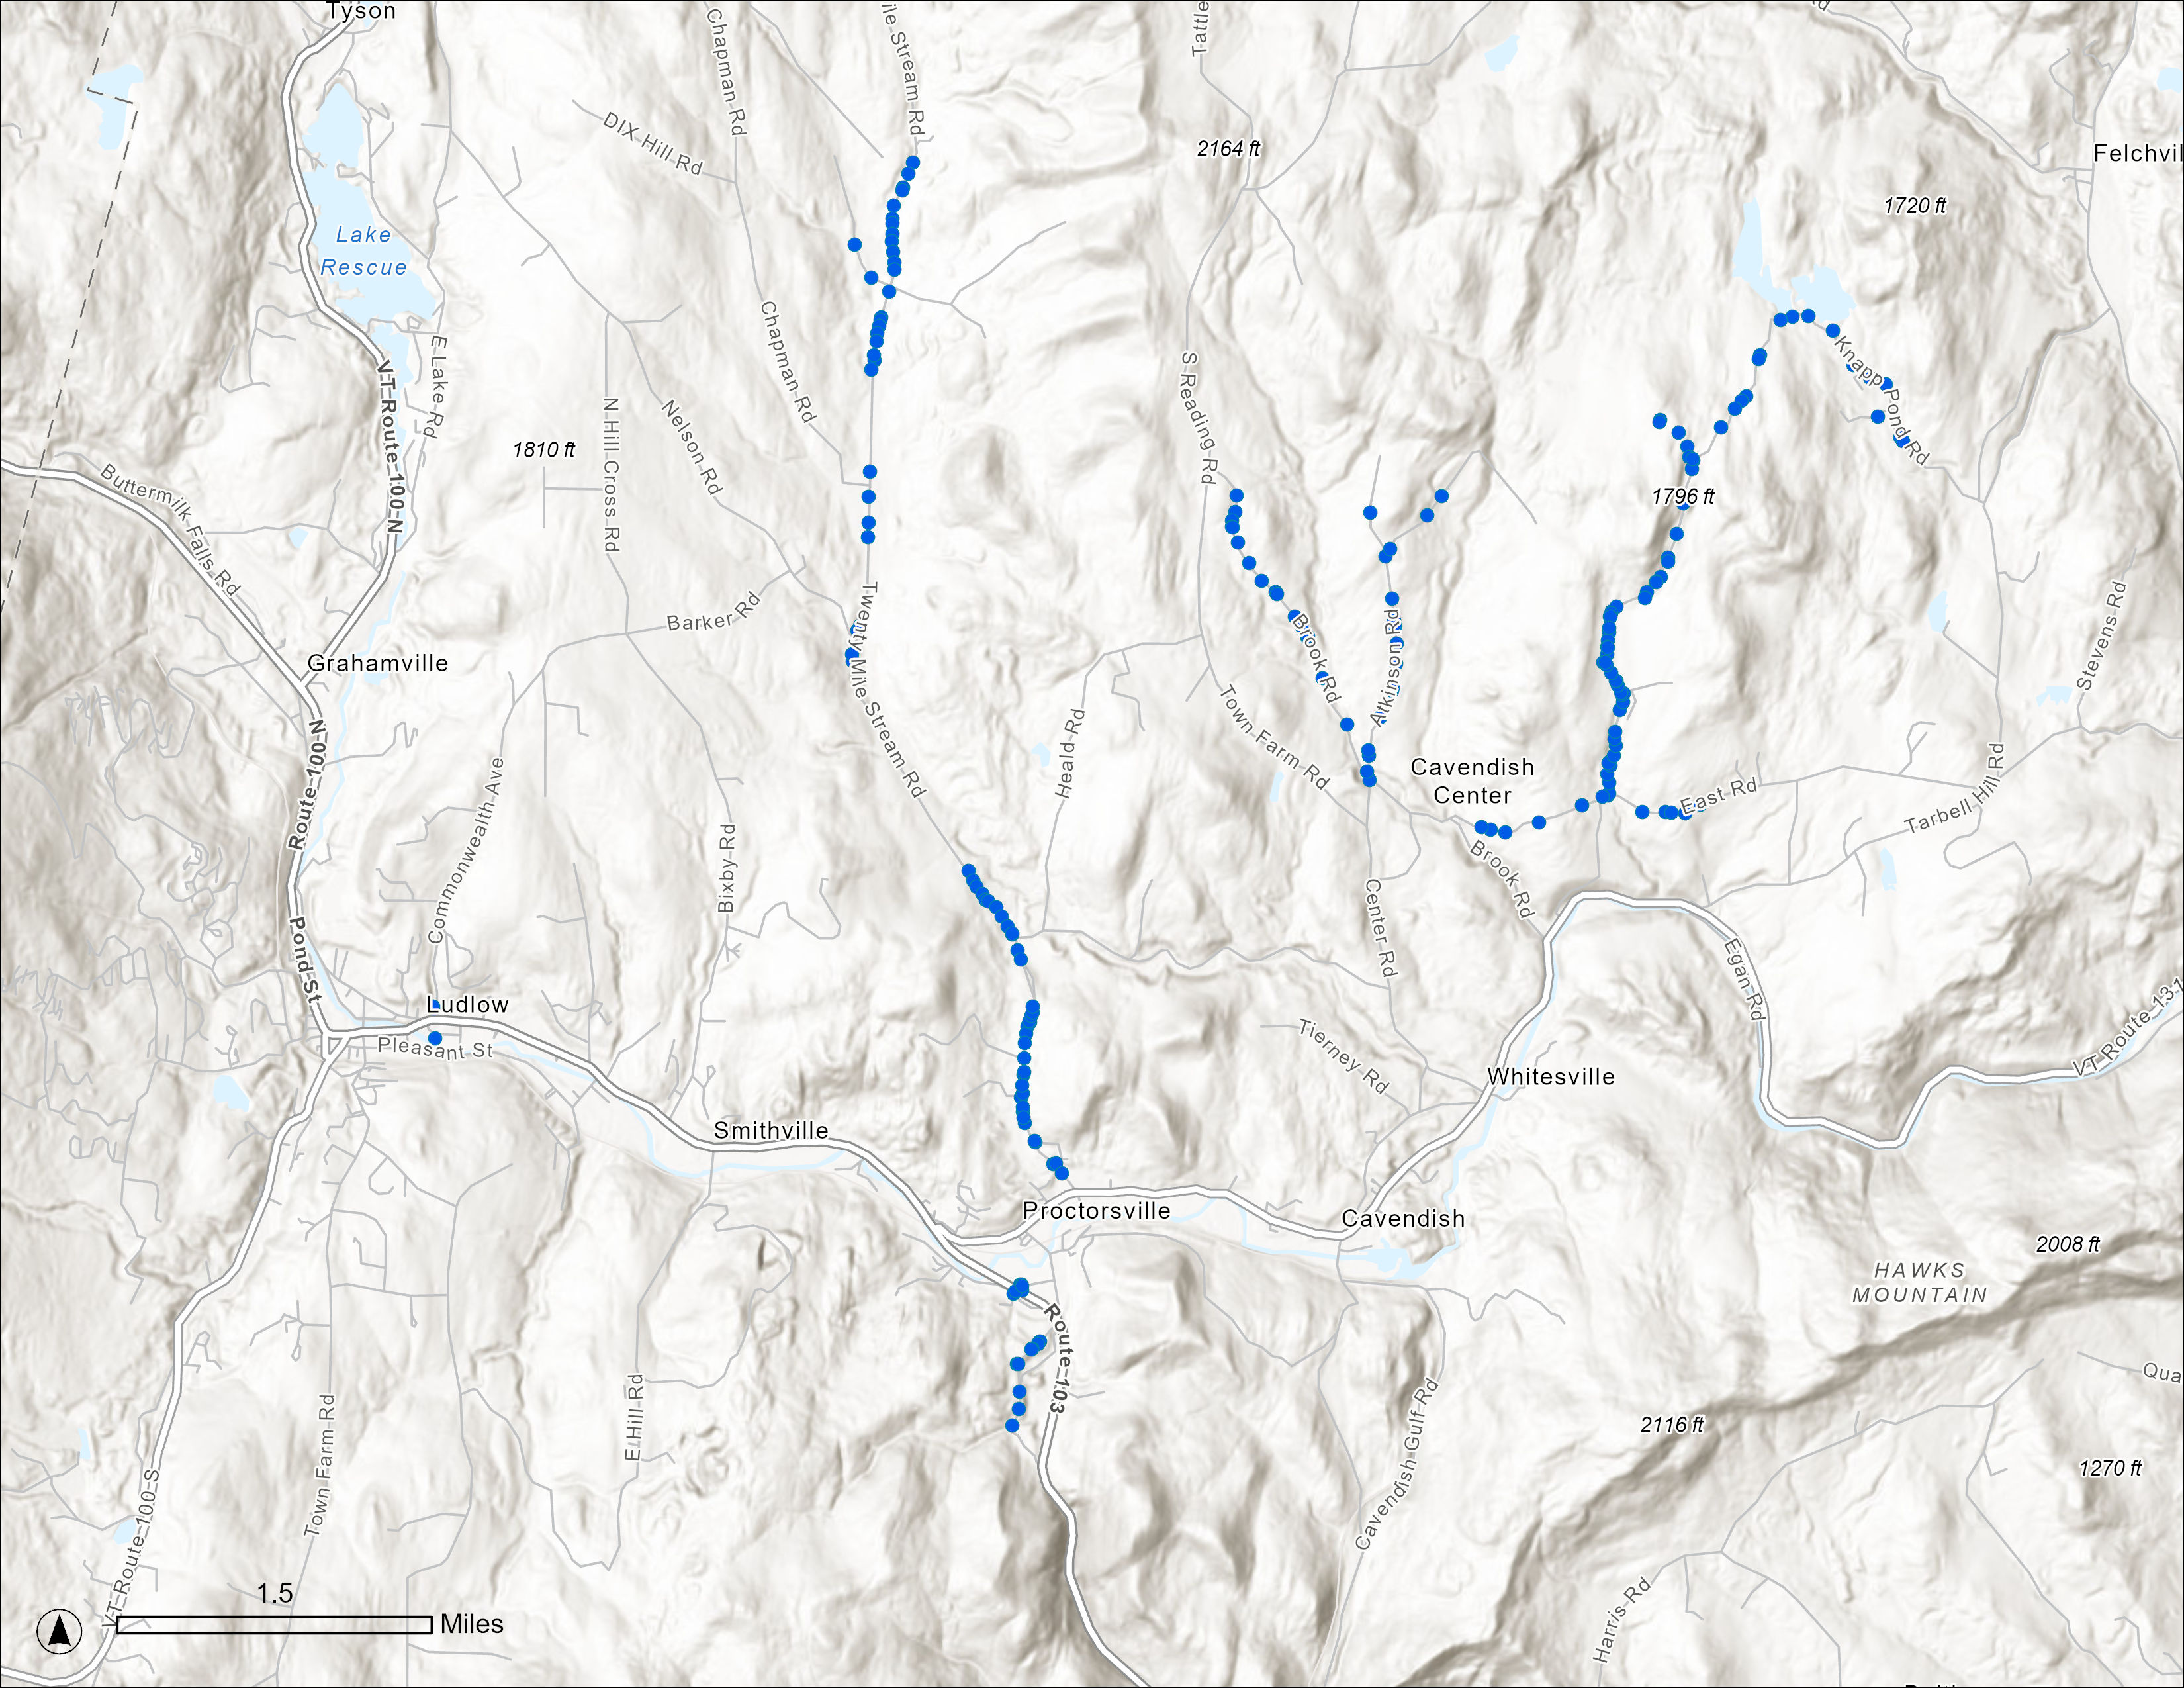
Through the Culvert Crawlers program, we shifted from participatory mapping of stories to mapping stormwater infrastructure. At the time of writing, students and community members have surveyed 407 culverts and collected information about their conditions. The results were given to the local town manager, who began using it to prioritize locations for town crew maintenance. This dataset is publicly available and will be incorporated into the open-source phone app developed through Dartmouth College’s Neukom Institute Faculty Grant for Research Computing . Figure 5 shows the total locations of culverts assessed using the survey tool throughout the survey period. This figure does not include granular details on the condition of infrastructure or causes of poor condition. Causes are multifactorial and thus difficult to render in a figure. In our ongoing development of the Culvert Crawlers app, we are developing ways to assess maintenance needs.
Figure 5. Data Points Collected From Culvert Crawlers Survey
A key connection between our findings on the importance of community science and our findings through participatory mapping relates to barriers to technology access and data visualization. We found details on what specific challenges municipalities, organizers, and states face when hosting and developing tools, such as maps, for visualizing flooding. Many municipalities use Esri’s ArcGIS platform to house digital data. However, these systems are not easily compatible with systems like Computer-Aided Design, which some towns use. Furthermore, Esri’s monopoly and paid-user-login creates barriers for local information production and sharing. We have not found a straightforward solution to this problem. Paper maps offer a possible intervention, as do open-source mapping applications for smart phones. We will continue to investigate these barriers and hypothesize that there is no single solution, but rather iterative locally relevant solutions attuned to cultural and technological contexts.
Conclusions
Overall, our findings suggest that a mixed-methods, community-engaged approach drawing from expertise of a multidisciplinary team is extremely effective at generating diverse, relevant, and immediately impactful data about water’s impacts on human experiences in rural areas during and after flooding. The maps generated through our multi-pronged participatory mapping methodology spatialize and visualize how the community experienced the flood, state-led recovery efforts, and mutual aid. This helped memorialize locations where landslides occurred; roads and bridges were washed out; and buildings acted as hubs for resources and recovery. The process of participatory mapping led to increased connection within the community, as some residents were able to meet local or state officials; share grievances; and hold space for the impacts of the flood, both material and emotional.
Implications for Practice or Policy
We recommend that research teams based in institutions seek ways to implement similar locally appropriate partnerships with community organizations and municipalities to enhance capacity and specificity of data. Those teams should develop locally attuned mapping of risk accompanied by community conversations and local media engagement. This will help residents learn how to decide, for instance, when to shelter in place versus when to relocate to a shelter. We also recommend that formal response groups actively seek out lessons from local communities’ responses and organization efforts. In tandem with providing needed funding and supporting local efforts with in-kind resources, seeking lived knowledge from local communities can strengthen regional and state organizational responses.
Finally, we recommend that this multidisciplinary approach to research be incorporated into engaged pedagogies. This project integrates undergraduate students at Dartmouth College through coursework and participation in the Energy Justice class and Clinic, in Anthropology of Disaster, and in independent student affiliate research. Further, at Colorado School of Mines, Dr. Elizabeth Reddy is incorporating data from this project into a novel course on disaster designed for engineering students, supporting their understanding of disaster and disaster risk mitigation as multifaceted: social, technical, and natural. These activities contribute to the training of future professionals and practitioners in disaster-related fields.
Strengths and Limitations
One significant strength of our study lies in our methods for coupling community science mapping approaches with technologies like Survey 123. As a phone-based app, the technology was available for community members to download and use for free, though it was not always intuitive for all users. Moreover, licensing structures prevented community members from directly uploading data to Dartmouth College’s ArcGIS tool or downloading the resulting data. Community members’ active participation on survey days – as active surveyors or as accompanying partners offering key local context for those entering data – meant that local knowledge is well-represented in the uploaded information, despite licensing roadblocks.
We found that our academic team benefitted from early team retreat-style conversations about our shared and distinct methods and how they address community needs. These early conversations built a strong foundation for creating new knowledge on disaster recovery and response. We also found we could more robustly iterate on identified methods in conversation with community scientists. Community scientists like our partners have their own understandings of methods and knowledge creation that can inform but do not always align exactly with scholarly production. We found it important to continue to ask the question: for whom is knowledge being made?
In our initial proposal we included three questions. In this report we address only two. This is because our first key question—about how different stakeholder definitions of appropriate response and recovery activities, including “mutual aid,” inform cross-scale understandings of vulnerability and preparatory practices for future flooding in this area—is one that requires longitudinal data collection that was not possible in the short timeframe of this award. This question is taken up further in our ongoing NSF-funded research. However, the relationships and methodological innovations developed in these initial investigations have set our team up to continue research on this question and others that have emerged. The need for longitudinal data collection is a key limitation in other areas of this funded research. For instance, our nimble response to changing our methodological approaches based on feedback from our participants means that our community mapping data have some limitations—specifically, due to the short timeframe of conversations in several of our community mapping meetings, there is a lack of thorough and robust context in the data collected. This will be addressed in follow-up interviews.
Future Research Directions
Our National Science Foundation Senior Cultural Anthropology and EPSCoR Award (Boke, 2025-202842) allows us three additional years of longitudinal research to better understand the relationship between property rights, response, and responsibility for disaster recovery. Through additional support from the Natural Hazards Center’s Research-to-Operations Award (Kelly, 202543) and Dartmouth’s Neukom Institute CompX Faculty Grants Program (Kelly, 2025-202644), we are developing a community-accessible, phone-based mapping app for Culvert Crawlers. We anticipate applying for additional funding through the NSF Human-Environment Geographical Sciences Program to interrogate how stormwater infrastructure repair and development is conceived of in rural rivers of Vermont in comparison to coastal infrastructure repair in the seacoast of New Hampshire. We have also collaborated with colleagues to develop a Letter of Intent to apply for a large foundation grant with an ambitious interdisciplinary research project at the intersection of human health and climate change research that builds directly on our work begun with these investigations.
Endnotes
Endnote 1: At the Mount Holly Energy fair, we used a slightly different method, as we had not yet carried out the planned workshop. Participants indicated locations on the map by drawing circles with pens or writing down numbers. ↩
Endnote 2: The EJC is a year-round project-based learning space housed under the umbrella of the Irving Institute for Energy and Society. It is “committed to creating an equitable and accessible energy transition through engaged student learning and meaningful community partnerships.” See more on the EJC website.↩
Acknowledgments. This research relied on collaboration with our key community partners: Kelly Stettner at Black River Action Team, Brendan McNamara for the Town of Ludlow, Rick Chambers for the Town of Cavendish, Margo Caulfield of Cavendish Connects, Melissa Rockhill of the Black River Long Term Recovery Group, the Hartford Energy Commission, Dana Clawson of the town of Hartford, and Caroline Paske of the Vermont Emergency Management community outreach team. We also relied on the collective brilliance, labor, and insight of our many student collaborators at the Energy Justice class and Clinic and in our fall 2024 Anthropology of Disaster class. We are particularly grateful to May Alam, Jack Chou, Dafne Valenciano Coronado, Kalyn Dawes, Nicky Denning, Eben Desilva, Zoe Holmes, Lily Johnson, Zoe Johnson, Sereena Knight, Claire O’Shaughnessy, Erin Parker, Sophie Reynolds, Harper Richardson, Anna Salafsky, Keelia Stevens, Holly Sullivan, and Andrew Wilson.
References
-
Banacos, P. (2023, August 5). The Great Vermont Flood of 10-11 July 2023: Preliminary Meteorological Summary. Burlington, VT Weather Forecast Office, National Weather Service. https://www.weather.gov/btv/The-Great-Vermont-Flood-of-10-11-July-2023-Preliminary-Meteorological-Summary ↩
-
Reddy, E., Boke, C., Spang, A., & Kelly, S. (2025). Expanding “disaster" in the classroom: Critical disaster pedagogies across social science and engineering [Manuscript submitted for publication]. Department of Engineering, Design, and Society, Colorado School of Mines. ↩
-
Birkmann, J., & von Teichman, K. (2010). Integrating disaster risk reduction and climate change adaptation: Key challenges—scales, knowledge, and norms. Sustainability Science, 5(2), 171–184. ↩
-
Li, G., Zhao, J., Murray, V., Song, C., & Zhang, L. (2019). Gap analysis on open data interconnectivity for disaster risk research. Geo-Spatial Information Science, 22(1), 45–58. ↩
-
Reddy, E., Valenzuela, J., Yavorsky, N., Guizzetti, N., & Schroeder, C. (2024). Earthquake Early Warning riskwork: ShakeAlert’s operation with institutionalized uncertainties. Natural Hazards Review, 25(2), Article 04023058. https://doi.org/10.1061/NHREFO.NHENG-1750 ↩
-
Ullberg, S. B., Körling, G., & Strava, C. (2023). Making megaprojects: The practices and politics of scale-making. Ethnos, 90(2), 175-184. ↩
-
Wukich, C., & Mergel, I. (2015). Closing the citizen-government communication gap: Content, audience, and network analysis of government tweets. Journal of Homeland Security and Emergency Management, 12(3), 707–735. ↩
-
United Nations Office for Disaster Risk Reduction. (2015, June 29). Sendai Framework for Disaster Risk Reduction 2015–2030. https://www.undrr.org/publication/sendai-framework-disaster-risk-reduction-2015-2030 ↩
-
Hart, N., Anderson, K. F., & Rifai, H. (2024). “Not enough”: A qualitative analysis of community perceptions of neighborhood government flood management plans using the case of Houston, Texas. International Journal of Disaster Risk Reduction, 104, Article 104354. https://doi.org/10.1016/j.ijdrr.2024.104354 ↩
-
Bezanson, N., Reddy, E., Boke, C., Kelly, S., & Santi, P. (2025). Developing a new interdisciplinary model for mapping flood risks and impacts. Natural Hazards Center Mitigation Matters Research Report Series, Report 24. https://hazards.colorado.edu/mitigation-matters-report/developing-a-new-interdisciplinary-model-for-mapping-flood-risks-and-impacts ↩
-
Malinak, E. and Wells-Spackman, T. (2024, July 28). As Vermont’s weather worsens, emergency communications aren’t reaching all of its rural residents. VTDigger. https://vtdigger.org/2024/07/28/as-vermonts-weather-worsens-emergency-communications-arent-reaching-all-of-its-rural-residents/ ↩
-
National Research Council. (2009). Mapping the zone: Improving flood map accuracy. National Academies Press. https://doi.org/10.17226/12573 ↩
-
Gebremedhin, E.T., Basco-Carrera, L., Jonoski, A., Iliffe, M. & Winsemius, H. (2020). Crowdsourcing and interactive modelling for urban flood management. Journal of Flood Risk Management 13(2), Article 12602. https://doi.org/10.1111/jfr3.12602 ↩
-
Barrios, R., (2017). Governing affect: Neoliberalism and disaster reconstruction. University of Nebraska Press. ↩
-
Binns, A. D. (2023). Preparing for severe flooding: flood risk management research leading to better flood preparedness. Journal of Flood Risk Management 16(3), Article e12936. https://doi.org/10.1111/jfr3.12936 ↩
-
Moser, S. C., Ekstrom, J., & Franco, G. (2012, July). Our changing climate 2012: Vulnerability and adaptation to the increasing risks from climate change in California. A Summary Report on the Third Assessment from the California Climate Change Center. https://www.cakex.org/documents/our-changing-climate-2012-vulnerability-adaptation-increasing-risks-climate-change-california ↩
-
Steinberg, T. (2018). Private property and the defiance of natural limits: Coastal flooding in the United States’ largest city. Global Environment, 11(2), 208–18. https://www.jstor.org/stable/26500364 ↩
-
Swyngedouw, E. (2004). Social power and the urbanization of water: Flows of power. Oxford University Press. ↩
-
Probst, J., Eberth, J. M., & Crouch E. (2019). Structural urbanism contributes to poorer health outcomes for rural America. Health Affairs, 38(12), 1976-1984. ↩
-
Dashti, S., Palen, L., Heris, M. P., Anderson, K. M., Anderson, T. J., & Anderson, S. (2014). Supporting disaster reconnaissance with social media data?: A design-oriented case study of the 2013 Colorado floods. In S.R. Hiltz, M.S. Pfaff, L. Plotnick, & A.C. Robinson (Eds.), Proceedings of the 11th International ISCRAM Conference (pp 632–641). https://idl.iscram.org/files/dashti/2014/423_Dashti_etal2014.pdf ↩
-
Assumpção, T.H., Popescu, I., Jonoski, A., & Solomatine, D.P. (2018). Citizen observations contributing to flood modelling: opportunities and challenges. Hydrology and Earth System Sciences 22, 1473-1489. ↩
-
Garde-Hansen, J., McEwen, K., & Jones, O. (2016). Sustainable flood memory: Remembering as resilience. Memory Studies 10(4), 384-405. ↩
-
de Andrade, M., & Szlafsztein, C. (2015). Community participation in flood mapping in the Amazon through interdisciplinary methods. Natural Hazards, 78(3), 1491-1500. https://doi.org/10.1007/s11069-015-1782-y ↩
-
Brandt, K., Graham, L., Hawthorne, T., Jeanty, J., Burkholder, B., Munisteri, C., & Visaggi, C. (2020). Integrating sketch mapping and hot spot analysis to enhance capacity for community-level flood and disaster risk management. The Geographic Journal, 186, 198–212. ↩
-
Kienberger, S. (2014). Participatory mapping of flood hazard risk in Munamicua, District of Búzi, Mozambique. Journal of Maps, 10, 269–275. ↩
-
Jahre S., and Schmiz, A. (2023, November). Behind the scenes: Reflecting feminist approaches in participatory mapping. Mediapolis - a journal of cities and culture. https://www.mediapolisjournal.com/2023/11/participatory-mapping/ ↩
-
Kelly, S. H. (2021). Mapping hydropower conflicts: A legal geography of dispossession in Mapuche-Williche Territory, Chile. Geoforum, 127, 269–282. ↩
-
McEwen, L., Garde-Hansen, J., Holmes, A., Jones, O., Krause, F. (2016). Sustainable flood memories, lay knowledges and the development of community resilience to future flood risk. Transactions of the Institute of British Geographers, 42(1), 14-28. ↩
-
Hunter, D., Newman, G., & Balgopal, M. (2023) What's in a name? The paradox of citizen science and community science. Frontiers in Ecology and the Environment. 21(5), 244-250. ↩
-
Carpenter-Song, E. (2023). Families on the edge: Experiences of homelessness and care in rural New England. The MIT Press. ↩
-
Leslie, A. (2018). The New England town meeting as icon and ethnographic object: New perspectives on participatory democracy. (Publication no. 10840718) [Doctoral dissertation, University of Chicago]. ProQuest Dissertations & Theses. ↩
-
Vermont Department of Environmental Conservation. (n.d.) River Corridor Planning, Protection, and Restoration. Agency of Natural Resources. Retrieved July 1, 2024, from https://dec.vermont.gov/act250/watershed/rivers/river-corridor-and-floodplain-protection/river-corridor-planning-and-protection ↩
-
Austin, D. (2010). Confronting environmental challenges on the US–Mexico border: Long-term community-based research and community service learning in a binational partnership. Journal of Community Practice, 18(2-3), 361-395. ↩
-
Spice, A. (2018). Fighting invasive infrastructures: Indigenous relations against pipelines. Environment and Society, 9(1), 40-56. ↩
-
Dawes, K., Renshaw, C., & Kelly, S. (2025). Building Hartford Resilience: Prioritizing culvert maintenance to ensure first responder access during and prior to flooding [Unpublished undergraduate honors thesis]. Dartmouth College. ↩
-
Hendricks, M. D., Meyer, M. A., Gharaibeh, N. G., Van Zandt, S., Masterson, J., Cooper, J. T., Jr, Horney, J. A., & Berke, P. (2018). The development of a participatory assessment technique for infrastructure: Neighborhood-level monitoring towards sustainable infrastructure systems. Sustainable cities and society, 38, 265–274. https://doi.org/10.1016/j.scs.2017.12.039 ↩
-
Kingsbury, A., Cahyanto, I., Widodo, E., Puspita, N., & Harnadi, A. (2021). Adapting photovoice with ESRI Survey123 for tourism disaster research in Banten, Indonesia. Current Issues in Tourism, 24(15), 2187-220. ↩
-
Adams, M. (2022). Designing an ArcGIS Survey123 form to be used with field maps to conduct post-storm damage assessments [Master’s thesis, University of Arizona]. UA Campus Repository. https://repository.arizona.edu/handle/10150/664138 ↩
-
Braun, V., & Clarke, V. (2006). Using thematic analysis in psychology. Qualitative Research in Psychology, 3(2), 77-101. ↩
-
Braun, V., & Clarke, V. (2021). Thematic Analysis: A Practical Guide. Sage. ↩
-
Federal Emergency Management Agency. (2025, August). Verifying home ownership or occupancy. FEMA Assistance for Individuals. https://www.fema.gov/assistance/individual/after-applying/verifying-home-ownership-occupancy#ownership ↩
-
Boke, C. (Principal Investigator). (2025-2028). Cooperation, communication, and networks in the context of inland riverine flooding (2446303) [Grant]. National Science Foundation. https://www.nsf.gov/awardsearch/showAward?AWD_ID=2446303&HistoricalAwards=false ↩
-
Kelly, S. H. (Principal Investigator). (2025). Building a community science tool for inland flooding in Vermont [Award]. Natural Hazards Center. https://hazards.colorado.edu/research/weather-ready-research/funded-proposals#callseven ↩
-
Kelly, S. H. (Principal Investigator). (2026-2026). Building a community science tool for Inland flooding in Vermont [Grant]. Neukom Institute CompX Faculty Grants Program. https://neukom.dartmouth.edu/research/past-recipients/2025-compx-recipients ↩
Boke, C. F. M., Kelly, S. H., Spang, A., Sullivan, H., Valenciano Coronado, D., Reddy, E., Bezanson, N., & Silvestro, A. (2025). Assessing the 2023 Floods in Rural Vermont: Multimodal Methodology and Community Science for Mitigation in the Black River Valley. (Natural Hazards Center Weather Ready Research Report Series, Report 17). Natural Hazards Center, University of Colorado Boulder. https://hazards.colorado.edu/weather-ready-research/assessing-the-2023-floods-in-rural-vermont