Assessing the Impacts of Winter Storm Uri in Subsidized Housing Developments
Publication Date: 2023
Abstract
Neighborhoods with subsidized housing often have many households with economical disadvantages. The surrounding communities are also underserved and lack the physical and social infrastructure needed to support the adaptive capacity of residents to respond to environmental stressors. When the devasting Winter Storm Uri hit Texas in February 2021, infrastructure and housing was devastated and residents experienced many adverse health outcomes. However, existing policies do not adequately address the impacts of cold events or assess the capacity of the physical and social infrastructure to withstand such disasters, especially in hot climate zones. This report describes how subsidized housing residents in Bryan–College Station, Texas, experienced cold stress during Winter Storm Uri and the extent to which damage to physical and social infrastructure contributed to their health outcomes. We used a mixed methods approach that included a microclimate assessment, survey research, and semi-structured interviews. For the microclimate assessment, we conducted field measurements and used modeling tools that allowed us to simulate the microclimate conditions during the storm and assess the level of cold stress residents experienced throughout its duration. Our findings show that residents in the research site endured “extreme cold stress” during the majority of the hours that the winter storm affected the state. In addition, outdoor thermal conditions exhibited spatial variations such that the wind-blocking effects of a building decreased as the distance to the buildings increased. These findings and others in the report have several implications for policy and practice, including recommendations to improve preparation for cold events in the southern United States, and building and design mitigation policies that may improve the thermal conditions in vulnerable communities in warmer climate zones.
Introduction
From February 13-17, 2021, Winter Storm Uri brought severe cold to Texas, unleashing unprecedented damage to its housing and infrastructure. The state power grid failed and left approximately 4.5 million homes and businesses in Texas without electricity. An astonishing and 69% of Texas residents experienced blackouts for an average of 42 hours (School of Public Affairs University of Houston, 20211). At least 246 Texans died during the cold surge, most succumbing to hypothermia which was the leading cause of death (Hellerstedt, 20212). Winter Storm Uri highlights the vulnerability to cold stress in the southern United States and the urgent challenge that extreme weather poses to society as climate change makes these events more frequent and intense.
It has been widely shown that disaster impacts like those described above are not evenly distributed (Cutter, 20213). Our study, for example, focuses on residents in subsidized housing , which previous studies have shown are disproportionately harmed by extreme weather events (Gabbe & Pierce, 20204). Neighborhoods with a high stock of subsidized housing units tend to have more nonwhite residents and residents with incomes below the poverty line. Nonwhites and individuals with low incomes also suffer disproportionately from disasters. These individual and neighborhood-level disadvantages overlap and exacerbate disaster impacts, leaving these residents with fewer financial resources and access to medical services (Cutter et al., 20035).
In addition, populations in warmer regions of the country are more vulnerable to colder temperatures because southern cities are ill-prepared for cold weather (Curriero et al., 20026; McMichael et al., 20067). This lack of institutional readiness is especially grave for s housing residents who are more likely to or suffer from preexisting health conditions than other residents (Digenis-Bury et al., 20088; Ruel et al., 20109). Concrete research is needed to assess the severity of cold stress that vulnerable residents in hot climate zones experience during extreme cold events. This evidence is necessary to develop policies and mitigation strategies in the most disadvantaged neighborhoods that can lessen the impacts of future disasters and promote equity in disaster response and preparedness. This mixed methods study is designed to address these gaps.
Literature Review
Thermal Comfort in Built Environments
Over the last few decades, researchers have carried out multiple studies assessing urban thermal comfort in a variety of built environmental settings such as streets, parks, residential areas, and schools (Lau et al., 201510). The majority of these studies have evaluated thermal comfort of pedestrians on urban streets. Several studies have examined on site microclimate conditions and individual thermal comfort in outdoor public spaces, seeking to provide practical design guidelines to improve the microclimates in these built environments (Lai et al., 201411; Mi et al., 202012), Research on residents’ thermal comfort in subsidized housing neighborhoods, however, is limited. Most studies of subsidized housing have explored indoor thermal conditions and their effects on occupants’ living environments, adaptability to environmental stressors, and energy consumption (de Dear et al., 199113; Sosa et al., 201814; Wong et al., 200215). Very few studies have assessed outdoor thermal environments in neighborhoods with high stocks of subsidized housing units. Mahmoud et al. (201916) and Paramita et al. (201817), for example, discussed the impacts of building forms and configurations on residents’ thermal comfort in public housing neighborhoods. Krebs et al. (201718) investigated the cooling effects of green roofs on a public housing project in Brazil. Lau et al. (201919) and Huang et al. (202020) evaluated summer microclimate conditions, human heat stress, and outdoor activities in public housing estates in Hong Kong. Additionally, at the neighborhood scale, Gabbe and Pierce (2020) examined the extreme heat vulnerability of residents in subsidized housing in California. Moreover, it is notable that existing studies on subsidized housing and their surrounding neighborhoods have only examined summertime heat stress, unlike research in other urban contexts (e.g., street canyons, urban parks, and university campuses) that considered thermal conditions across all four seasons (Lai et al., 2014; Mi et al., 2020; Nikolopoulou & Lykoudis, 200621).
Approaches to Studying Urban Microclimates
Three approaches show great promise in advancing studies on urban microclimate and human biometeorological conditions in these environments: in situ measurements, field surveys, and three-dimensional (3D) simulations. In situ measurements seek to quantify built environment characteristics (e.g., sky view factors) and meteorological conditions (Johansson, 200622; Mayer & Höppe, 198723). These measurements are often used as inputs in thermal comfort models to compute thermal comfort indices such as the physiological equivalent temperature (PET) (Höppe, 199924). Field surveys use questionnaires or in-person interviews to collect information about personal characteristics and human thermal experiences (Cheng et al., 201225; Lin, 200926). Meanwhile, 3D simulations draw on modeling software to simulate on-site microclimate environments and compute human thermal perceptions (Gaspari et al., 201827; Gulyás et al., 200628). ENVI-met, a microclimate modeling software, is widely employed to simulate urban thermal environments (Liu et al., 202129). It allows for 3D simulation to assess the thermal performance of green infrastructures in urban contexts (Bruse & Fleer, 199830; Yang et al., 201931). Several studies have also used ENVI-met to evaluate thermal conditions in residential areas and reveal the impact of building layout on thermal comfort (Mahmoud, 2019; Paramita et al., 2018; Srivanit & Jareemit, 202032). The combination of these three methods allows for fine-scaled assessment, validity, and exploration of the underlying causes. Overall, there is a lack of studies investigating thermal comfort in the built environment of subsidized neighborhoods. Most studies have focused on heat stress and mitigation. No study to date investigates cold stress in such neighborhoods, nor the relationships between clothing thermal insulation and cold stress in that context.
As residents experience a prolonged power blackout without heating, the indoor temperature continues to decrease and might ultimately reach levels similar to the outdoor thermal conditions. An examination of the neighborhood cold stress offers critical information regarding not only the safety of outdoor activities but also safety and health risks indoors when power outages occur. In addition, the extent to which physical and social infrastructure conditions moderate the relationships between cold exposure and health outcomes remains unclear. Elucidating these relationships will inform effective cold stress prevention/mitigation policies and emergency response programs.
Research Questions
The objectives of this study are to assess the micrometeorological conditions and human cold stress in subsidized housing neighborhoods during Winter Storm Uri and to determine the extent to which greater physical and social infrastructure are associated with reduced cold stress and post-disaster health outcomes. The definition of subsidized housing may vary in different contexts. In this study, we define subsidized housing broadly as housing units that are affordable and provided by private owners, which encompasses assistance in forms such as capital contribution, operating subsidies, land subsidies, and tax relief (Semer et al., 197633). We ask the following three questions:
- Were residents in subsidized housing neighborhoods at high risk of cold stress caused by Winter Storm Uri?
- Were the spatial variations in neighborhood outdoor biometeorological conditions related to the layout of the buildings?
- To what extent were physical and social infrastructure and sociodemographic conditions associated with cold sensation and risks of injuries during the storm?
In the following sections, we describe our research methods and discuss the preliminary results from the survey, in-situ measurements, and biometeorological assessments. We are currently analyzing the semi-structured interviews and we will present our analysis of these data in future academic publications.
Methods
We employed a mixed methods research design, integrating micrometeorological field measurements in the neighborhood sites with a retrospective survey and semi-structured interviews with residents. These multiple methods ensured that we captured both the objective cold hazard conditions and the subjective experiences and perceptions of individuals. This report presents our preliminary analysis of the survey and in situ microclimate study. We describe the biometeorological methods and the semi-structured interview methods we employed for this study in detail in our recent publications (D. Li et al., 202334; X. Li et al., 202235).
Survey
We distributed a mail survey to all households in subsidized apartment complexes in Bryan–College Station to examine the experiences of subsidized housing residents during Winter Storm Uri, their cold exposure and cold-related symptoms, adaptation strategies, housing infrastructure, social cohesion, and post-disaster physical and mental health conditions.
The survey sampled households in apartment complexes in College Station and Bryan, Texas. The majority of these housing units are funded through the Low-Income Housing Tax Credit program, which offers tax incentive to owners to keep rent low. The rest of the properties are funded through the Department of Housing and Urban Development (HUD) Section 202 Supportive Housing for the Elderly program, which provides capital advance to private sponsors to finance the housing development. We developed the survey frame from a third-party address list based on the U.S. Postal Service Delivery Sequence File. There was a total of 1,253 valid household addresses.
Between April and June 2021, we mailed survey packets to all households listed in the frame, with two follow-up postcard reminders. We developed the survey questionnaire by drawing on previously established scales and questions. Our survey measures are described in more detail below. In each survey packet, we included an information sheet, survey questionnaire, and a postage-paid return envelope. Participants had the option of completing a physical copy of the survey or using a URL and QR code to complete a web version of the survey. We received a total of 73 valid responses . Of these, 34 volunteered to complete a follow-up semi-structured interview, each of which lasted between 20-70 minutes. Participants in the survey received a $10 gift card as compensation, and those who completed the interview received an additional $20 gift card.
Survey Measures
Disaster Stressors and Experience. We evaluated disaster experience using items from scales measuring disaster stressors, such as home damage, lack of food or water, lack of medicine or access to medical care, and financial difficulties (Harville et al., 201536; Raker et al., 202037). For cold-related symptoms, we used a checklist including of hypothermia symptoms from the Centers for Disease Control and Prevention (CDC) which included both early symptoms (e.g., shivering, fatigue, loss of coordination, confusion and disorientation) and late symptoms (e.g., blue skin, dilated pupils, slowed pulse and breathing, loss of consciousness) (Centers for Disease Control and Prevention, 201838; Sugg et al., 201939). We then assessed participants’ thermal sensations during the coldest hours using a Likert scale item. Participants self-reported any injuries they experienced either directly from the storm (e.g., being struck by, falling debris), or as a result of losing electricity or hazardous road conditions were the self-reported measures of harm. We created the injuries measure by researching the most common injuries caused by historical snow/ice storms and adapting it into a checklist (Broder et al., 200540; Geehr et al., 198941; Hartling et al., 199942). The most common injuries included damaged structure/falling object, motor vehicle accident, carbon monoxide exposure, slips/falls, burns, cold exposure, injury due to darkness, and exertion.
Housing Infrastructure. We measured housing quality and equipment using five-point scales, with a particular focus on thermal comfort performance, such as overall space, room temperature in summer, presence of damp walls, broken frames, and poor ventilation. We also obtained information regarding whether there was a working heating unit in the apartment at the time of the winter storm. We calculated the total housing quality by averaging across all items.
Social Infrastructure. We evaluated social infrastructure using the 15-item Neighborhood Cohesion Scale, which comprises two subscales: neighborhood belonging and social cohesion (Fone et al., 200643). Items on the scale included how the respondent perceives the attractiveness of the neighborhood, sense of belonging, and reciprocal exchanges between neighbors. Scores were tallied based on the two subscales.
Behavioral Adaptation. Participants self-reported the adaptation strategies they or their family members used from a checklist of nine commonly taken measures, including wearing layers of clothing, using a heater, using a fireplace, plugging up gaps around doors and windows, staying in a car, and going to a warm center.
Post-Disaster Health. We measured health outcomes using the CDC Healthy Days Core Module which assesses physical and mental health and other quality of life issues in the past month (Centers for Disease Control and Prevention, 200144). To measure stress, we used the Perceived Stress Scale with four questions on self-reported level of stress in daily life over the past month (Cohen et al., 198345). For both measures, the higher the score, the more likely the participant was to experience impaired health or stress.
In Situ Microclimate Study
We evaluated the microclimate conditions during the winter storm using an in situ micrometeorological study. Of the neighborhoods sampled for the survey, we selected three neighborhood sites for conducting the in situ measurement.
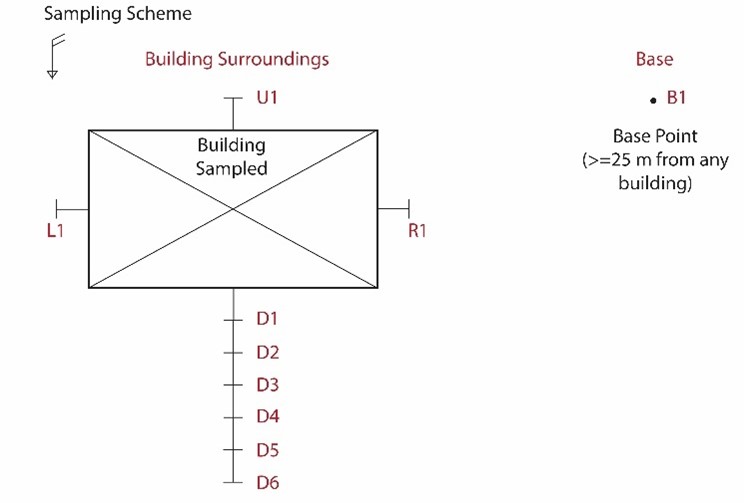
To capture micrometeorological conditions resembling the conditions during the snowstorm, we took measurements on cool spring days with wind speed higher than 6.7 m/s, wind direction from the north and north-northeast, and air temperature mostly lower than 15 °C. We placed a Gill Instruments MaxiMet GMX500 Compact Weather Station 1.5 meters above the ground to collect meteorological data. Figure 1 shows the sampling scheme we used to gather measurements for each neighborhood. It depicts how we sampled one base location in the open away from any building and eight locations surrounding the apartment building. Our initial pretest data showed that the microclimate conditions changed sharply as the measurement point moved in the downwind direction of the building. As a result, we placed five additional sample locations that were 5 meters apart on the downwind side (south) of the building . On the other sides of the building (north, east, and west), we placed one sampling location 5 meters away from the walls. We collected measurements of the air temperature (°C), wind speed (m/s), wind direction (degrees), and relative humidity (%). Measurements were taken for 1-2 minutes for each location at a sampling interval of 10 seconds.
Figure 1. Sampling Scheme
Simulating Microclimate Conditions During the 2021 Winter Storm
We collected the in situ measurement data on cool spring days. To reconstruct the conditions during the winter storm, we simulated the microclimate conditions mathematically by inputting our measurements into ENVI-met, a three dimensional computational fluid dynamic model which allows the simulation of microclimate conditions in the built environment (Bruse & Fleer, 1998) . We created a simulated domain for each neighborhood. The model consists of three-dimensional grids at 1 meter resolution. The ground-level vertical grid was further divided into five equidistant sub-grids of 0.2 meters for enhanced accuracy. We input the air temperature, humidity, wind speed, and wind direction measurements from February 15, 2021 the third day of the storm, based on city-level prevailing weather data collected from the Easterwood Field weather station. A summary of these measurements is available in Table A1 in the appendix. Regarding the input natural and built environmental variables, we modeled soil type, ground surface pavement, building surface material, and vegetation according to the species observed on site in the neighborhoods.
We used the in situ micrometeorological data collected during the cool spring day to validate and calibrate the ENVI-met models simulated for the same days. We extracted the micrometeorological results for the measurement locations from the ENVI-met models and validated them against the ground truth data. We then examined goodness of fit (R2) and Root Mean Squared Error (RMSE) to determine the validity of the ENVI-met models.
Assessing Biometeorological Cold Stress during the 2021 Winter Storm
To estimate human thermal conditions during the winter storm, we used two human energy balance models: the physiological equivalent temperature (PET) model ( Höppe, 1999) calculated in the ENVI-met BioMet module and the COMFA energy budget model calculated using the COMFA model template (Brown & Gillespie, 198646). The model takes into account the variations in thermal comfort levels based on age, gender, weight, height, and clothing insulation. As many residents suffered from financial difficulties and might have lacked winter clothing, we considered three different clothing heat-resistance scenarios based on the types of clothing available: Scenario 1 (bare face), which simulated the baseline condition with no clothing; Scenario 2 (light clothing), which represented the individual as having no winter clothes and relying on pieces of summer clothes; and Scenario 3 (warm clothing), which corresponded to the individual having sweaters or similar pieces of clothing intended for cold weather.
PET is calculated based on the Munich energy balance model for individuals (P. Höppe, 1999) as in Equation (1):
where M is the metabolic rate, W is the physical work output, R is the net radiation of the body, C is the convective heat flow, ED is the latent heat flow to evaporate water diffusing through the skin (imperceptible perspiration), ERe is the sum of heat flows for heating and humidifying inspired air, ESw is the heat flow due to evaporation of sweat, and S is the storage heat flow for heating or cooling the body mass. The outcome of PET is in °C and is interpreted as the equivalent thermal sensation of the same air temperature indoors without wind and solar radiation.
The COMFA energy budget model incorporates human-environmental heat exchange in order to consider microenvironmental effects on human thermal comfort. It is calculated using Equation (2):
where M is the metabolic energy for heating the body (W/m2), Rabs is the absorbed solar and terrestrial radiation (W/m2), Conv is the sensible convective heat exchange (W/m2), Evap is the evaporative heat loss (W/m2), and TRemitted is the emitted terrestrial radiation (W/m2).
Statistical Analysis
For the survey analysis, we used descriptive statistics and visualizations and tallied characteristics of the participants and their reported conditions during the winter storm. Additionally, we conducted bivariate Pearson’s r and Spearman’s rho correlations and generalized linear models to examine the relationships between physical infrastructure, social infrastructure, adaptive capacies, reported thermal sensations, likelihood of showing cold-related symptoms during the storm, and post-storm health conditions. In situ measurements validate the ENVI-met model outputs, including air temperature and humidity, with agreement being the coefficient of determination (R2) and root mean square error (RMSE). For air temperature, the predicted values demonstrated good agreement with measured values (R2 = 0.97, RMSE = 0.96, p < 0.001). For relative humidity, the agreement was slightly lower but still within a satisfactory range (R2 = 0.85, RMSE = 3.53, p < 0.001). These values are generally consistent with prior studies that report R2 values between 85% and 95% for ENVI-met model validation results (Teshnehdel et al., 202047). Based on the ENVI-met model outputs, the meterological and biometerological data demonstrate the spatiotemporal variations of air temperature, humidity, wind speed, and solar radiation. We then compared the intra- and inter-neighborhood cold stress conditions and analyzed the effects of having light clothing versus warm clothing.
Results
Descriptive Statistics of Survey Participants
Surveys were collected from 73 respondents residing in 11 neighborhoods. The majority of participants were male (n = 44; 62%) and their mean age was 61 (Range: 20-96). In terms of ethnicity, approximately 11% (n = 8) of respondents were Hispanic whereas 89% were not Hispanic (n = 62). In regards to race, nearly two-thirds of respondents (66%) reported being Caucasian (n = 46) while 27% were African American (n = 19). About two-thirds (n = 42; 60%) of respondents reported high school completion or higher. More than half (n = 41; 58%) had a household income of less than $14,999. Most respondents were unemployed or retired (n = 57; 80%), and 20% (n = 14) were full-time or part-time employees. Nearly 93% (n= 66) of respondents rented their apartments , and, on average, they had lived at their current address for more than 6 years. Almost all respondents (n = 72; 99%) reported that their units had heating systems. See Table A2 in the appendix for a summary of the descriptive statistics of survey respondent characteristics.
During Winter Storm Uri, 60% (n = 44) of the sample reported feeling cold, and 27% (n = 20) of the sample reported feeling cool. The mean days of suffering physical distress and mental distress were, respectively, about 6 days and 7 days. On average, respondents experienced more than two types of cold stressors, more than one cold-related symptom, and at least one injury. Figure 2 shows the percentage of respondents who experienced each type of disaster-related stressor. Among those who reported at least one stressor, “lost power supply” (56%) and “lost water supply” (41%) were most common, followed by “lacked food and water” (34%) and “suffered from financial difficulties” (21%). Stressors related to the requirement of shelter due to home damage were the least common (1%).
Figure 2. Percentage of Respondents Experiencing Disaster Stressors
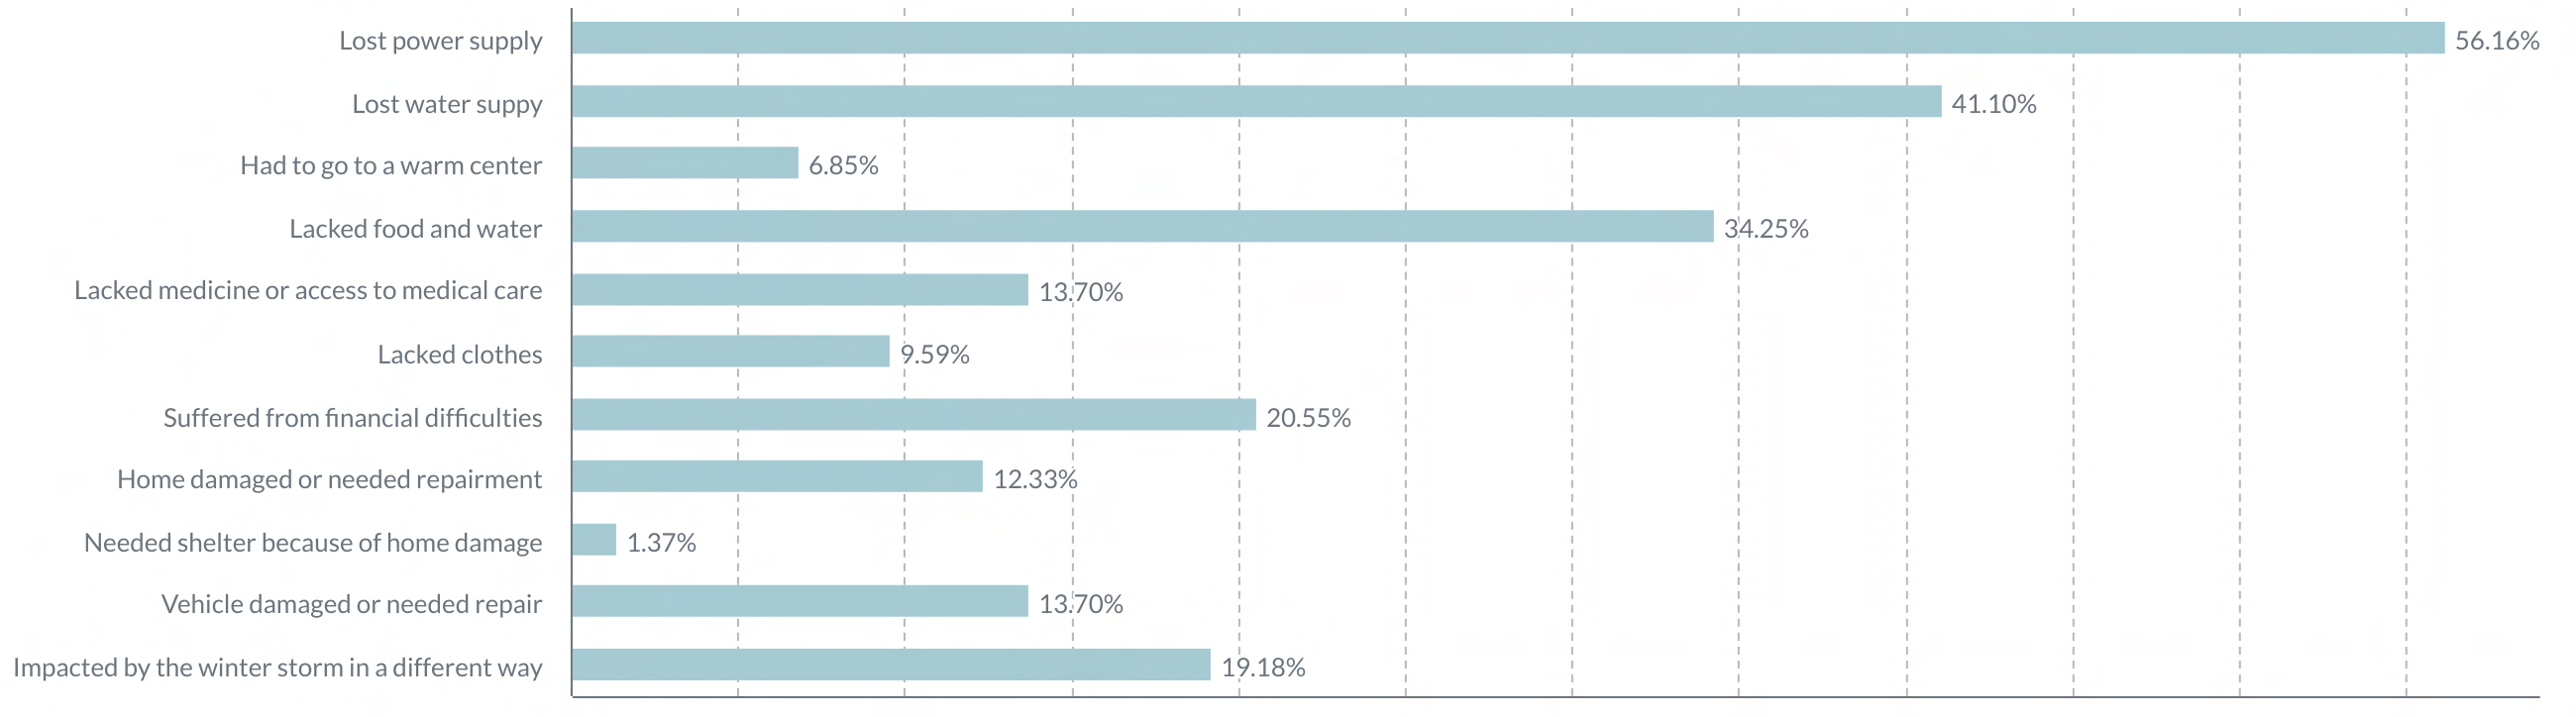
Figure 3 depicts the percentage of respondents who experienced an injury related to the winter storm conditions. Among respondents who reported at least one injury, “slips/falls” (32%) and “cold exposure” (27%) were the most common causes of injuries. None of the respondents experienced burns.
Figure 3. Percentage of Respondents Experiencing Injuries Resulting From Storm Conditions
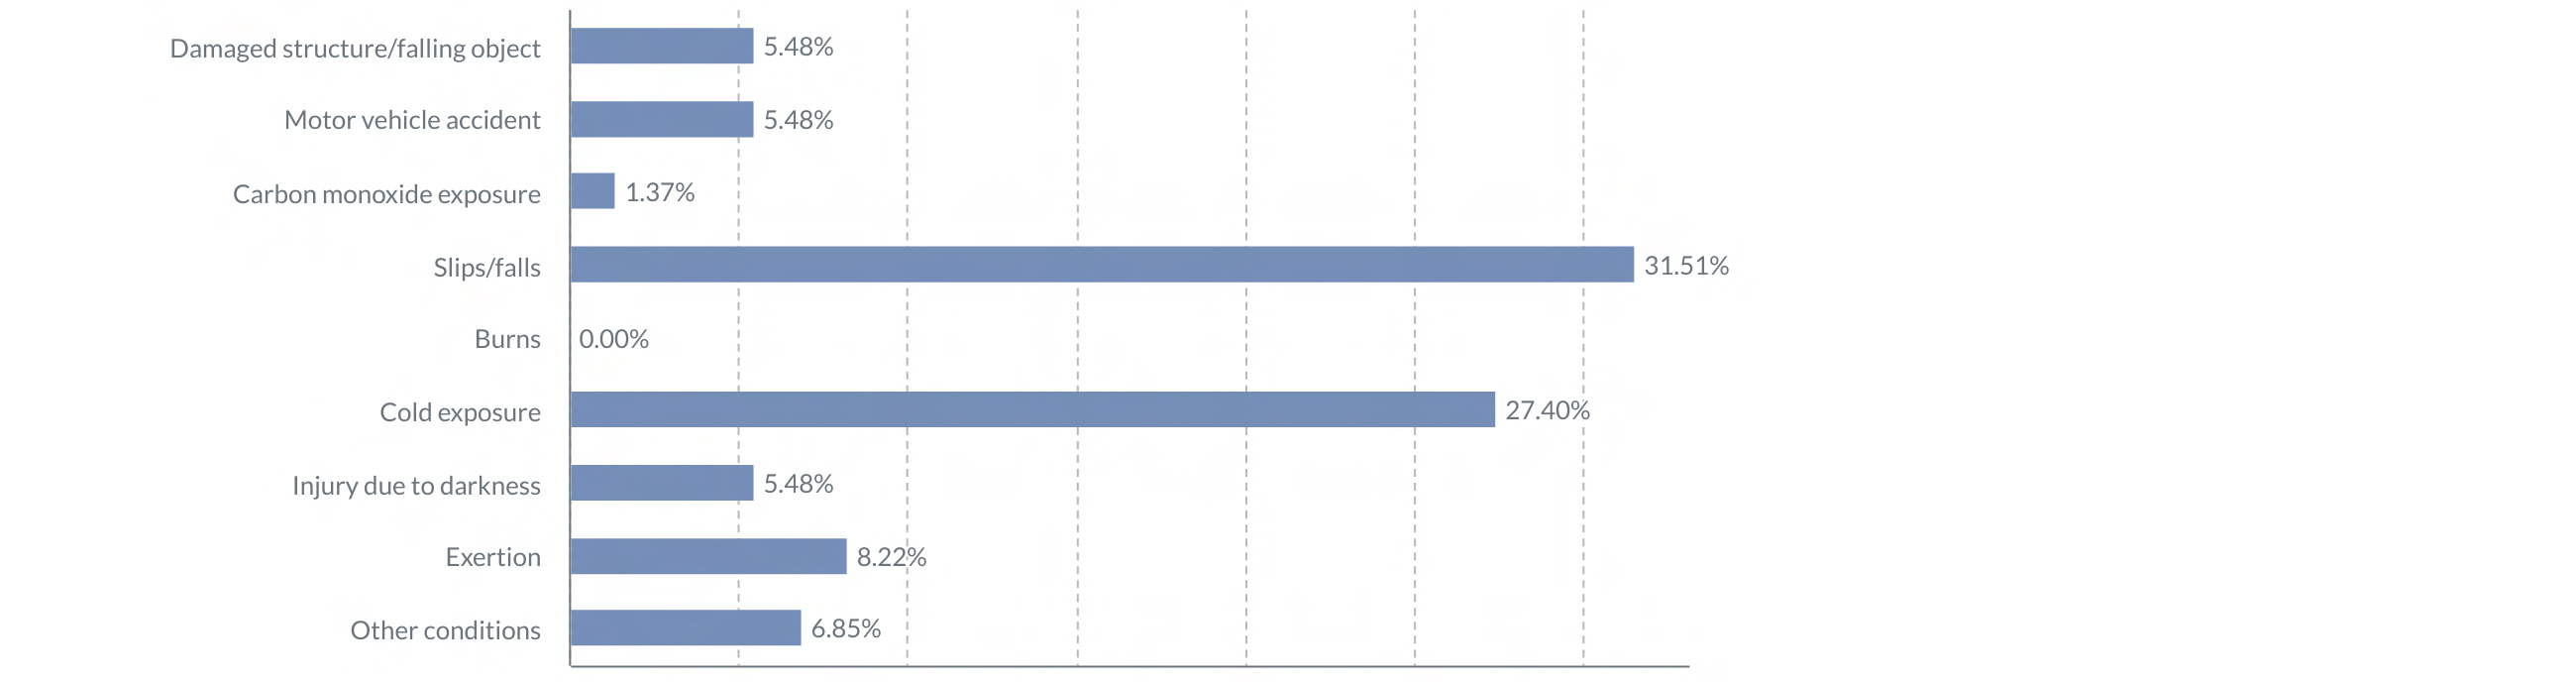
Figure 4 displays the percentage of respondents who experienced cold-related symptoms. The most frequent cold-related symptoms that respondents reported were shivering (48%), severe muscle stiffness (26%), and fatigue (23%). “Confusion/disorientation” (7%), “extremely cold/blue skin” (7%), and “loss of coordination” (6%) were the least frequent symptoms reported by the respondents. None of the respondents experienced dilated pupils during the winter storm.
Figure 4. Percentage of Respondents Experiencing Cold-Related Symptoms
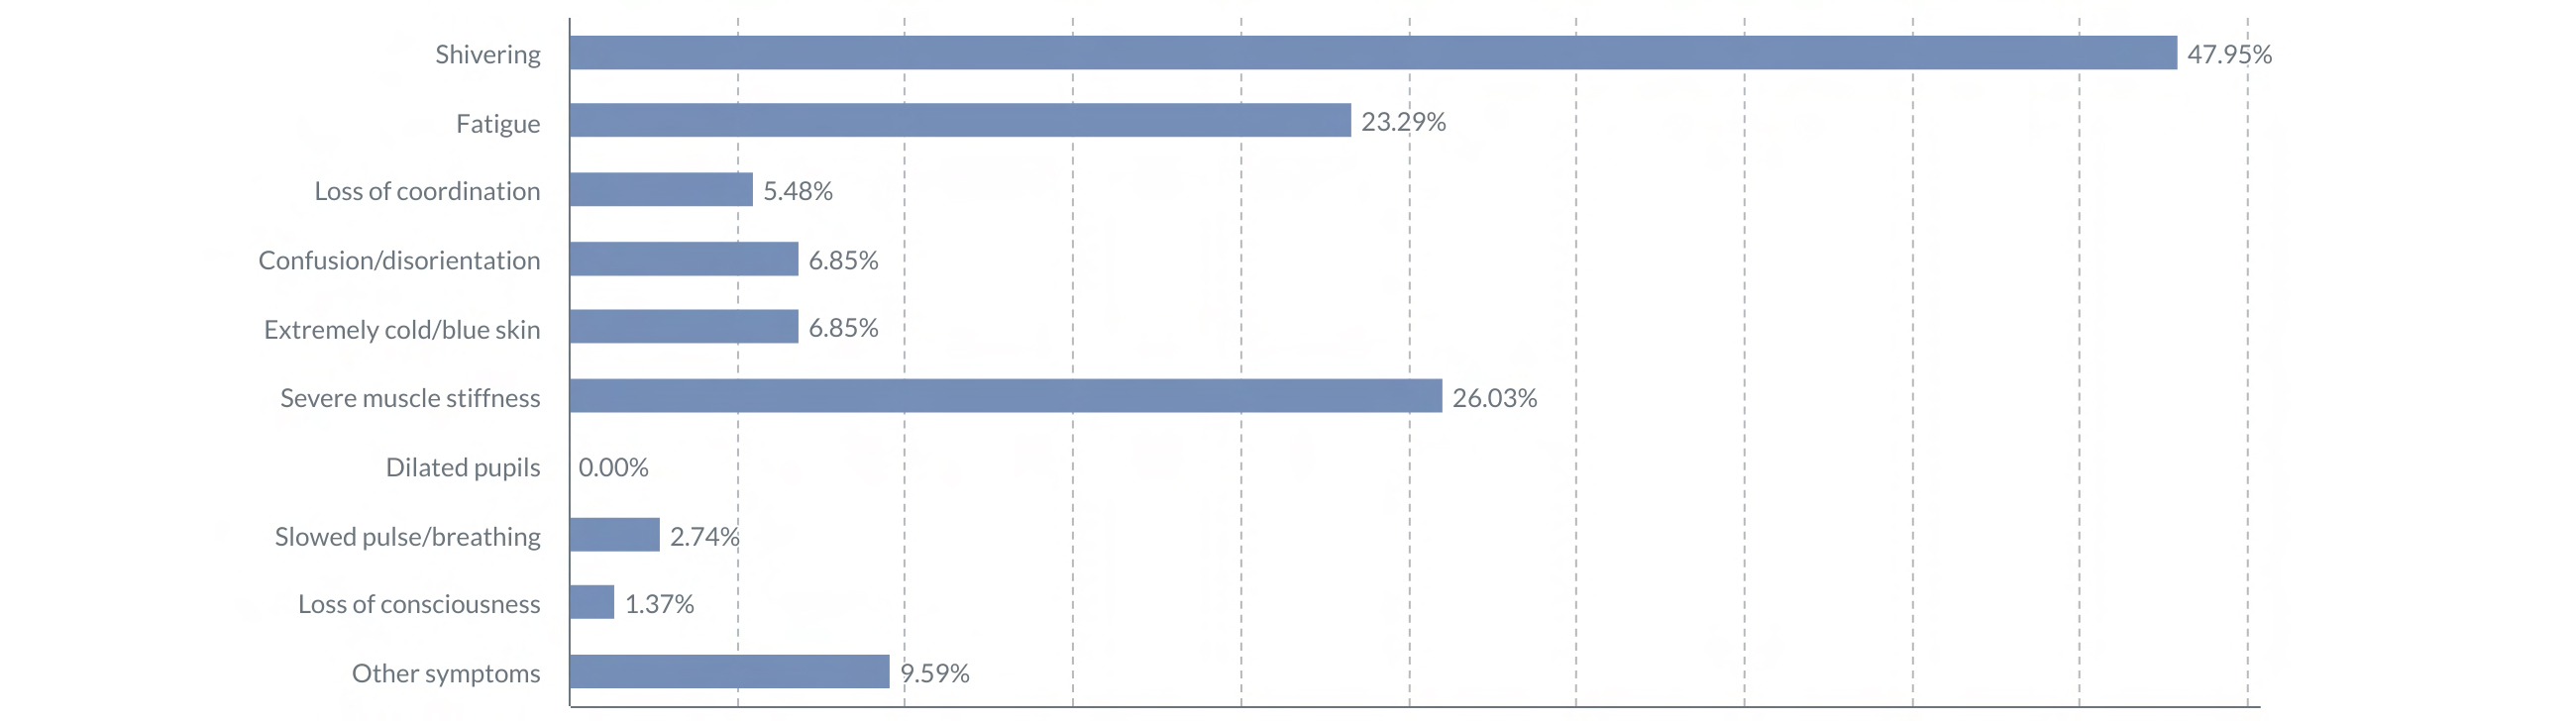
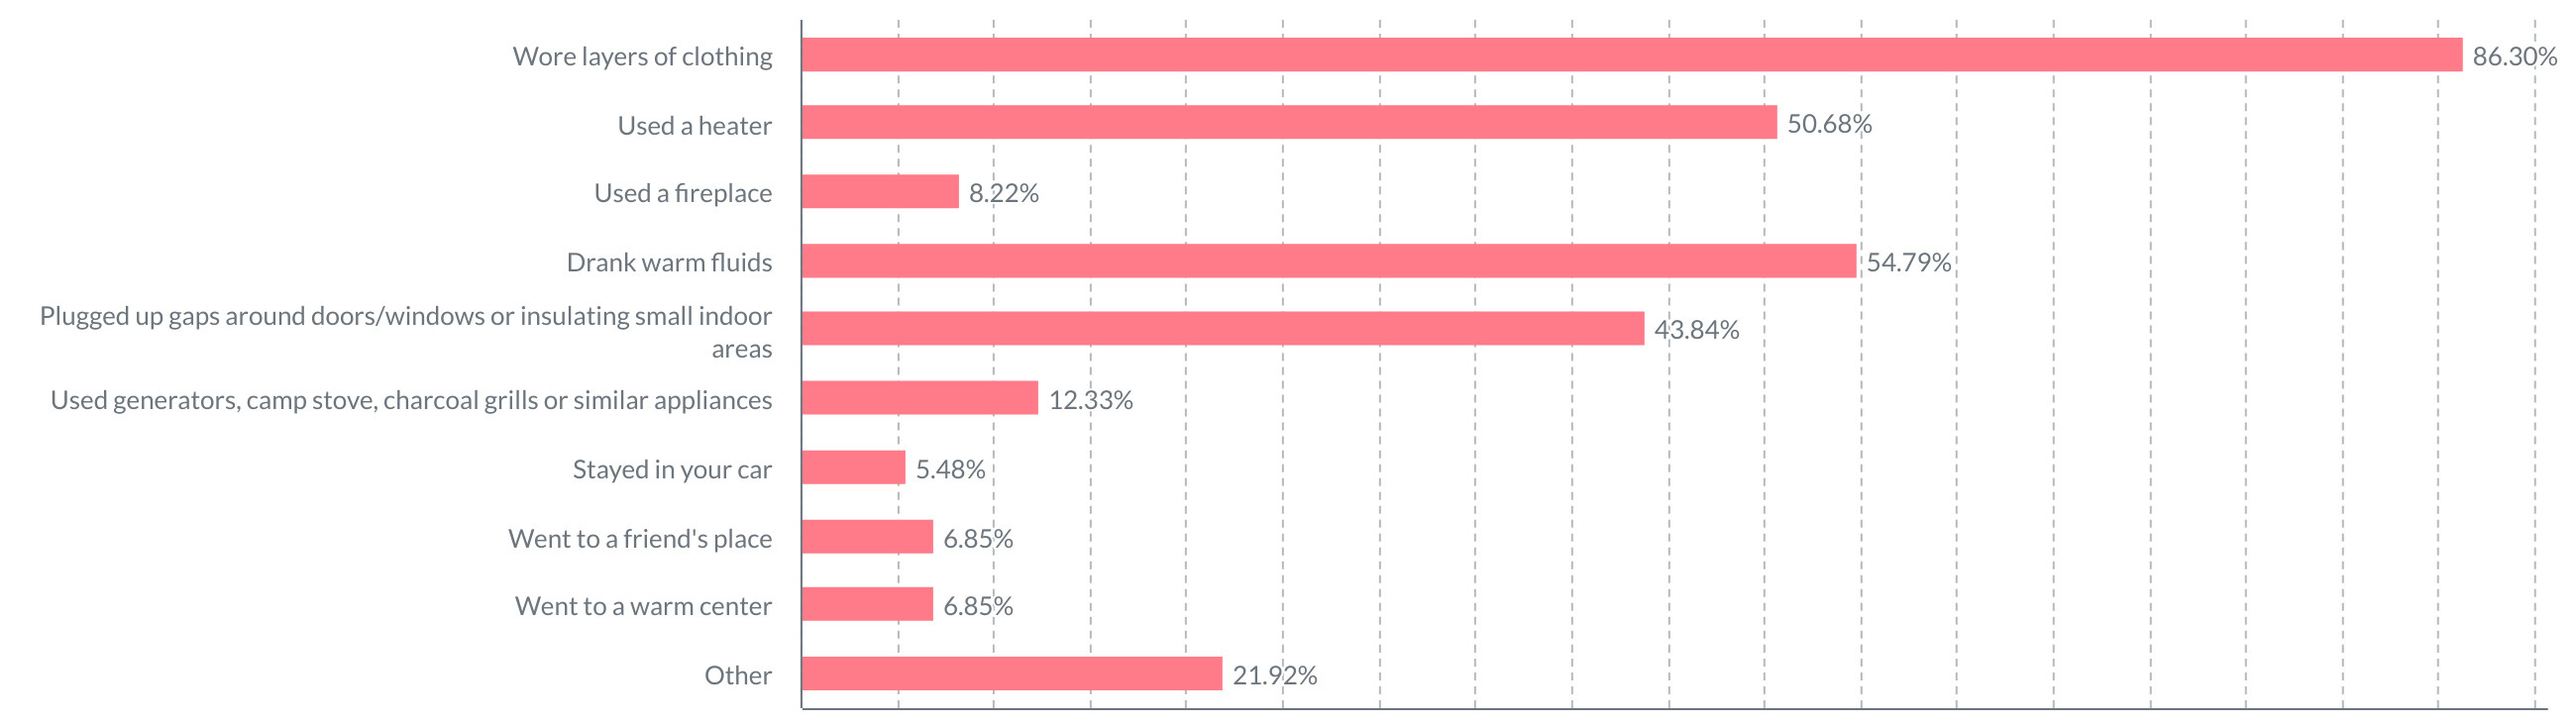
Figure 5 shows the percentage of respondents who employed different strategies to adapt to the extremely cold conditions. The strategies that respondents most frequently employed were “wore layers of clothing” (86%), followed by “drank warm fluids” (55%), “used a heater” (51%), and “plugged up gaps around doors/windows or insulated small indoor areas” (44%).
Figure 5. Percentage of Respondents Employing Cold Adaptation Strategies
Relationships Among Disaster Stressors, Cold-Related Symptoms and Injuries, and Physical and Social Infrastructure
Figure 6 depicts the results of bivariate correlation analysis measuring the correlation between respondents’ storm experiences, their housing and social infrastructure, and post-disaster health outcomes. It shows that the number of disaster stressors experienced by respondents was significantly positively correlated with their disaster-related injuries and cold-related symptoms but negatively related to the lowest room temperature reported. Meanwhile, the number of disaster-related injuries that respondents experienced was significantly negatively associated with their perceived quality of housing infrastructure, neighborhood belonging, and social cohesion, while cold-related symptoms were only significantly correlated to housing infrastructure. This suggested that good housing infrastructure and strong social cohesion may contribute to less health risks.
Figure 6. Bivariate Correlation Analysis of Disaster Experiences, Housing and Social Infrastructure, and Post-Disaster Health Outcomes
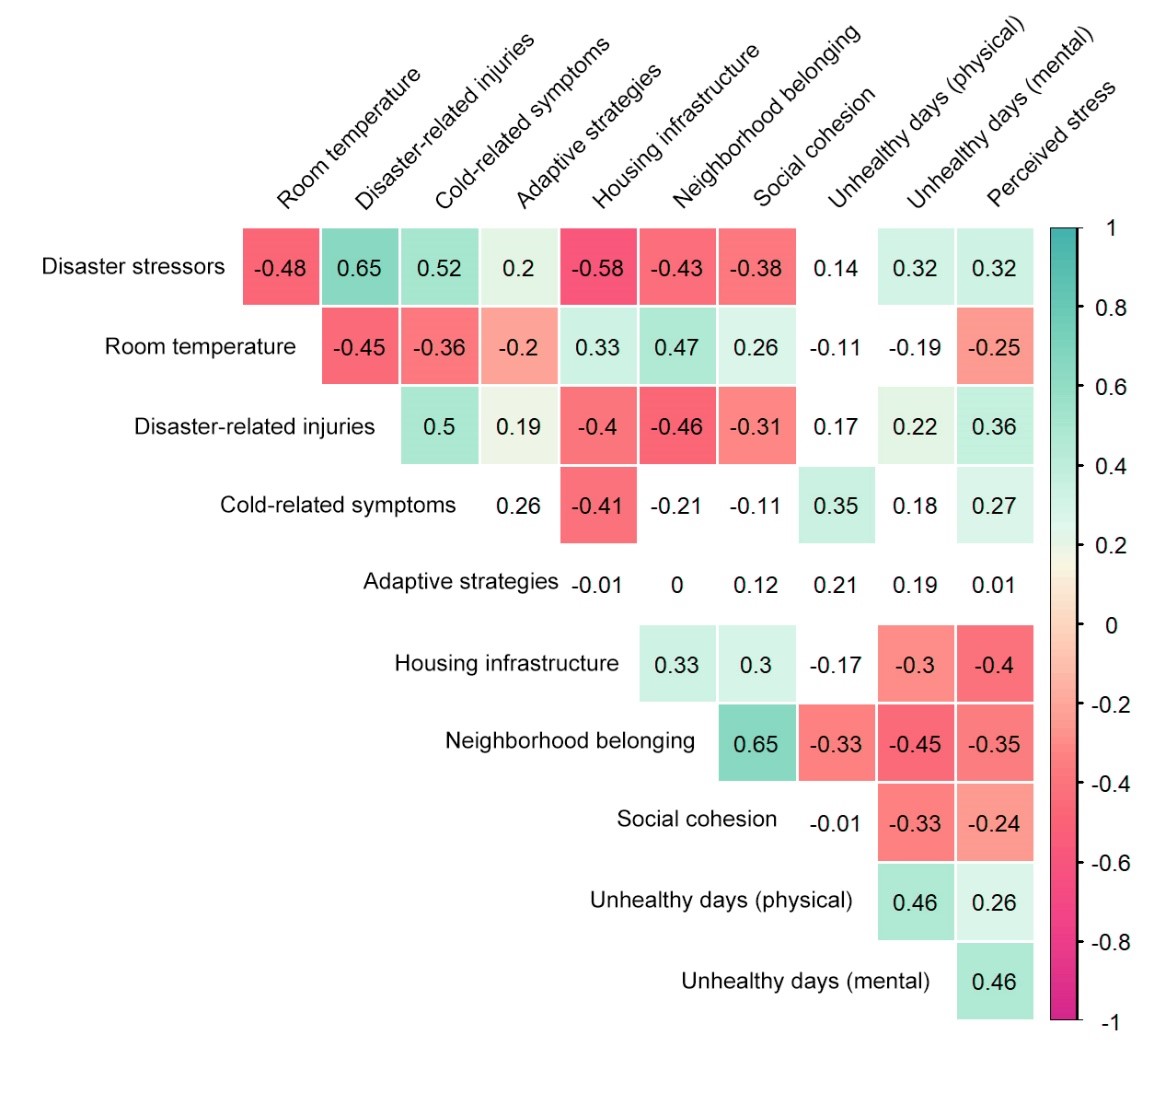
The number of adaptive strategies used is significantly related to disaster stressors, suggesting that those who suffered from more stressors and lower room temperature had to resort to more coping strategies, although the magnitude of the correlation is weak. However, surprisingly, adaptive strategies were unrelated to physical or social infrastructure. In the 2- to 5-month timeframe after the disaster, mental distress and perceived stress show stronger correlations with disaster experiences compared to physical health issues. For example, the number of mentally unhealthy days is positively correlated with disaster stressors and injuries and negatively correlated with housing infrastructure, neighborhood belonging, and social cohesion.
Factors Associated with Cold Sensation and Injuries
We fitted an ordinal logistic regression model to predict self-reported thermal sensation during the winter storm. The results showed that a strong predictor of thermal sensation was whether the household experienced a power outage. In addition, Hispanic residents reported lower thermal sensations compared to non-Hispanic residents. Participants who perceived their housing condition to be better and their neighborhoods to be more socially cohesive were likely to feel warmer, after adjusting for all other factors. See Table A3 in the appendix for full results.
Similarly, we fitted a logistic regression model to predict the likelihood of injury to self or family members during the winter storm. Racial and ethnic minorities again experienced more injuries compared to Whites. The immediate disaster stressors, such as power or water loss, were not significantly associated with injury. Better housing infrastructure was associated with a lower likelihood of injury. Table A4 in the appendix provides the full results.
Micrometeorological Conditions and Neighborhood Cold Stress
According to the outcomes of the Envi-met simulation, on February 15, 2021, the coolest time of day was 7:00; the warmest time of day was 15:00; and the coolest time of night was 00:00. During the winter storm, the air temperature dropped to approximately -10 °C at night, then slowly rose to -7 °C in the afternoon. Figure A1 in the appendix illustrates the inter- and intra-site variations in micrometeorological conditions at one of the coolest times of day during the storm.
We also tested human thermal sensations under two clothing conditions: light clothes and warm clothes. All three sites showed similar temporal trends, with an initial low occurring at the coolest time of day and peaking at the warmest time of day. Thermal values then decreased to a second low at midnight. Both PET and COMFA values—which measure the inflows and outflows of energy and the overall human thermal comfort—indicated that individuals in the normal clothing scenario experienced thermal sensations rated as “extreme cold stress” for most of the day, except a few hours in the afternoon when their thermal sensation was in the “strong cold stress” range. In contrast, wearing warm clothes greatly helped to mitigate colder conditions by reducing heat loss.
Buildings and Their Effects on Neighborhood Cold Stress
We further examined the relationship between cold stress and the presence and locations of buildings by presenting a simplified typology comprising eight zones surrounding a building: upwind (U1), downwind (D1, D2, D3, D4, and D5), left-hand side (90 degrees clockwise from downwind L1), and right-hand side (90 degrees clockwise from upwind R1). Over the interval represented by D1 to D5, as distance from measurement location to the building façade increased, both PET and COMFA decreased. We observed that 5 meters from the building, the thermal sensation was warmer in both the upwind (U1) and downwind (DI) directions, which suggested that the building would have the break effect to mitigate cold stress. For the downwind direction, as the distance to the building increased beyond 10 meters, these effects decreased. Figure A2 in the appendix depicts the results.
Discussion
Our results suggest that self-reported disaster stressors, thermal sensation, and the perceived physical and social infrastructure are interrelated. Among all residents in subsidized housing, Hispanic residents, those who reported losing power, and those with lower quality housing reported that they felt colder during the storm. African American and Hispanic residents and those in poor housing conditions suffered higher likelihood of disaster-related injuries. Overall, the results demonstrated that exposure to cold temperature from power outage represented the strongest predictor of cold stress and injuries, while minority residents were more susceptible to adverse health impacts, likely due to fewer resources and social vulnerability, and therefore suffered more during the storm. Although this study does not directly compare residents in subsidized housing with other types of neighborhoods, the systemic inequalities faced by these residents are likely contributing to their suffering, especially for the minority and lower-income groups.
The power loss caused dramatic room temperature decreases, which may be related to outdated infrastructure and thermal insulation in these neighborhoods and lack of preparation and adaptation resources. Our measure of adaptive strategies did not show expected relationships with cold stress or other health outcomes. One explanation for this may be that we measured adaptive strategies utilized by the residents, rather than the full range of resources or capacities available. Residents who did not experience storm-related stressors did not have the need to use any adaptive strategy, and thus they exhibited better health with lower adaptive strategies, while residents who experienced severe stressors showed better health when they used greater adaptive strategies.
The findings of the objectively simulated biometeorological conditions also confirmed that the thermal condition was “extremely cold” for most of the day during Winter Storm Uri, with an equivalent thermal sensation of below 6°C in the neighborhood. This level of cold stress is dangerous and can lead to an elevated risk of cold-related mortality for elderly adults if it persists for a prolonged period of time (Ruuhela et al., 201748). Other vulnerable groups, such as children, people with disabilities and chronic diseases, are also at risk when exposed to such cold stress.
Conclusions
Implications for Policy and Practice
The policy implications of these findings are evident. First, we recommend environmental modifications that improve the thermal performance of such housing units by adding wall and floor insulation, replacing old doors and windows, and installing energy efficient heaters. Such modifications could improve indoor thermal comfort during extreme cold weather and alleviate the financial burden related to utility costs. Also, it is essential to develop programs that provide vulnerable groups with necessities such as food, water, warm clothing, access to transportation and emergency medical assistance during extreme weather conditions.
This study also has implications for adaptive neighborhood planning and design policies that mitigate extreme cold conditions in disadvantaged neighborhoods. For example, the findings demonstrate that spatial variation in biometeorological conditions relate to the typology of buildings in the neighborhoods; accordingly, policymakers and designers should consider such downwind areas as safer spaces for outdoor activities. Regarding the mitigation design strategies, the windbreaks composed of trees could effectively reduce wind speed and consequently cold stress. At the same time, strategically located deciduous trees may be preferable, as they will provide shading in summer but allow solar radiation to penetrate through in the winter.
Limitations
This study focused on cold stress in the neighborhood, based on the assumption that the indoor temperature will continue to fall until it reaches similar levels to the outdoors during a prolonged power outage if there is no alternative heat source available. However, even if the air temperatures indoors and outdoors are similar, the effects of wind and solar radiation lead to different thermal conditions. Accordingly, future studies can expand on this work by utilizing indoor thermal stress models to evaluate cold stress indoors, which may show more pronounced relationships with cold-related morbidity and mortality outcomes.
Regarding the environmental intervention, this study mainly assessed the performance of trees as windbreaks; however, the contribution of such green infrastructure to a thermal environment depends on multiple factors, including height, crown characteristics, vegetation coverage ratio, and planting arrangement. More complex planting arrangements and factorial designs that consider the interactions of these parameters on thermal performance would further advance our knowledge. Moreover, the thermal performance of proposed scenarios under both summertime and wintertime extreme weather conditions needs to be thoroughly examined in further studies to develop integrated coping strategies for weather-related hazards.
References
-
School of Public Affairs University of Houston. (2021). The Winter Storm of 2021. ↩
-
Hellerstedt, J. (2021). February 2021 Winter Storm-Related Deaths – Texas. https://www.dshs.texas.gov/sites/default/files/news/updates/SMOC_FebWinterStorm_MortalitySurvReport_12-30-21.pdf ↩
-
Cutter, S. L. (2021). The changing nature of hazard and disaster risk in the Anthropocene. Annals of the American Association of Geographers, 111(3), 819-827. ↩
-
Gabbe, C., & Pierce, G. (2020). Extreme heat vulnerability of subsidized housing residents in California. Housing Policy Debate, 30(5), 843-860. ↩
-
Cutter, S. L., Boruff, B. J., & Shirley, W. L. (2003). Social vulnerability to environmental hazards. Social science quarterly, 84(2), 242-261. ↩
-
Curriero, F. C., Heiner, K. S., Samet, J. M., Zeger, S. L., Strug, L., & Patz, J. A. (2002). Temperature and mortality in 11 cities of the eastern United States. American journal of epidemiology, 155(1), 80-87. ↩
-
McMichael, A. J., Woodruff, R. E., & Hales, S. (2006). Climate change and human health: present and future risks. The Lancet, 367(9513), 859-869. ↩
-
Digenis-Bury, E. C., Brooks, D. R., Chen, L., Ostrem, M., & Horsburgh, C. R. (2008). Use of a population-based survey to describe the health of Boston public housing residents. American journal of public health, 98(1), 85-91. ↩
-
Ruel, E., Oakley, D., Wilson, G. E., & Maddox, R. (2010). Is public housing the cause of poor health or a safety net for the unhealthy poor? Journal of Urban Health, 87(5), 827-838. ↩
-
Lau, K. K.-L., Lindberg, F., Rayner, D., & Thorsson, S. (2015). The effect of urban geometry on mean radiant temperature under future climate change: a study of three European cities. International journal of biometeorology, 59(7), 799-814. ↩
-
Lai, D., Zhou, C., Huang, J., Jiang, Y., Long, Z., & Chen, Q. (2014). Outdoor space quality: A field study in an urban residential community in central China. Energy and Buildings, 68, 713-720. ↩
-
Mi, J., Hong, B., Zhang, T., Huang, B., & Niu, J. (2020). Outdoor thermal benchmarks and their application to climate‒responsive designs of residential open spaces in a cold region of China. Building and Environment, 169, 106592. ↩
-
de Dear, R. J., Leow, K., & Foo, S. (1991). Thermal comfort in the humid tropics: Field experiments in air conditioned and naturally ventilated buildings in Singapore. International journal of biometeorology, 34(4), 259-265. ↩
-
Sosa, M. B., Correa, E. N., & Cantón, M. A. (2018). Neighborhood designs for low-density social housing energy efficiency: Case study of an arid city in Argentina. Energy and Buildings, 168, 137-146. ↩
-
Wong, N., Feriadi, H., Lim, P., Tham, K., Sekhar, C., & Cheong, K. (2002). Thermal comfort evaluation of naturally ventilated public housing in Singapore. Building and Environment, 37(12), 1267-1277. ↩
-
Mahmoud, H. (2019). Effect of urban form on outdoor thermal comfort of governmental residential buildings: New aswan as a case study, Egypt. JES. Journal of Engineering Sciences, 47(3), 309-325. ↩
-
Paramita, B., Fukuda, H., Perdana Khidmat, R., & Matzarakis, A. (2018). Building Configuration of Low-Cost Apartments in Bandung—Its Contribution to the Microclimate and Outdoor Thermal Comfort. Buildings, 8(9), 123. ↩
-
Krebs, L., Johansson, E., Krebs, C., Fedrizzi, B., & Grala da Cunha, E. (2017). Influence of extensive green roofs to the local microclimate: Cooling assessment for a social housing project in the South of Brazil. Proceedings of PLEA 2017 Edinburg: Design to thrive, 2, 2880-2887. ↩
-
Lau, K. K.-L., Chung, S. C., & Ren, C. (2019). Outdoor thermal comfort in different urban settings of sub-tropical high-density cities: An approach of adopting local climate zone (LCZ) classification. Building and Environment, 154, 227-238. ↩
-
Huang, J., Chen, Y., Jones, P., & Hao, T. (2020). Heat stress and outdoor activities in open spaces of public housing estates in Hong Kong: A perspective of the elderly community. Indoor and Built Environment, 1420326X20950448. ↩
-
Nikolopoulou, M., & Lykoudis, S. (2006). Thermal comfort in outdoor urban spaces: analysis across different European countries. Building and Environment, 41(11), 1455-1470. ↩
-
Johansson, E. (2006). Influence of urban geometry on outdoor thermal comfort in a hot dry climate: A study in Fez, Morocco. Building and Environment, 41(10), 1326-1338. ↩
-
Mayer, H., & Höppe, P. (1987). Thermal comfort of man in different urban environments. Theoretical and applied climatology, 38(1), 43-49. ↩
-
Höppe, P. (1999). The physiological equivalent temperature – a universal index for the biometeorological assessment of the thermal environment. International Journal of Biometeorology, 43(2), 71-75. ↩
-
Cheng, V., Ng, E., Chan, C., & Givoni, B. (2012). Outdoor thermal comfort study in a sub-tropical climate: a longitudinal study based in Hong Kong. International journal of biometeorology, 56(1), 43-56. ↩
-
Lin, T.-P. (2009). Thermal perception, adaptation and attendance in a public square in hot and humid regions. Building and Environment, 44(10), 2017-2026. ↩
-
Gaspari, J., Fabbri, K., & Lucchi, M. (2018). The use of outdoor microclimate analysis to support decision making process: Case study of Bufalini square in Cesena. Sustainable Cities and Society, 42, 206-215. ↩
-
Gulyás, Á., Unger, J., & Matzarakis, A. (2006). Assessment of the microclimatic and human comfort conditions in a complex urban environment: modelling and measurements. Building and Environment, 41(12), 1713-1722. ↩
-
Liu, Z., Cheng, W., Jim, C. Y., Morakinyo, T. E., Shi, Y., & Ng, E. (2021). Heat mitigation benefits of urban green and blue infrastructures: A systematic review of modeling techniques, validation and scenario simulation in ENVI-met V4. Building and Environment, 107939. ↩
-
Bruse, M., & Fleer, H. (1998). Simulating surface–plant–air interactions inside urban environments with a three dimensional numerical model. Environmental modelling & software, 13(3-4), 373-384. ↩
-
Yang, Y., Gatto, E., Gao, Z., Buccolieri, R., Morakinyo, T. E., & Lan, H. (2019). The “plant evaluation model” for the assessment of the impact of vegetation on outdoor microclimate in the urban environment. Building and Environment, 159, 106151. ↩
-
Srivanit, M., & Jareemit, D. (2020). Modeling the influences of layouts of residential townhouses and tree-planting patterns on outdoor thermal comfort in Bangkok suburb. Journal of Building Engineering, 30, 101262. ↩
-
Semer, M., Zimmerman, J., Foard, A., & FRANTZ, J. (1976). A review of federal subsidized housing programs. Housing in the Seventies Working Papers, 82-144. ↩
-
Li, D., Zhang, Y., Li, X., Meyer, M., Bazan, M., & Brown, R. (2023). “I didn't know what to expect or What to do”: Impacts of a severe winter storm on residents of subsidized housing in Texas. International Journal of Disaster Risk Reduction, 84, 103456. ↩
-
Li, X., Zhang, Y., Li, D., Xu, Y., & Brown, R. D. (2022). Ameliorating cold stress in a hot climate: Effect of Winter Storm Uri on residents of subsidized housing neighborhoods. Building and Environment, 209, 108646. ↩
-
Harville, E. W., Jacobs, M., & Boynton-Jarrett, R. (2015). When is exposure to a natural disaster traumatic? Comparison of a trauma questionnaire and disaster exposure inventory. PLoS One, 10(4), e0123632. ↩
-
Raker, E. J., Zacher, M., & Lowe, S. R. (2020). Lessons from Hurricane Katrina for predicting the indirect health consequences of the COVID-19 pandemic. Proceedings of the National Academy of Sciences, 117(23), 12595-12597. ↩
-
Centers for Disease Control and Prevention. (2018). Cold Stress - Cold Related Illnesses. Retrieved February 25, 2021 from https://www.cdc.gov/niosh/topics/coldstress/coldrelatedillnesses.html ↩
-
Sugg, M. M., Stevens, S., & Runkle, J. D. (2019). Estimating personal ambient temperature in moderately cold environments for occupationally exposed populations. Environmental research, 173, 497-507. ↩
-
Broder, J., Mehrotra, A., & Tintinalli, J. (2005). Injuries from the 2002 North Carolina ice storm, and strategies for prevention. Injury, 36(1), 21-26. ↩
-
Geehr, E. C., Salluzzo, R., Bosco, S., Braaten, J., Wahl, T., & Wallenkampf, V. (1989). Emergency health impact of a severe storm. The American journal of emergency medicine, 7(6), 598-604. ↩
-
Hartling, L., Pickett, W., & Brison, R. J. (1999). The injury experience observed in two emergency departments in Kingston, Ontario during ‘Ice Storm 98’. Canadian journal of public health, 90(2), 95-98. ↩
-
Fone, D. L., Farewell, D. M., & Dunstan, F. D. (2006). An ecometric analysis of neighbourhood cohesion. Population health metrics, 4(1), 1-17. ↩
-
Centers for Disease Control and Prevention. (2001). Measuring healthy days: Population assessment of health-related quality of life. ↩
-
Cohen, S., Kamarck, T., & Mermelstein, R. (1983). A global measure of perceived stress.* Journal of health and social behavior*, 385-396. ↩
-
Brown, R. D., & Gillespie, T. J. (1986). Estimating outdoor thermal comfort using a cylindrical radiation thermometer and an energy budget model. Int J Biometeorol, 30(1), 43-52. https://doi.org/10.1007/BF02192058 ↩
-
Teshnehdel, S., Akbari, H., Di Giuseppe, E., & Brown, R. D. (2020). Effect of tree cover and tree species on microclimate and pedestrian comfort in a residential district in Iran. Building and Environment, 178, 106899. ↩
-
Ruuhela, R., Jylhä, K., Lanki, T., Tiittanen, P., & Matzarakis, A. (2017). Biometeorological assessment of mortality related to extreme temperatures in Helsinki region, Finland, 1972–2014. International journal of environmental research and public health, 14(8), 944. ↩
Li, D., Brown, R., Xu, Y., Zhang, Y., & Li, X. (2023). Assessing the Impacts of Winter Storm Uri in Subsidized Housing Developments (Natural Hazards Center Quick Response Research Report Series, Report 355). Natural Hazards Center, University of Colorado Boulder. https://hazards.colorado.edu/quick-response-report/assessing-the-impacts-of-winter-storm-uri-in-subsidized-housing-developments