Evacuation Behavior Measured at Time of Expected Hurricane Landfall: An Assessment of the Effects of Social Networks
Publication Date: 2015
Introduction and Review of Literature
The purpose of this project was to examine the structural and functional components of social support and connectedness, and their relationship to evacuation behaviors during a hurricane evacuation. Two main groups were surveyed in this study: 1) individuals who chose to evacuate and leave the area threatened by a landfalling hurricane (i.e., rest Area group referred to as evacuees); and, 2) individuals who chose not to evacuate but instead sheltered within their respective homes or went to a local shelter (i.e., non-evacuees). Specifically, the density, diversity, and dependability of social support and connections were examined to understand their influence on the decision of whether to evacuate the geographic area threatened by a hurricane predicted to make landfall. This study has important implications for adding to the knowledge base on community-based sustainable disaster preparedness and resilience.
The impact of major hurricanes striking the U.S. has redirected attention to examining the influence of social support and social connections in prompting individuals and families to evacuate when a storm warning is issued (Dash and Gladwin 20071; Gladwin, Gladwin and Peacock 20012; Haines, Beggs, and Hurlbert 20023; Whitehead et al. 20004). The devastating impact—particularly of Hurricane Katrina on the city of New Orleans and surrounding Gulf Coast communities—heightened the need for advanced knowledge in the way social connections function, especially for vulnerable populations who have become socially and economically marginalized (Cutter, Boruff, and Shirley 20035; Moore et al. 20046; Real 20077). As a result, understanding the influence of social connectedness and social support on evacuation behavior remains relevant for disaster mitigation and preparedness planning.
Vulnerability research encompasses geophysical processes, as well as social and economic factors (Cutter and Finch 20088; Tobin and Montz 19979; Wisner et al. 200410). Wisner et al. (200411) define vulnerability as “the characteristics of a person or group and their situation that influence their capacity to anticipate, cope with, resist and recover from the impact of a natural hazard” (11). This conceptualization of vulnerability shifts attention to the role social connections and supports play in buffering people, processes, and places when confronted with exposure to a natural hazard. Much of this thinking is incorporated into the well-known “Pressure and Release” Model (PAR) developed by Wisner et al. which identifies various social and geophysical pressures believed to heighten the level of vulnerability for individuals and communities, thereby contributing to a disaster.
As the research literature on the function of social connectedness within a context of natural disasters continues to emerge, we have gathered empirical evidence on the utility of social ties in buffering pathogenic stressors (Caplan 197412; Sarason and Sarason 198513) to inform our conceptual framework for this study. Indeed, several studies have noted that the number and diversity of social connections affect people’s health so that those whose spouses, friends and family members provide psychological and material resources are in better health than those with fewer social support structures (Broadhead et al. 198314; Leavy 198315; Mitchell, Billings, and Moos 198216). Similar studies suggest an inverse correlation with mortality such that mortality is greater among persons with relatively low levels of social support (Berkman and Syme 197917; House, Robbins, and Metzner 198218). For the purpose of our work we seek to consider the role that social support and social connectedness have on people’s evacuation decision making. We draw on the work of Cohen and Wills (198519) who note that social supports act to “buffer” (protect) persons from potentially pathogenic influences of stressful life events. Likewise, we argue that supportive functional social connections may buffer people from the deleterious impact of a hurricane. We see applicability in Cohen and Wills’ (1985) work, since their definition of stress closely links appraised stress with feelings of helplessness, which one may also see in a landfalling hurricane situation (312).
Cohen and Wills (1985) discuss both structural and functional measures of social integration and note that while the former assesses the existence of relationships, it falls short of measuring “the functions actually provided by those relationships” (314). They further note low correlations reported in other studies (e.g., Barrera 198120; Cohen et al. 198221) between the number of social connections and functional support since “adequate functional support may be derived from one very good relationship, but not be available to those with multiple superficial relationships” (Cohen and Wills 1985, 31522). Cohen et al. (1985) recommend further study of the functional domain of social support, particularly tangible resources that an individual can depend on in coping with an impending stressor and the utility of social supports within other contexts.
Lakey and Cohen (200023) suggest that social supports buffer a stressor to the extent that the type of support adequately meets the demand of the stressor. Therefore, it is important to examine the diversity of one’s social connections and the function or dependability of the support available. Miller (200724) acknowledges the important role of diverse formal and informal social connections in sharing information and establishing trust during evacuations stemming from Hurricanes Katrina and Rita. Both the number of contacts and the range of contacts across different contexts (e.g., faith-based, school, work, etc.) aided in the evacuation process in East Texas.
In some cases, the density or closeness of social connections and ties with individuals who share similar social and economic characteristics has been shown to provide increased sources of support during a natural hazard (Haines et al. 20023; Haines and Hurlbert 199225). Social isolation stemming from a lack of connectedness with social supports was found to contribute to one’s vulnerability as suggested by the demographic profile of those who did not evacuate during Hurricane Katrina (Brinkley 200626). Likewise, social connections deemed to be weaker or less dense, but providing greater network diversity, suggest increased access to resources which are harder to obtain (Granovetter 197327; Unger and Powell 198028).
How social connections are utilized to influence hazard evacuation behavior remains a critical component for the development of disaster resilience models as part of mitigation and preparedness planning (Buckle 200629; Dynes 200230). Dynes (2002) posits that “social networks provide the channels whereby individuals develop a perception of risk and can be motivated to take some type of preventative action” (18). While social supports are intuitively thought to play a pivotal role in disaster preparedness and decision-making (Mathbor 200731), a paucity of studies on the topic provides mixed results with regard to hazard evacuations (Dynes 2002; Riad and Norris 199832). Therefore, it remains uncertain just how informal supports and social connections are used to arrive at a decision to leave or stay, and whether the process varies in relation to certain social and economic characteristics of individuals and their communities (Moore et al. 20046).
Based on this literature, we propose the following hypotheses with regard to evacuation status related to Hurricane Matthew in October, 2016: 1. People who evacuated out of their county will have a significantly larger number of social connections (i.e., more dense), than those who did not evacuate. 2. People who evacuated out of their county will have significantly closer social connections (i.e., more dense) than those who did not evacuate. 3. People who evacuated out of their county will have significantly more varied types of social connections (i.e., more diverse) than those who did not evacuate. 4. People who evacuated out of their county will have significantly more functionally supportive social connections (i.e., more dependable ) than those who did not evacuate. 5. There is a positive correlation between social class and dependability of social connections (i.e., functional support).
Figure 1 depicts the conceptual framework that guided this study. Individual characteristics such as ethnicity, gender, age, income, and education often shape the number and types of social connections formed between people and groups. In this study, we operationalize social connections according to three dimensions: density, diversity, and dependability. Each dimension is assessed from high to low using two validated instruments. Social connection density refers to the number of social ties and the closeness of those relationships. Social connection diversity measures the variety of social relationships (e.g., within and outside the family). Social connection dependability assesses the perceived functional nature of the social relationship to determine any tangible type of support or resource available. All three social connection and support dimensions are posited to influence behavior examined in this study. Solid arrows in the figure illustrate our deconstruction of social connectedness into the three key dimensions mentioned above. These dimensions are posited to influence evacuation behavior. Dashed arrows indicate the possible outcomes resulting from evacuation decision-making.
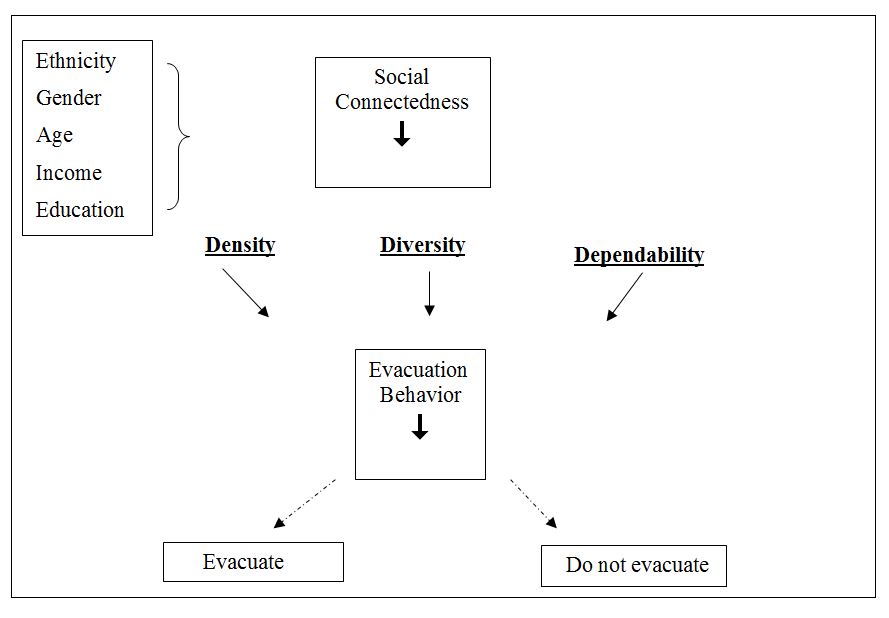 Figure 1. Conceptual Framework
This conceptual framework provides flexibility for exploring additional outcomes beyond the original hypotheses developed for this study. We anticipate using data collected on the dimensions of social connection to develop a predictive model to determine the core variables that account for the greatest amount of variation between the two groups. We will also examine interactions among the dimensions of density, diversity, and dependability to further inform our knowledge building. Results from this study will allow us to refine the conceptual model, thus providing an extended opportunity to further understand the role of social connections and supports as a tool for sustainable disaster preparedness.
Methodology
A team of seven data collectors deployed to areas identified through the National Weather Service to be in the path for the landfall of Hurricane Matthew in early October 2016. Training on real-time in-field data collection methods was provided to members of the research team. This included adherence to safety precautions inherent to collecting survey data. In addition, all project personnel completed required Institutional Review Board (IRB) training in human subjects protection. Face-to-face surveys were administered, with research team members interviewing volunteer participants and recording their responses. In order to collect data from both evacuees and non-evacuees, the team deployed to several locations between central Florida and the eastern coast of Florida near Titusville and Daytona.
Study Area
Although there has been a “drought” for the last 10 years in terms of landfalling hurricanes in Florida, this luck ran out on October 7th, 2016. On this date, a Florida population who hadn’t experienced an evacuation for many years—or who perhaps recently moved to the state— witnessed Hurricane Matthew. Cutter et al. (200724) acknowledge the importance of recognizing Florida’s heightened vulnerability due to increased coastal population. Due to Florida’s long peninsula, there are limited choices in evacuation routes. Dow and Cutter (200233) note considerable traffic pressure during an evacuation. Based on knowledge of previous evacuations, there are a number of choke-points on the highways where cars are typically jammed for hours. The Tampa Bay Regional Planning Council (TBRPC 200634) note some critical roadway segments. This study took advantage of this congestion as people often frequented rest-stops. The surveys of evacuees were conducted at a westbound rest stop on I-4 in Polk County, Florida on October 5th and October 6th. Surveys of non-evacuees were conducted at a Home Depot in the city of Titusville on October 8th and a Walmart Neighborhood Market in Daytona Beach on October 9th. Several key organizations assisted in our ability to collect data in the field during this hurricane evacuation, including the Florida Department of Transportation (Patrick Odom: Traffic Incident Management and Road Ranger Program Manager), and National Weather Service (NWS) (Charles Paxton) prior to team deployment.
Survey
The 10-15 minute survey instrument constructed for this study consisted of 62 items that gathered data on the socio-demographics of the interviewee (including age, gender, ethnicity, income, and years of education). In addition, the survey asks about previous and current hurricane evacuation experiences; factors that influence evacuation decision-making (e.g., access to a vehicle, pet ownership); and the density, diversity, and dependability of social connections. The instrument was administered face-to-face as a paper and pencil questionnaire with trained data collectors asking questions and recording responses (Figure 2).
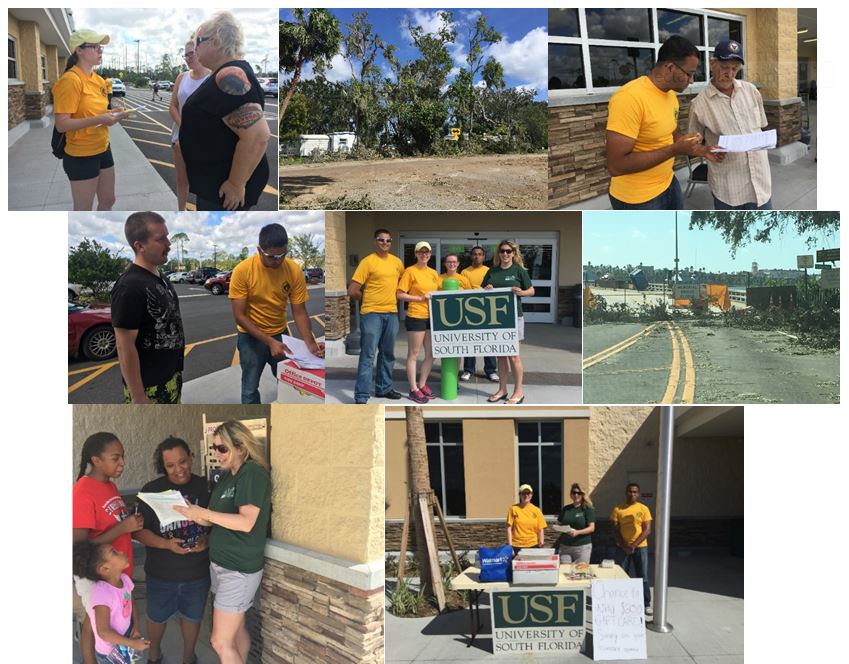 Figure 2. Photos of some team members completing surveys and photos depicting some local damage and road closure in Daytona.
The survey was anonymous, with no personal identifiers. Eligible participants had to be 18 years of age or older and a current Florida resident. Versions of the survey were also available in Spanish, Haitian Creole, and French languages. A significant portion of the survey incorporates two distinct and well-published questionnaires related to research on social ties and networks, which are described below.
Berkman-Syme Social Network Index (B-SSNI).
The B-SSNI (Berkman and Syme 197917) provides a measure of the diversity and density of an individual’s social connections. We use the SNI to assess the type, size, closeness, and frequency of contacts in a respondent’s current social network. This 11 item instrument is a composite measure of several types of social connections: sociability (number and frequency of contacts with close relatives and close friends); church group membership; and membership in other community organizations.
Interpersonal Support Evaluation List (ISEL).
The ISEL (Cohen and Hoberman 198335) provides a measure of the functional component of social supports. Cohen and Syme (198519) refer to social supports as those resources that can be offered by other individuals to provide aid or assistance. We use the ISEL to assess the perceived dependability (or functionality) of an individual’s social networks. The 40 item general population version of the ISEL is divided into four subscales. For the purpose of our study, the “Tangible Subscale” was used, incorporating 10 items to assess a specific form of support the respondent believes can be obtained from his/her social support network. For example: “If I needed a ride to the airport very early in the morning, I would have a hard time finding someone to take me.” Each item is rated on a four-point Likert scale with anchors ranging from “definitely true” to “definitely false.” Some items are indicated to be reverse scored. Cohen and Wills (198519) report the ISEL to have excellent internal consistency and good test-retest reliability.
Data Collection Procedures
Most studies examining evacuation behavior have been conducted post-storm or post- storm season. An important limitation to such studies is that survey participants may be affected by “memory decay” in considering their past actions and factors that influenced their decisions (Stallings 200236). Memories change with the passage of time, so the timing of research with people in relation to their hurricane experiences and evacuation decisions is critical. In this study, we avoid this problem as the data were collected for an expected landfalling hurricane immediately as evacuation commenced, by interviewing evacuees at an Interstate rest-stop. The I-4 location allowed us to collect data from evacuees as they came from the east coast of Florida inland towards the west coast primarily. In addition, data were collected on non-evacuees immediately after the storm passed. This methodology of collecting real-time or near-real-time data will likely provide more accurate results than previous studies, since people are more likely to remember the intricacies of their decisions, allowing us to gain useful insights. The team also captured different waves of the evacuation as some people evacuated earlier than others.
Due to the real-time conditions under which data were gathered, we used a convenience sampling method for this study. We recognize that this is a limitation of our study in that we will not be obtaining a random sample. In her analysis of 225 disaster studies, Norris (2006) stresses the prevalence of convenience samples. It is necessary that the sample be representative in order to make inferences about the population at large. Norris (200637) notes that for the studies that used convenience sampling, over half of the samples were highly or at least moderately representative of their respective populations. Ideally, one would conduct the study using a random sampling method to ensure normalcy and representativeness. However, this is impractical and unrealistic under the conditions at the time of evacuation. Convenience samples do have limitations regarding inferences made to the broader population (Anderson 200138; Herek 200839).
In this context, we considered some parameters which enabled us to obtain as representative a sample as possible. For example, an immediate question of the participant at the rest-area was to discover if they are travelling with family or friends in more than one car. If so, we excluded them from the survey as there was a chance that we could also interview another family member in another car and break the rule of independence required for a representative sample.
The questionnaire had been pilot tested in English and Spanish to assure clarity of questions. In addition, a successful pilot study was conducted in the summer of 2009 at a rest-stop along I-75 to assess past and intended evacuation behavior. We acknowledge that this is a different scenario than the real-time evacuation situation; however, this population still had differing levels of social ties. It was noted that people had difficulty recalling who had helped them in the past evacuations and what kind of help they received. Hence, we found this prior testing supported our research methodology to conduct this project at the time of an actual evacuation.
Prior to the pre-test, a preliminary study was conducted to confirm that the measure of social ties was reasonable to use for the current study. To establish this, the questions that examine social ties were presented to University of Southern Florida (USF) experts in the field of hazards (colleagues in the former Geography Department) and test development (statisticians), and question items were evaluated for face and content validity. The experts had the opportunity to eliminate survey questions if they determined that the questions reflected content differing from what the research questions are trying to measure (e.g., see Lunsford 200140).
Data Analysis Techniques
Data collected for this study were coded and cleaned, and preliminary univariate analyses were conducted. All statistical analyses used SPSS Version 23. Locational data were geocoded and mapped for analyses using ArcGIS 10.3. Our statistical analyses focused on independent t-tests to examine evacuation status compared to each measure (i.e., density, diversity, and dependability) to determine significant differences. We used Mann-Whitney U tests to compare sources of information participants relied on to inform their evacuation status, and the degree to which they relied on them. A Spearman’s correlation was conducted in order to determine the correlation between dependability of social connections and social class (as measured by income and education).
Preliminary Results
Sample Size and Characteristics
The team collected a total of 132 surveys, 15 of which were incomplete (participants withdrew mid-survey). Those surveyed included 15 early evacuees on October 5th, 47 later evacuees on October 6th, 17 Titusville non-evacuees on October 8th, and 53 Daytona non-evacuees on October 9th. For the purpose of analyses, due to the small sample size particularly on a couple of the days, the groups were combined to create 63 evacuee surveys and 70 non-evacuee surveys. There was a rejection rate of 65%—people not willing to complete the survey—possibly due to the rush of prepping for the incoming storm or repairing damage post-storm. Despite this high rejection rate, we had many people willing to take our survey. The demographics of the total survey group are displayed below in Tables 1-5, with 999 representing missing data. As shown in these tables, the majority of people were between 18-64 years of age (78.8%); female (51.5%); white (67.4%); had completed a college degree (47.7%); and reported annual incomes of $80,000 or higher (23.5%).
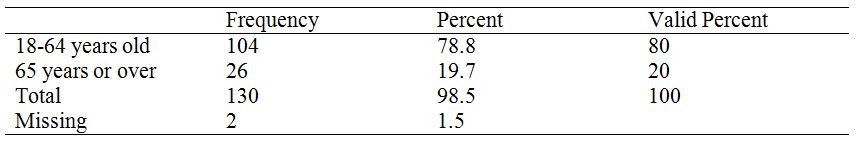 Table 1. Age Frequencies
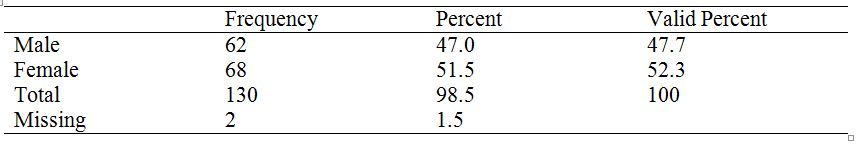 Table 2. Gender Frequencies
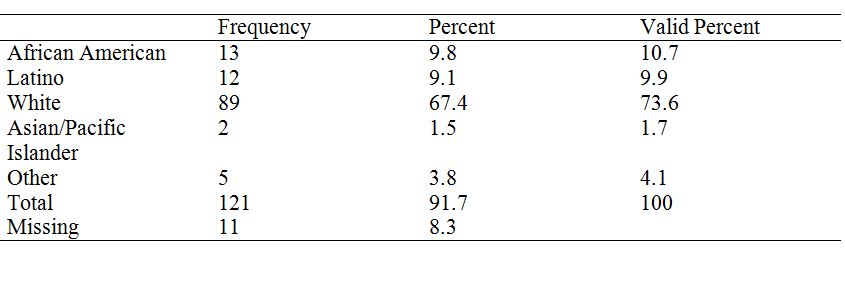 Table 3. Ethnicity Frequencies
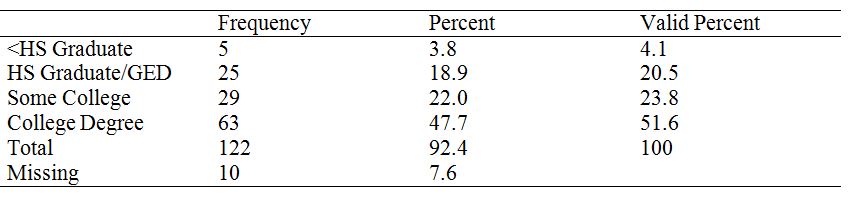 Table 4. Education Frequencies
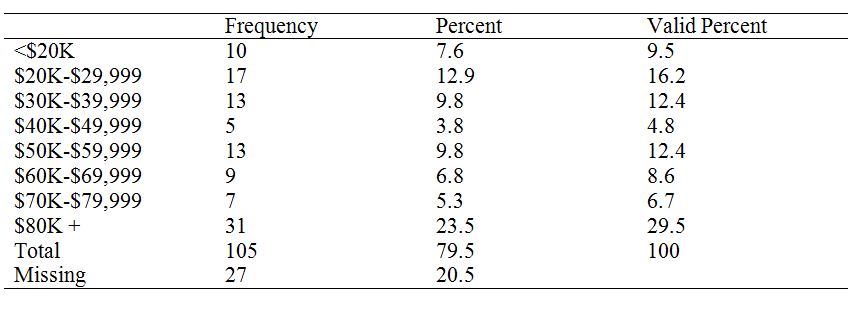 Table 5. Income Frequencies
Evacuees vs. Non-evacuees
When examining evacuees compared to non-evacuees using an independent t-test (Table 6), the B-SSNI which looked at density with regard to how many people are found in their networks and how close they are (Hypothesis 1 and Hypothesis 2, respectively) and diversity (Hypothesis 3) showed no significant differences between evacuees and non-evacuees. Therefore, the null hypothesis is not rejected. However, when examining evacuees compared to non-evacuees, dependability of networks (Hypothesis 4), as noted through the ISEL index, proved to be significant (<0.05). Therefore, the null hypothesis is rejected as there was a difference between evacuees and non-evacuees for dependability scores. Figure 3 shows the mean scores for dependability between the two groups (evacuees and non-evacuees). Evacuees have a lower mean score than non-evacuees—the lower the score, the less dependable they perceive their networks. The non-evacuees had a higher score than evacuees, meaning that they felt they could depend on their networks. This would likely explain why they ‘hunkered down,’ feeling secure with the people around them. The Mann-Whitney U test—which looked at evacuees and non-evacuees and whether they relied on family far away (50 miles or more) for information which influenced their decision to evacuate or not—showed a significant (<0.05) relationship, again supporting the previous conclusion (U= 1612.5, p = .023).
When examining the results from Hypothesis 5, which examined the correlation between dependability and social class based on income, the Spearman’s rho indicated a weak to moderately significant relationship (rs = 0.249, p = .011). When examining the correlation between dependability and social class based on education, the Spearman’s rho showed a weak significant relationship (rs = 0.186, p = .041).
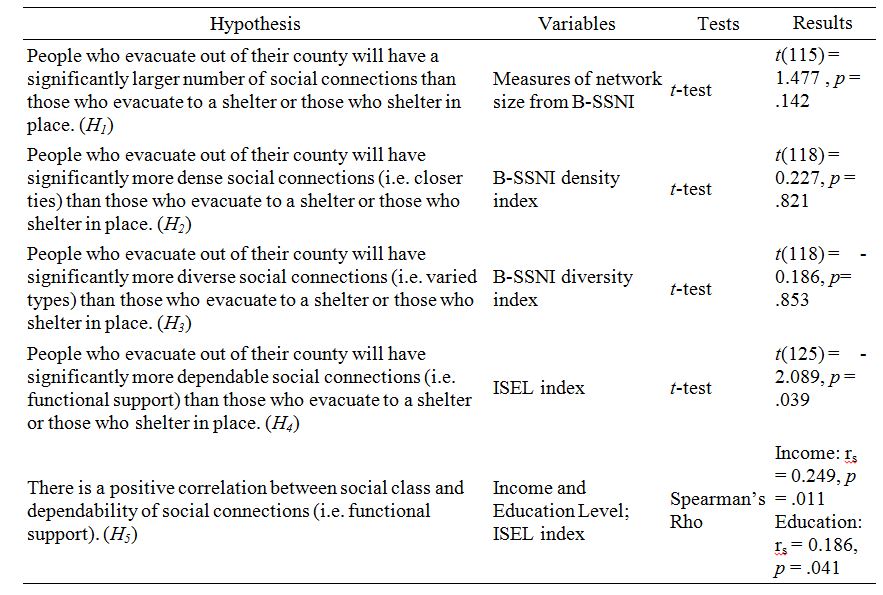 Table 6. Hypotheses, variables, tests and results.
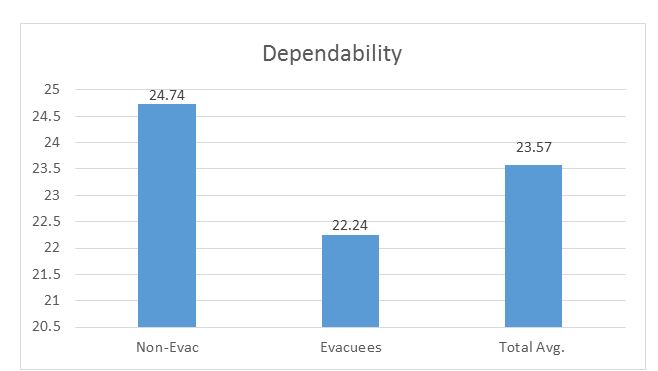 Figure 3. t-test of evacuation status compared to dependability score.
Other results from the Mann-Whitney U test analyses showed that when examining evacuation status (non-evacuees and evacuees) and sources of information that people relied upon in their decision to evacuate or not, radio broadcasts (U= 1558.5, p = .010); government officials (U= 1357.5, p = .000); family far away (U= 1612.5, p = .023); and local media (U= 1702.5, p = .049) were significant. Other sources such as print media and TV did not prove to be significant. In general for both groups, when looking at where people obtained their sources of information, television was relied on the most.
Figure 4 shows the location from which evacuees originated and the location of non-evacuees. The variable “Both” indicates that evacuees came from these areas, as well as the fact that we interviewed people from these sites who did not leave. Figure 5a depicts the mandatory and voluntary evacuation zones on October 5th and 5b shows the mandatory evacuation zones on October 6th. It is interesting that inland people evacuated when they were not in an evacuation zone by letter or under a mandatory evacuation order, though there are some areas of water inland. This runs counter to the recent emphasis by emergency management to encourage people only to evacuate when they are ordered to do so. That is, emergency managers would prefer that individuals who are not in a mandatory evacuation zone stay in place, so that the roads are not congested. This allows those who are under an emergency evacuation order to evacuate safely and more quickly. On the other hand, it is also interesting that there are areas which should be entirely green in the mandatory evacuation areas, indicating that these people left the coastal areas. However, our results do not show this and in fact many people stayed in place, not heeding the evacuation orders.
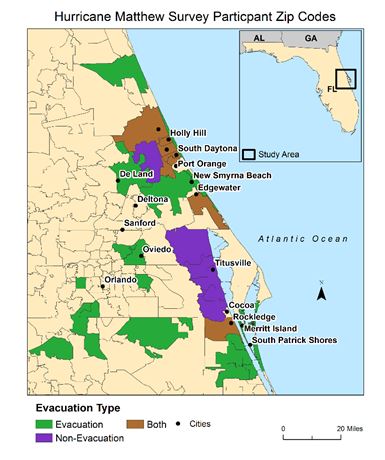 Figure 4. Location from which surveyed evacuees originated and location of surveyed non-evacuees. “Both” indicates that evacuees came from these areas and we found people from these sites who did not leave.
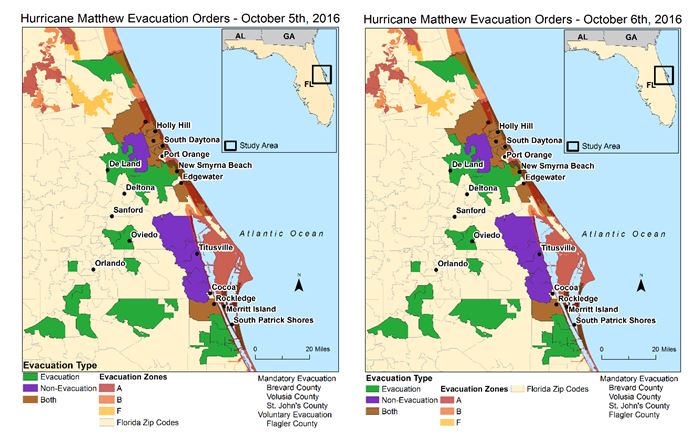 Figures 5a and 5b. Counties under mandatory or voluntary evacuation order shown for Oct 5th (5a) and Oct 6th (5b). Also shown is the location from which surveyed evacuees originated and location of surveyed non-evacuees. “Both” indicates that evacuees came from these areas and we found people from these sites who did not leave. Evacuation Zones shown.
Broader Impacts
This research will allow the integration of teaching and research on a number of levels:
1) The development of sustainable, community-based disaster preparedness, mitigation, and recovery policies will benefit from approaches that consider the influence of social support and connectedness on evacuation decision-making. Specifically, this study informs whether social connection dimensions such as density (i.e., quantity and closeness of ties), diversity (i.e., a range of relationships), and dependability (i.e., tangible resources) enhance or hinder evacuation behavior. This research has value in attempting to develop an evidence-based model of social supports and evacuation decisions, particularly among populations deemed more vulnerable due to socioeconomic status, ethnicity, and age. Hazard managers will be able to integrate this new knowledge into more targeted disaster education campaigns and planning strategies. Likewise, local disaster service organizations (e.g., humanitarian, social service, and faith-based groups) may better understand the role social support and connectedness play in linking individuals to preparedness and recovery services as a way to promote community resiliency. As part of this project, our existing working relationship with the Florida Division of Emergency Management and Florida Department of Transportation will be strengthened. The results of this study will be provided to these agencies in order to aid future decision-making. Andrew Sussman (Hurricane Program Manager, Florida Division of Emergency Management) has notified us that they have started working on a Post Storm Assessment for Hurricane Matthew with FEMA Region 4. Since they do not have the funding for a traditional telephone survey, they are particularly interested in any data that can document human behavior for this storm. Furthermore, some behavior discussed in this report may be applied to hazards other than hurricanes. Therefore this research allows for community engagement on a variety of scales.
2) These results will be most useful in teaching students at the University of South Florida about hurricane hazards, particularly for the upper level course, GEO 4340: Natural Hazards; classes pertaining to a proposed Weather, Climate and Society Research Experience for Undergraduates (REU) program, IDH: 4930 Research Methods and IDH 4910: Social Interventions; and the graduate level courses, GEO 5347: Advanced Natural Hazards and GEO 6255: Weather, Climate and Society.
3) Results will be presented at several professional disciplinary conferences such as: the Hurricanes and Climate Change Summit in Greece (June 2017, presented by graduate student Michelle Saunders); the Association of American Geographers (April 2017, presented by PI Collins); future conferences in the areas of sociology/social work (Society for Social Work and Research and Society for the Study of Social Problems); meteorology (American Meteorological Society, AMS); hazards (Hazards Research and Applications Workshop, Boulder, CO; Florida Governor’s Hurricane Conference and National Hurricane Conference); and anthropology (American Anthropological Association and the Society for Applied Anthropology). Results will also be disseminated through top tier peer-reviewed journals. We are considering submissions to Disasters, International Journal of Mass Emergencies and Disasters, The Journal of Community Practice, and the AMS journal Weather Climate and Society.
4) This project has encouraged graduate and undergraduate students to conduct research (some for the first time) with an interdisciplinary team (from the fields of Geography and Social Work). The grant allowed the training of several undergraduate and graduate students. These students are undertaking directed and independent study projects related to various aspects of the research, and will produce written reports of their work. This will inform publications related to this study. As part of this process, the students will gain first-hand knowledge of the scientific method, research and analytical techniques, and skills related to scientific writing.
Future work
The success of this preliminary study, which took place not only during a busy weekend at USF (Parent’s weekend) but also when both PIs were initially out of state, has instilled high confidence in our research protocol and our training and preparation of student data collectors. This preliminary study also allowed the team to identify and address areas of improvement which can be integrated into future protocols. One major methodological limitation was that due to the PIs not being in town, it was not appropriate to have a team ride out the storm at a local shelter in order to interview sheltered evacuees separately. In future studies, we would like to capture the responses of this type of population for a comparison group.
In addition, due to lightning present at the time of the first evacuation survey date, the team was not able to stay long in the field. This safety measure limited data collection from the early evacuation group. As a result, the original hypotheses proposed to the Natural Hazards Center Quick Response Program were modified. In future, we would like to reconsider these original hypotheses—comparing early versus late evacuation behavior.
Moreover—although 132 surveys is a substantial number—in the future we would like to collect, more data to enhance the representativeness of the sample. We could still conduct the surveys via convenience sample (which is realistic), but upon on return to the lab we could use a random number generator to select surveys to be analyzed.
Acknowledgements. We would like to acknowledge the USF hurricane team for their fieldwork including Michelle Saunders, Daniel Gessman, Christopher Mehta, Emily Cerrito, Kerri Dickey, Amy Polen, and Saurav Chakraborty. We also appreciate the work of Michelle Saunders and Noel Rehm in creating the GIS maps. We appreciate and acknowledge the Natural Hazards Center for providing the necessary funding from the Quick Response Program. We would also like to acknowledge Douglas Lunsford for his statistical advice in analyzing this dataset.
References
-
Dash, N., and H. Gladwin. 2007. “Evacuation Decision Making and Behavioral Responses: Individual And Household.” Natural Hazards Review 8 (3): 69-77. ↩
-
Gladwin, C., H. Gladwin, and W. Peacock. 2001. “Modeling Hurricane Evacuation Decisions with Ethnographic Method.” International Journal of Mass Emergencies and Disasters 19: 117-143. ↩
-
Haines, V., J. J. Beggs, and J. S. Hurlbert. 2002. “Exploring Structural Contexts of the Support Process: Social Networks, Social Statuses, Social Support, and Psychological Distress.” Advances in Medical Sociology 8: 271–294. ↩ ↩
-
Whitehead, J.C., B. Edwards, M. van Willigne, J. R. Maiolo, K. Wilson, and K. T. Smith. 2000. “Heading For Higher Ground: Factors Affecting Real and Hypothetical Hurricane Evacuation Behavior.” Environmental Hazards 2: 133-142. ↩
-
Cutter, S.L., B. J. Boruff, and W. L. Shirley. 2003. “Social Vulnerability to Environmental Hazards.” Social Sciences Quarterly 84: 242-261. ↩
-
Moore, S., M. Daniel, L. Linnan, M. Campbell, S. Benedict, and A. Meier. 2004. “After Hurricane Floyd Passed: Investigating The Social Determinants of Disaster Preparedness and Recovery.” Family Community Health 27 (3): 204-217. ↩ ↩
-
Real, B. 2007. “Hard Decisions in the Big Easy: Social Capital and Evacuation of the New Orleans Area Hispanic Community During Hurricane Katrina.” In Perspectives on social vulnerability, edited by K. Warner, 72-83. United Nations University: Institute for Environment and Human Security. ↩
-
Cutter, S.L., and C. Finch. 2008. “Temporal and Spatial Changes in Social Vulnerability to Natural Hazards.” Proceedings of the National Academy of Sciences 105 (7): 2301-2306. ↩
-
Tobin, G.A., and B. E. Montz. 1997. Natural Hazards: Explanation and Integration. New York: Guilford Press. ↩
-
Wisner, B., P. Blaikie, T. Cannon, and I. Davis. 2004. At risk: Natural Hazards, People’s Vulnerability and Disasters (2nd ed.). United Kingdom: Routledge. ↩
-
Wisner, B., P. Blaikie, T. Cannon, and I. Davis. 2004. At risk: Natural Hazards, People’s Vulnerability and Disasters (2nd ed.). United Kingdom: Routledge. ↩
-
Caplan, G. 1974. Support Systems and Community Mental Health. Behavioral Publications. ↩
-
Sarason, I. G., and B. R. Sarason, eds. 1985. Social Support: Theory, Research and Application. The Netherlands: Martinus Nijhoff. ↩
-
Broadhead, W.E., B.H. Kaplan, S.A. James, E.H. Wagner, V.J. Schoenbach, R. Grimson, S. Heyden, G. Tibblin, and S.H. Gehlbach. 1983. “The Epidemiologic Evidence for a Relationship Between Social Support and Health.” American Journal of Epidemiology 117: 521-537. ↩
-
Leavy, R.L. 1983. “Social Support and Psychological Disorder: A Review.” Journal of Community Psychology 11: 3-21. ↩
-
Mitchell, R.E., A.G. Billings, and R.H. Moos. 1982. “Social Support and Well-Being: Implications for Prevention Programs.” Journal of Primary Prevention. 3: 77-98. ↩
-
Berkman, L. E, and S.L. Syme. 1979. “Social Etworks, Host Resistance, and Mortality: A Nine-Year Follow-Up Study of Alameda County Residents.” American Journal of Epidemiology 109: 186-204. ↩ ↩
-
House, J.S., C. Robbins, and H.L Metzner. 1982. “The Association of Social Relationships and Activities With Mortality: Prospective Evidence From The Tecumseh Community Health Study.” American Journal of Epidemiology 116: 123-140. ↩
-
Cohen, S., and T. A. Wills. 1985. “Stress, Social Support, and the Buffering Hypothesis.” Psychological Bulletin 98: 310-357. ↩ ↩ ↩
-
Barrera, M., Jr. 1981. “Social Support in the Adjustment of Pregnant Adolescents: Assessment Issues.” Social networks and Social Support 4: 69-96. ↩
-
Cohen, S., E. L. Struening, G. L. Muhlin, L. E. Genevie, S. R. Kaplan, and H. B. Peck. 1982. “Community Stressors, Mediating Conditions, and Well-Being in Urban Neighborhoods.” Journal of Community Psychology 10: 377-391. ↩
-
Cohen, S., and T. A. Wills. 1985. “Stress, Social Support, and the Buffering Hypothesis.” Psychological Bulletin 98: 310-357. ↩
-
Lakey, B., and S. Cohen. 2000. “Social Support Theory and Selecting Measures of Social Support.” In Social Support Measurement and Interventions: A Guide for Health and Social Scientists,edited by S. Cohen, L. U. Gordon, and B. H. Gottlieb, 3-28. Oxford: University Press. ↩
-
Cutter, S.L., L.A. Johnson, C. Finch, and M. Berry, 2007. “The U.S. Hurricane Coasts: Increasingly Vulnerable?” Environment 49 (7): 8-20. ↩ ↩
-
Haines, V., and J. S. Hurlbert. 1992 “Network Range and Health.” Journal of Health and Social Behavior 33: 254-266. ↩
-
Brinkley, D., 2006. The Great Deluge: Hurricane Katrina, New Orleans, and the Mississippi Gulf Coast. New York: Harper Perennial. ↩
-
Granovetter, M.S. 1973. “The Strength of Weak Ties.” American Journal of Sociology 78 (6): 1360-1380. ↩
-
Unger, D. G., and D. R. Powell. 1980. “Supporting Families Under Stress: The Role of Social Networks.” Family Relations 29 (4): 566-574. ↩
-
Buckle, P. 2006. “Assessing social resilience.” In Disaster resilience: An Integrated Approach, edited by D. Paxton and D. Johnston, 88-104. Springfield, IL: Charles C. Thomas. ↩
-
Dynes, R.. 2002. “The Importance of Social Capital in Disaster Response.” Preliminary Paper #327. University of Delaware Disaster Research Center. ↩
-
Mathbor, G. M. 2007. “Enhancement of Community Preparedness For Natural Disasters: The Role of Social Work in Building Social Capital for Sustainable Disaster Relief and Management.” International Journal of Social Work 50 (3): 357-369. ↩
-
Riad, J.K., and F. H. Norris. 1998. “Hurricane Threat and Evacuation Intentions: An Analysis of Risk Perception, Preparedness, Social Influence, and Resources.” Preliminary Paper #271. University of Delaware Disaster Research Center. ↩
-
Dow, K., and S.L. Cutter. 2002. “Emerging Hurricane Evacuation Issues: Hurricane Floyd and South Carolina.” Natural Hazards Review 13 (1): 12-18. ↩
-
Tampa Bay Regional Planning Council (TBRPC). 2006. “Tampa Bay Region Hurricane Evacuation Study Update 2006.” A technical data report for Hillsborough, Manatee, Pasco and Pinellas Counties. ↩
-
Cohen, S., and H. M. Hoberman. 1983. “Positive Events and Social Supports as Buffers of Life Change Stress.” Journal of Applied Social Psychology 13: 99-125. ↩
-
Stallings, R.A., ed. 2002. Methods of disaster research. Bloomington, IL: Xlibris. ↩
-
Norris, F. 2006. “Disaster Research Methods: Past Progress and Future Directions.” Journal of Traumatic Stress 19 (2): 173-184. ↩
-
Anderson, D. R. 2001. “The Need to Get the Basics Right in Wildlife Field Studies.” Wildlife Society Bulletin 29: 1294-1297. ↩
-
Herek, G.M. 2008. “A Brief Introduction to Sampling.” Available at http://psychology.ucdavis.edu/rainbow/html/fact_sample.html ↩
-
Lunsford, G. 2001. “Effect of Test Anxiety, Study Anxiety, Study Habits, Test Taking Skills and Academic Problems on GPA.” Master’s Thesis, University of South Florida. ↩
Collins, J., Ersing, R., & Polen, A. (2015). Evacuation Behavior Measured at Time of Expected Hurricane Landfall: An Assessment of the Effects of Social Networks (Natural Hazards Center Quick Response Research Report Series, Report 265). Natural Hazards Center, University of Colorado Boulder. https://hazards.colorado.edu/quick-response-report/evacuation-behavior-measured-at-time-of-expected-hurricane-landfall-an-assessment-of-the-effects-of-social-networks