Resilience of Social Support Networks to Social Distancing
Publication Date: 2021
Abstract
Since March 2020, the COVD-19 pandemic has resulted in the need to practice social distancing measures, yet socialization remains an important component of maintaining social support and coping capacity during disasters and crises. Young adults may be especially vulnerable to the loss of social support networks given shifts to remote learning and working, high risk of unemployment, negative psychological impacts, and travel mobility constraints exacerbated by the pandemic. To improve our understanding of the dynamics of social support networks in a rapidly evolving pandemic context, this quick response report examines the impact of the pandemic on the social support networks of young adults. We developed a detailed web-based survey incorporating a retrospective name and place generator that was used to reconstruct social support networks existing for respondents across physical (i.e., in-person) and virtual space. The survey was administered to 313 individuals of ages 18 to 34 years in California, Illinois, and Texas. Respondents were recruited via the Prolific platform using this age and location criteria. Analyzing this data, we examine how these networks have co-evolved throughout the pandemic in response to social isolation and pandemic-related stressors. This study will reveal the potential impacts of mandated distancing measures on critical social capital for disaster response. While our findings are specifically within the context of the COVID-19 pandemic, they can help to anticipate possible social consequences of longer lasting shifts toward physically distant lifestyles, such as those that may be necessitated by the current climate crisis.
Our preliminary findings reflect themes of changes to social support networks, impacts on emotional well-being, physical versus virtual mobility, and the role of third places in socialization. Overall, our initial findings suggest that social support networks shrank during the pandemic and shifted away from friends and colleagues toward family, intimate partners, those who respondents have known longer, those who live nearby (i.e., the same households or neighborhoods), those who communicate in-person, and those racially and politically similar to the respondent. In general, respondents did not find virtual mobility to be a satisfactory substitute for physical mobility with the exception of mandatory travel (i.e., working and shopping). Virtual mobility was reported to be worse at fulfilling human needs and failed to provide physical touch, closeness, and intimacy. These findings suggest that young adults require more opportunities than currently accessible to maintain their social support networks and mental health while practicing pandemic-related distancing measures. Future analysis will examine differential impacts within and across groups related to gender, income, race/ethnicity, and sexual orientation identities.
Introduction and Literature Review
This study examines the interconnected evolution of the physical and virtual social support networks of individuals subjected to social distancing measures. These experiences can be used to highlight the short- and long-term social consequences of the COVID-19 crisis. Social capital is needed for access to material, instrumental, and informational resources, as well as to manage emotions such as stress, anxiety, depression, loneliness, and frustration, which can worsen under conditions of social isolation. Therefore, maintaining social capital networks helps keep society functioning in a stable and safe manner during a crisis (Aldrich & Meyer, 20151). Furthermore, social capital plays a critical role in disaster response (Aldrich & Meyer, 2015), so it will be necessary to address gaps in social capital and to anticipate challenges in view of other likely stressors, such as climate hazards and disaster events. The use of communication technologies is a potential adaptation to fill gaps in physical social capital. This study identifies a group of individuals who are more likely to be vulnerable to social capital loss during social distancing mandates and investigates how differences in accessing existing social support networks influenced their ability to cope with stressors during a pandemic. These findings will help to inform policies, strategies, and investments that could strengthen social capital networks in socially and economically vulnerable groups.
Social capital refers to material, instrumental, emotional, and informational resources that are accessed through relationships with other individuals (Grootaert et al., 20042). Social capital is considered to have both a structural component—referring to group membership, civic participation, and socialization—and a cognitive component made up of trust, cooperation and reciprocity norms, and community attachment (Uphoff, 19993). It is further differentiated by types of social capital, including bonding, bridging, and linking social capital. Bonding refers to close connections with family, friends, and neighbors; bridging refers to more distant connections with individuals from other communities; and linking refers to connections to dissimilar individuals who maintain different positions of power outside of the community (Sanyal & Routray, 20164). In online communities, bonding social capital is measured by having someone to talk to, to turn to for advice, and to borrow money from, while bridging social capital is measured by connections with those who broaden interests and curiosities, encourage trying new things, and create a feeling of connectedness to a larger community (Littau, 20095; Tomai et al., 20106).
Social capital has been shown to be positively correlated with individual well-being (Portela et al., 20137), and decreases in social capital have been shown to correspond with increases in violence and detachment (van Beuningen & Schmeets, 20138). Furthermore, loneliness and social isolation have been linked to risk factors for coronary heart disease and stroke (Valtorta et al., 20169). Research has shown that social capital is a critical component of disaster resilience (Aldrich, 201710; Aldrich & Meyer, 2015; Nakagawa & Shaw, 200411; Norris et al., 200812) and individuals who are especially vulnerable during disasters include those with physical mobility constraints, those in caretaking roles, and those with limited access to money, information, and support (Haworth et al., 201913). In many cases, social capital is formed and maintained by physical infrastructure, such as libraries and community centers (Klinenberg, 201814), but the current stay-at-home orders restrict access to these physical spaces. Many young people have relocated from their place of residence to be closer to extended family members (Liu et al., 202015). While some existing studies have examined public opinions related to social distancing measures (Baum et al., 200916), this pandemic presents the first opportunity we have had to study the outcomes of such a large-scale implementation of stay-at-home mandates.
Research Design
Research Questions
The goal of the research was to examine the effects of mandated distancing measures on social support networks at the individual level. This was done to better understand the mechanisms that support successful shifts to virtual social support and to identify subgroups among young adults that are more vulnerable to social support loss during a pandemic. The overarching question guiding this research is: How are social distancing measures impacting the social support networks of young adults during the COVID-19 pandemic? To answer this question, we explore the following four specific research questions (RQs):
Quantitatively, how has physical and virtual social support co-evolved for young adults during the pandemic?
Qualitatively, what impacts has the pandemic had on social support and emotional well-being among young adults?
How has socialization and mobility shifted between physical places and virtual spaces during the pandemic?
What differences exist in the roles that virtual spaces and physical places play in meeting human needs related to social support?
Data, Methods, and Procedures
Survey Data Collection
We used a quantitative and qualitative survey with a retrospective name and place generator administered as a web-based survey on Qualtrics. The online crowdsourcing platform Prolific was used to recruit participants to complete the study for payment. The platform is well suited to recruit young adults for repeated study participation by enabling respondent filtering. The survey contained 206 questions and was designed to be completed within 20 minutes. The study design and data collection methods were approved by the Institutional Review Board of Northwestern University on May 27, 2020, and the first wave of data collection occurred in February 2021.
The survey instrument was based on a personal network research design to capture weighted, directional, egocentric networks of social support received at the individual level. The name generator, a concept originally developed by McCallister and Fischer (197817), was used to recreate these networks for social network analysis. The name generator, as described in Bidart and Charbonneau (201118), was based on the receipt of advice, assistance, and caring from family, friends, neighbors, and others. Data collected in this survey included sociodemographic information (e.g., age, gender, race, income, employment, education, household size, marital status, internet reliability, etc.), relationship attributes (e.g., duration, proximity, homogeneity, etc.), and network size. Respondents were asked to use a name generator to represent their current support network during the stay-at-home order and to retrospectively consider how it compared to their support network before the order. Specifically, they were first asked to list up to five names, nicknames, or initials of people they relied on for advice, assistance, or caring during the first year of the pandemic. Then they were given an opportunity to list up to five more names, if needed. Finally, they were asked to do the same thing while considering the year preceding the pandemic. The survey was designed to collect data in two waves, with Wave 1 deployed in February 2021 and Wave Two planned for Summer 2021. The first wave was distributed using an online survey response platform in three states where stay-at-home orders were initiated—California, Illinois, and Texas. While stay-at-home orders had been common in many states, we selected these specific states to represent relatively large areas across different regions of the United States Participation in the survey was opt-in, which might have resulted in voluntary response bias.
Results and Discussion
Data Analysis
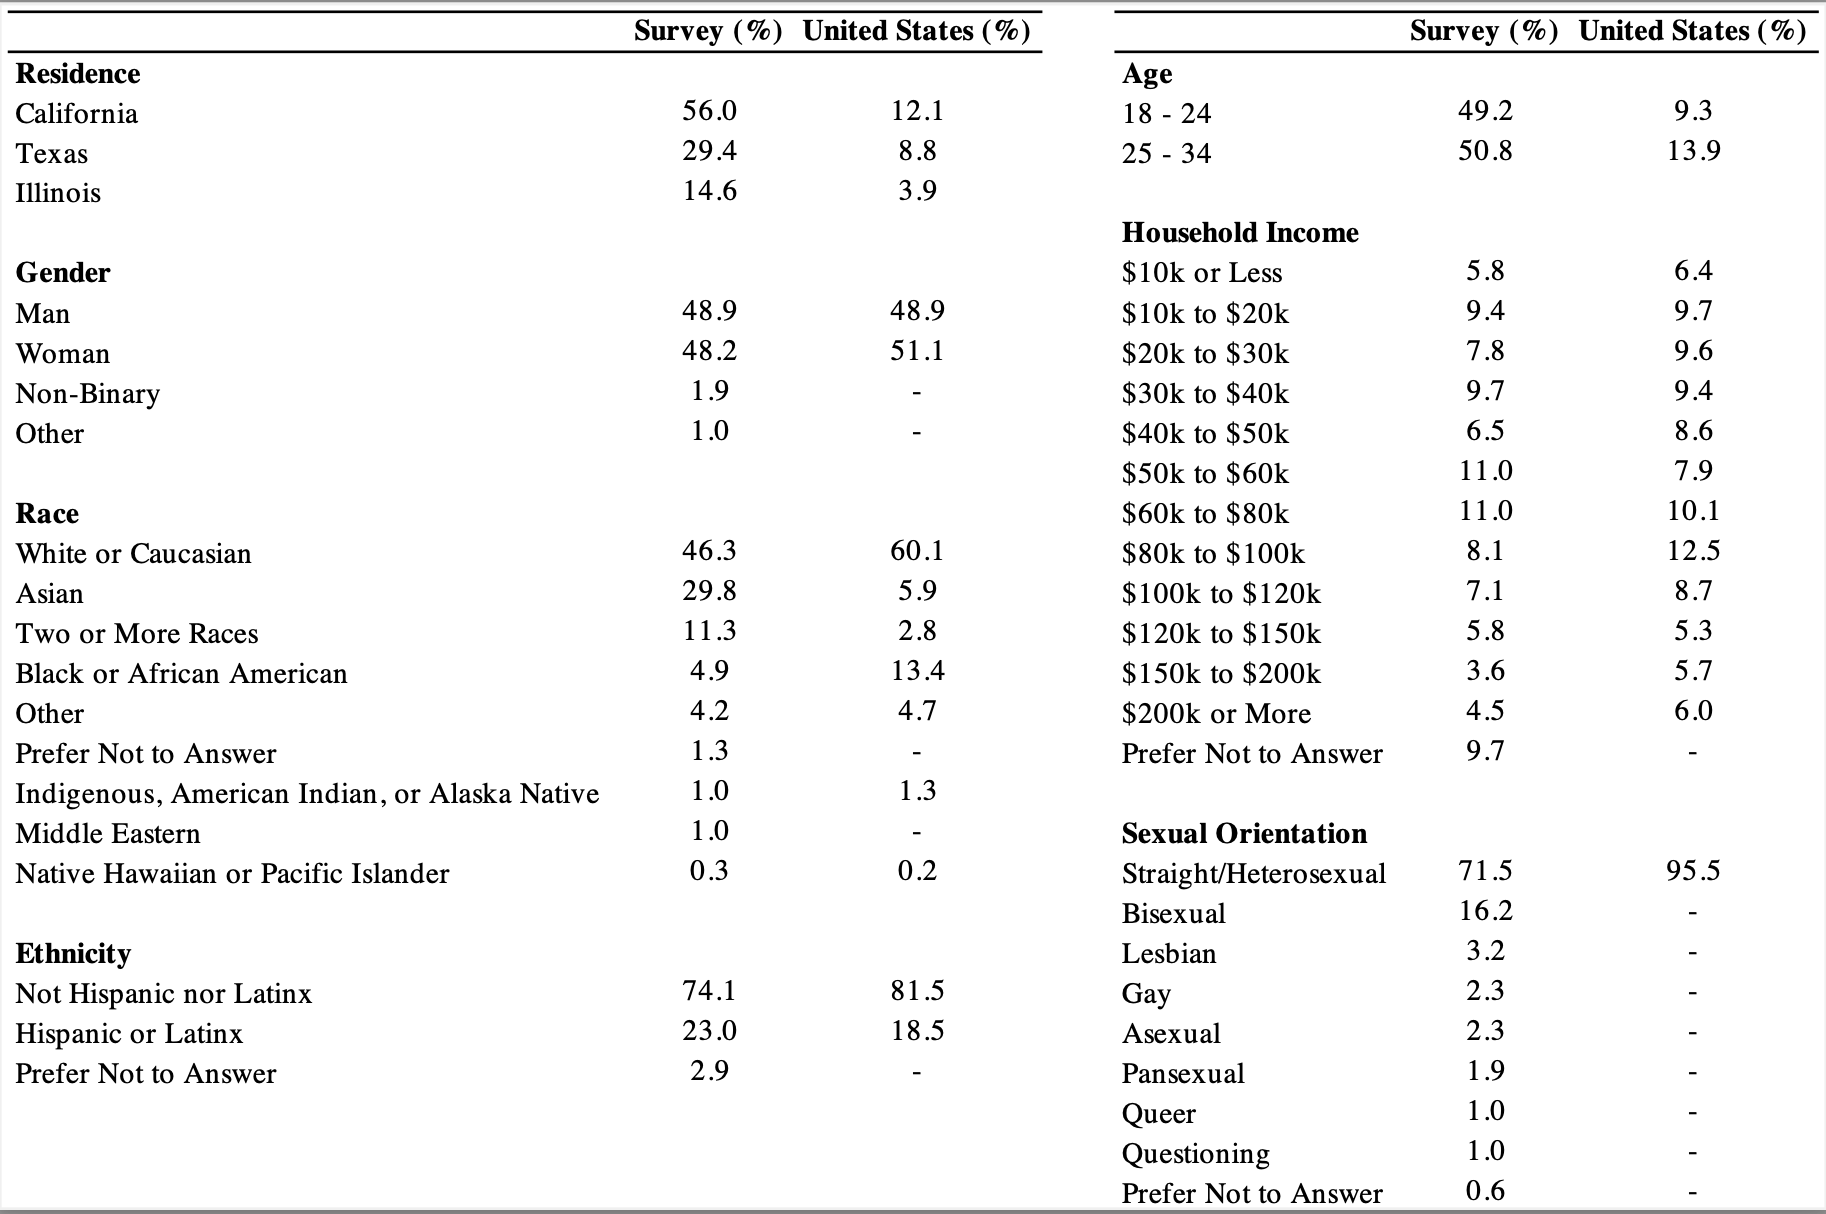
The survey sample sociodemographics are shown in Table 1. The sample representation of residence, gender, ethnicity, age, and income is proportional to national representation, but the sample population contains an overrepresentation of Asian respondents with an underrepresentation of White and Black respondents and an overrepresentation of LGBTQ+ individuals. These differences in representation may be related in part to the demographic of Prolific users and the age range of our sample population, respectively. As a result, our findings are not generalizable to all 18- to 34-year-olds in the United States.
Table 1. Sociodemographic Distributions of Survey Participants Aged 18 to 34 Years Old Compared to the U.S. Population
Results
To paint a broad picture of the social impacts of the COVID-19 pandemic on young adults, our results section presents our findings of pandemic-based changes to social support networks, emotional well-being, virtual mobility, visits to communal venues, and views on pandemic response policies.
Changes in Strong and Weak Ties
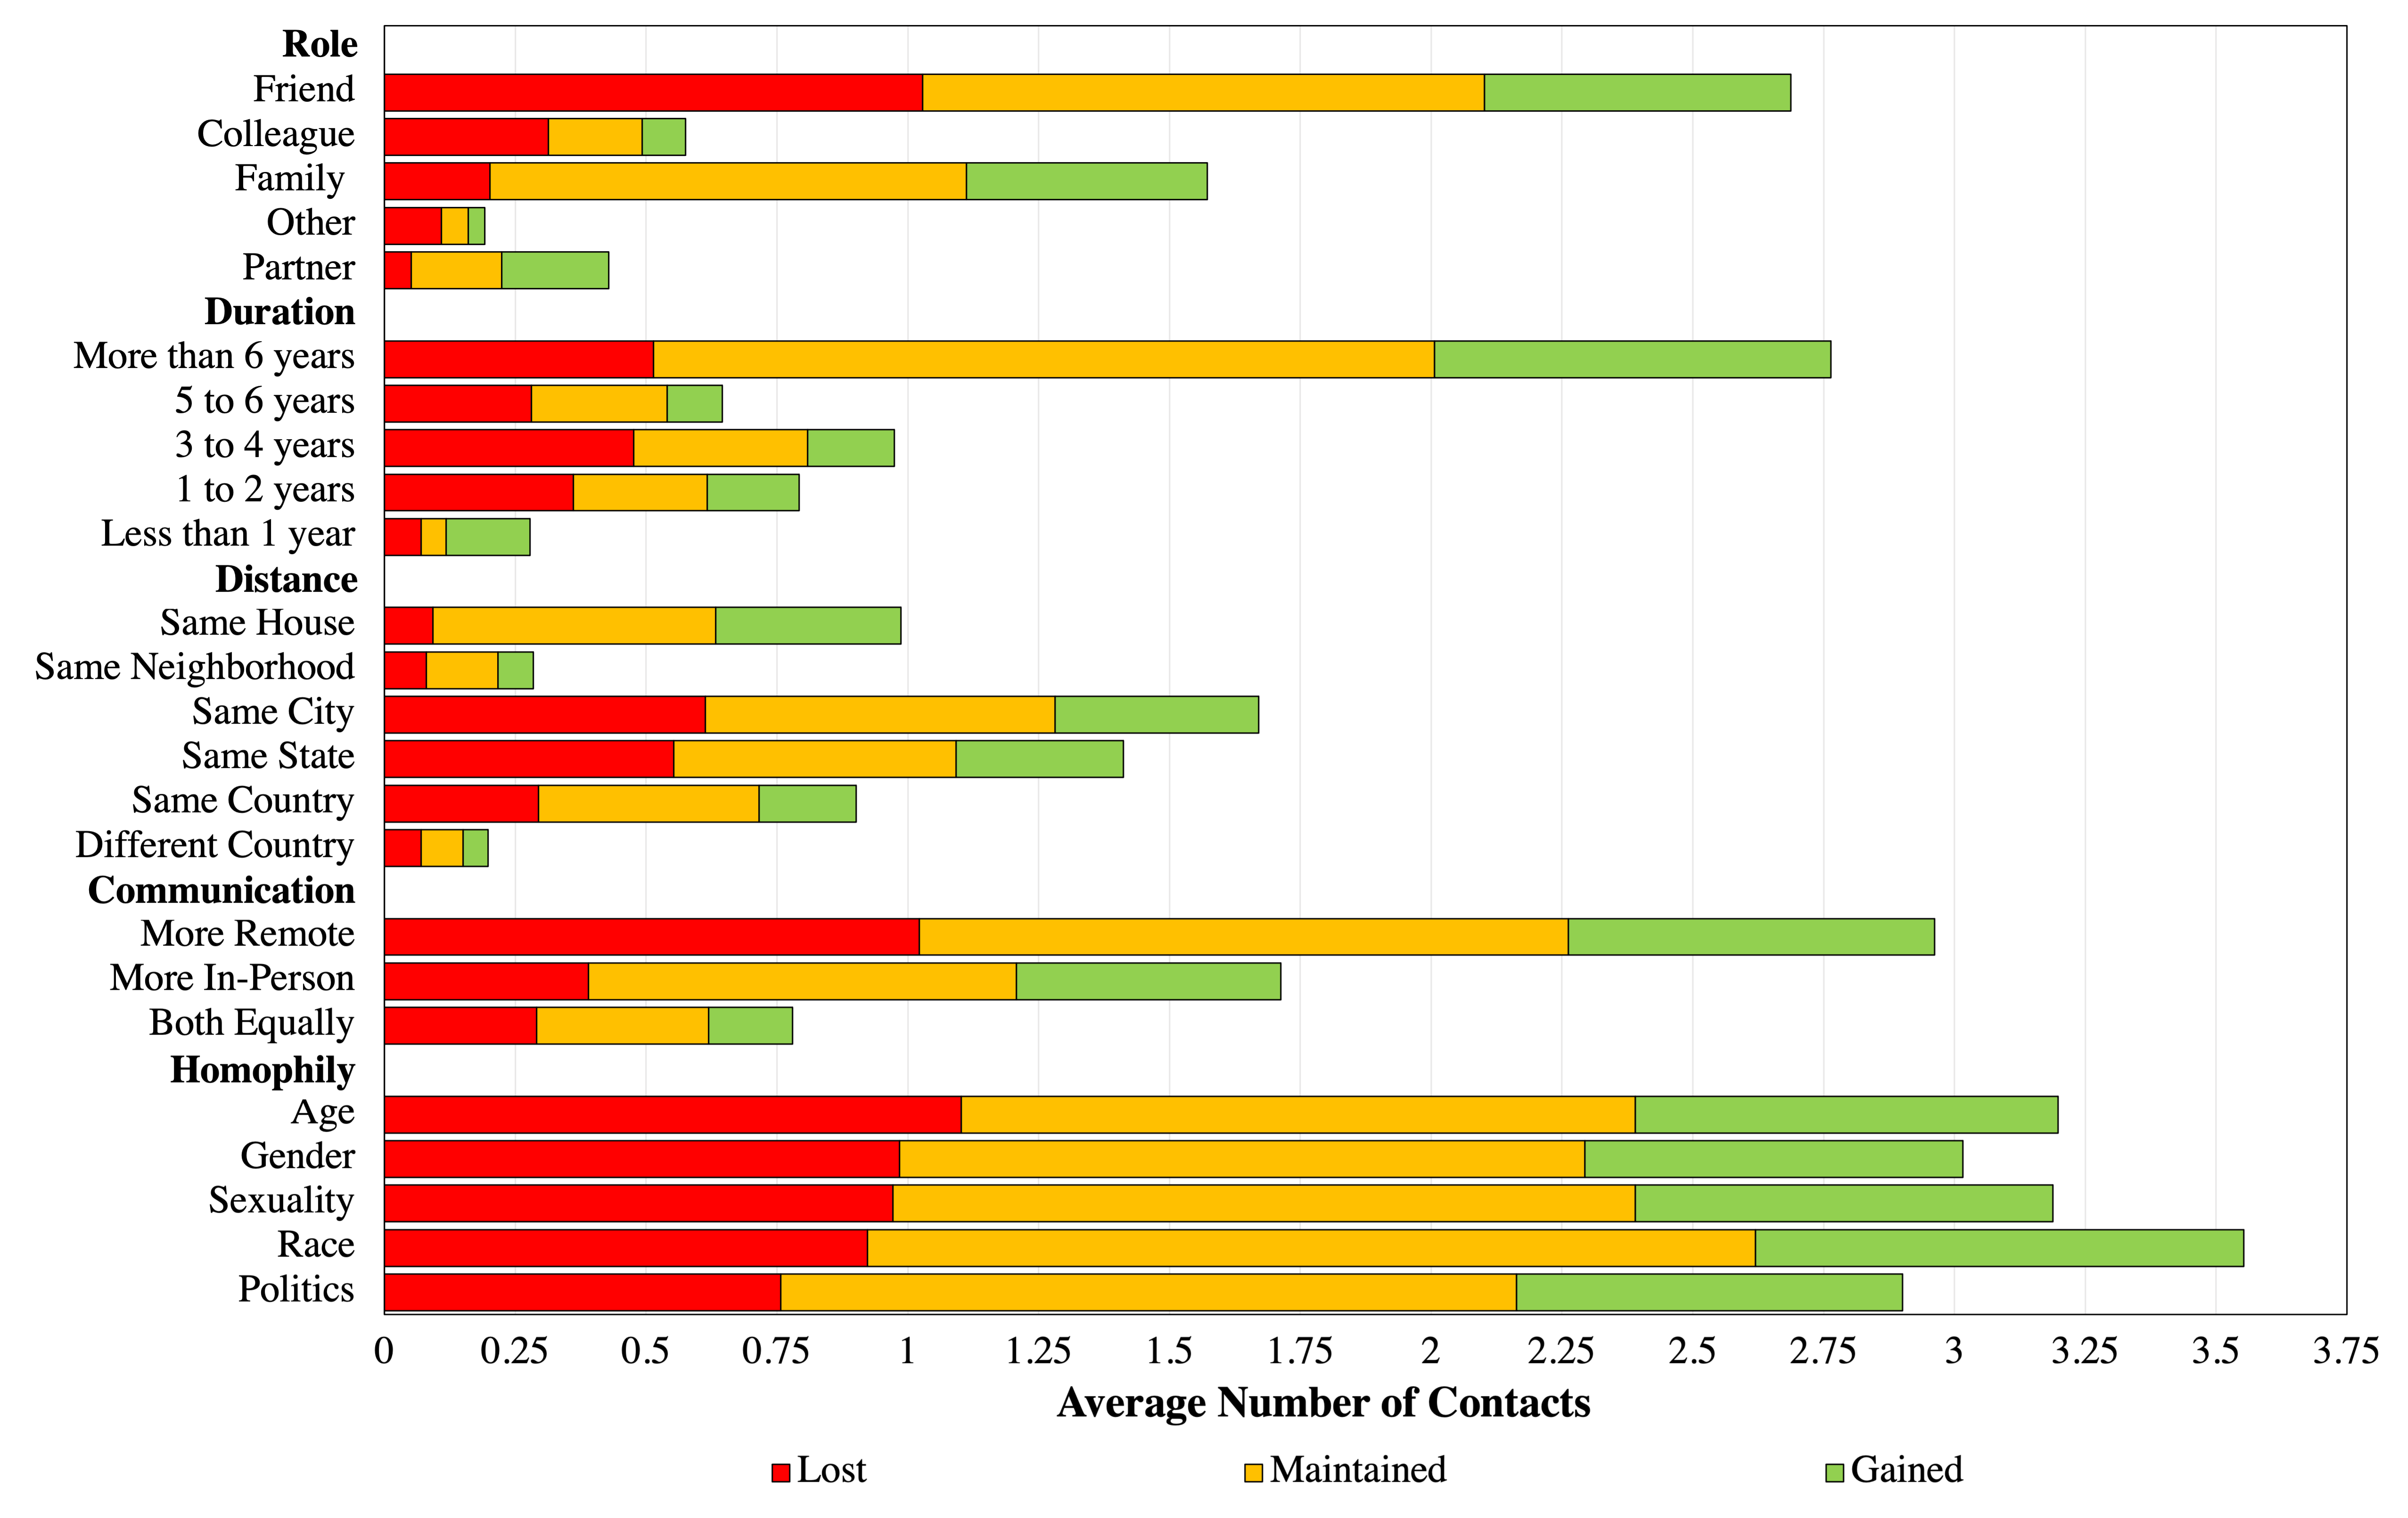
To measure changes in social support network parameters during the pandemic, a name generator was used to reconstruct networks of strong ties existing in physical and virtual space. As shown in Figure 1, our initial findings suggest that, on average, social support networks are shrinking during the pandemic and shifting toward family and intimate partners; individuals who have been known for a very long time (six or more years) or a very short period of time (less than one year); those who live very nearby (same household or neighborhood), those who are more racially and politically similar to the respondent, and those who can communicate in-person. This last finding is particularly interesting. While remote communication may have become more ubiquitous during the pandemic, those who were relied on to provide social support tended to be those who could be communicated with in-person. In other words, during the pandemic, people turned more toward those in their immediate proximity for social support despite the availability of virtual alternatives. To elaborate on the finding that many “new” social support network ties were individuals who had been known for six or more years, this refers to individuals who the respondent had previously known in a role outside of their primary social support network. For example, they may have been a friend from adolescence or a neighbor who had been known before the pandemic who wasn’t previously relied on for social support but who then shifted to social support position after the pandemic began.
Figure 1. Network Changes Representing Strong Ties
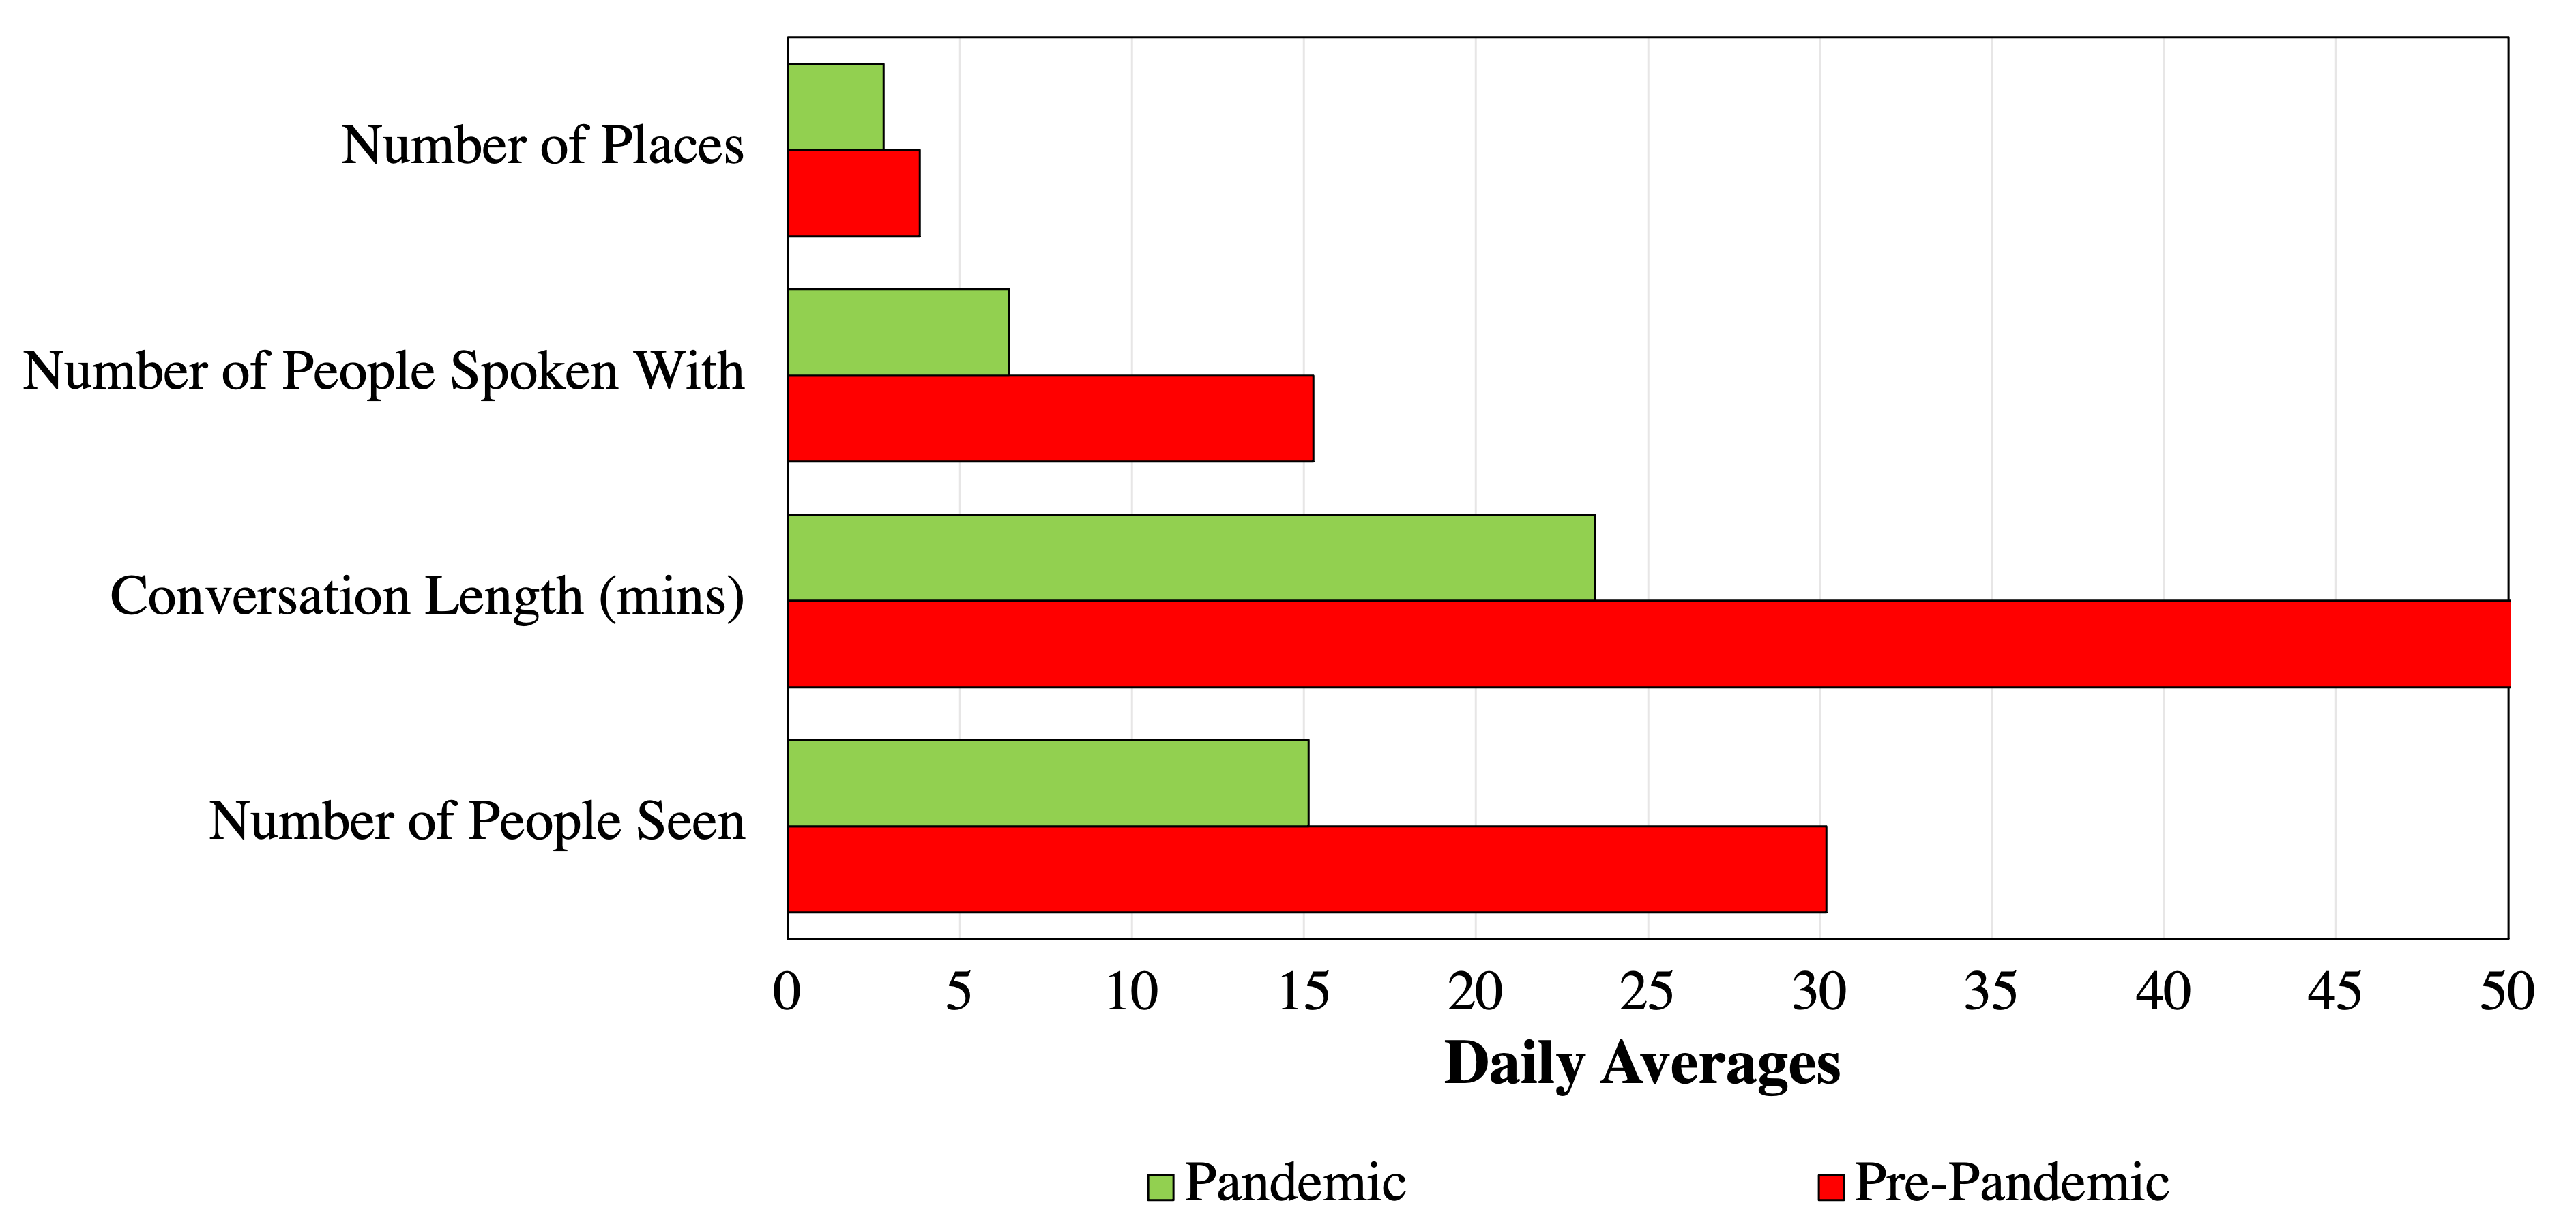
A place generator was used to track changes in weak ties during the pandemic. Weak ties, as represented by spontaneous conversations, also decreased during the pandemic. As shown in Figure 2, during the pandemic respondents saw fewer people and spoke to fewer of those people in a typical day, and when spontaneous conversations were had, they lasted for shorter lengths of time. These findings suggest a profound decline in the number of informal interactions experienced outside of close social support ties. This reduction could have potential impacts on emotional well-being and warrants further analysis.
Figure 2. Changes in Weak Social Network Ties
Impacts on Emotional Well-Being and Social Support
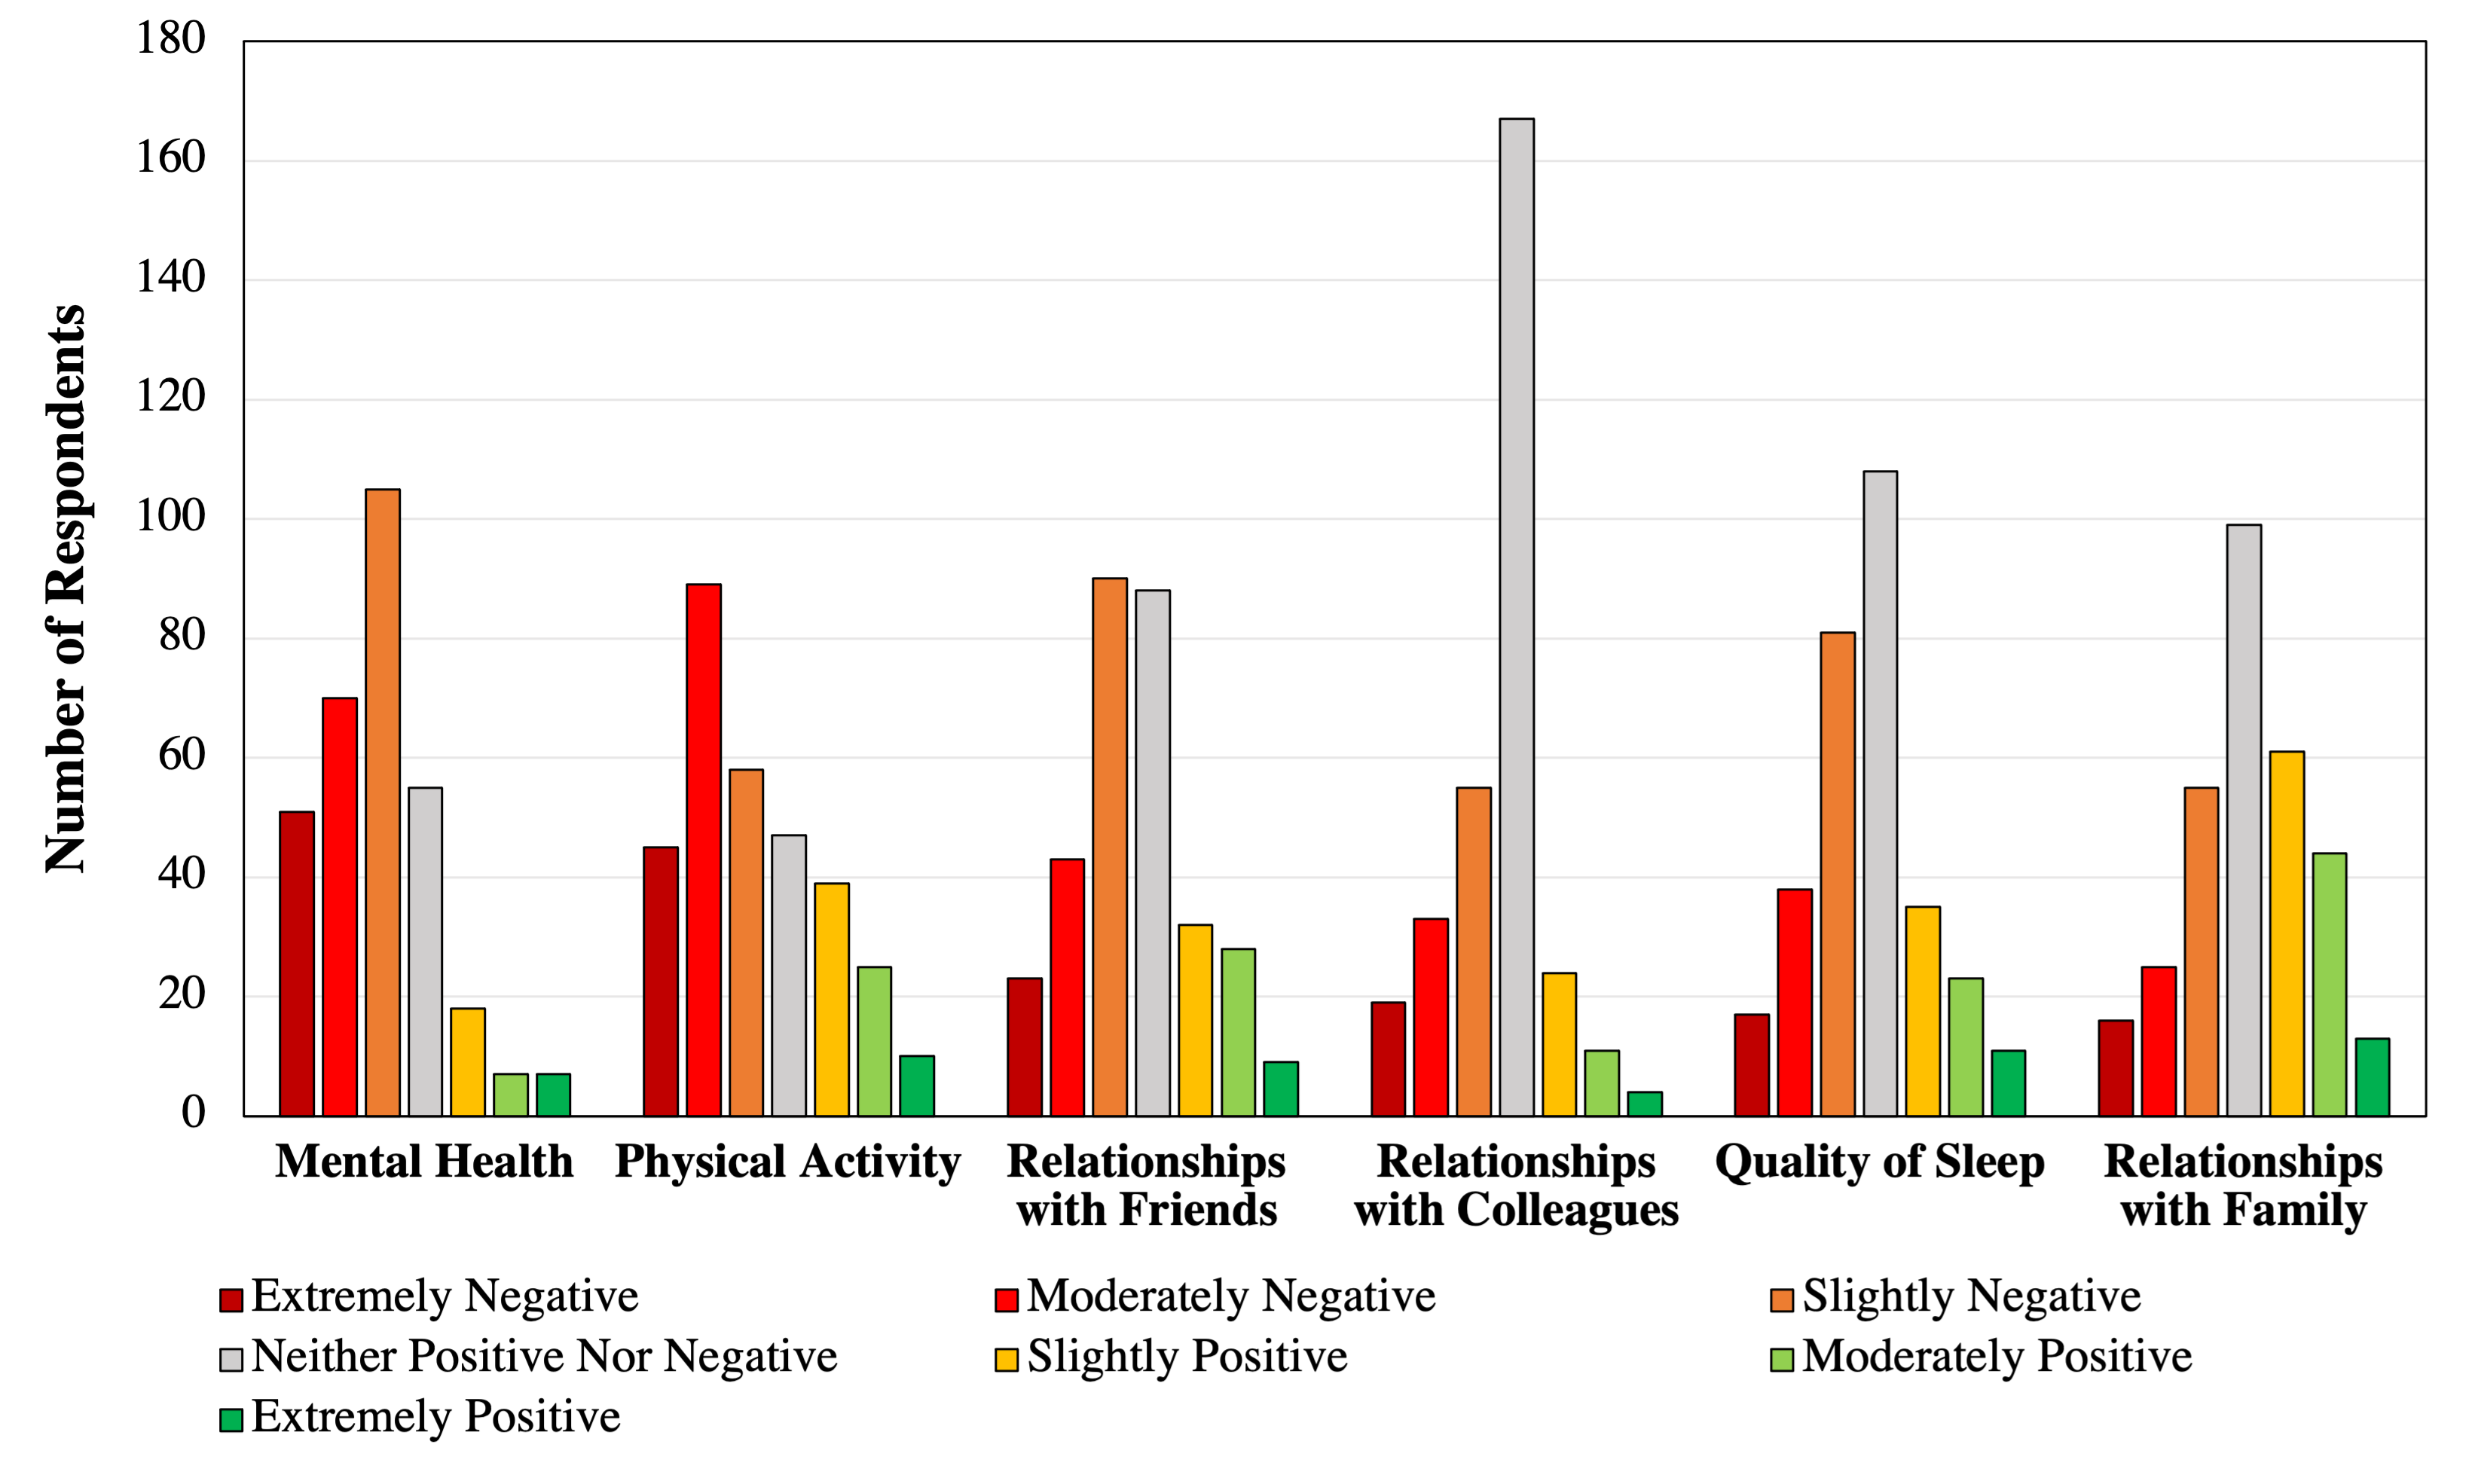
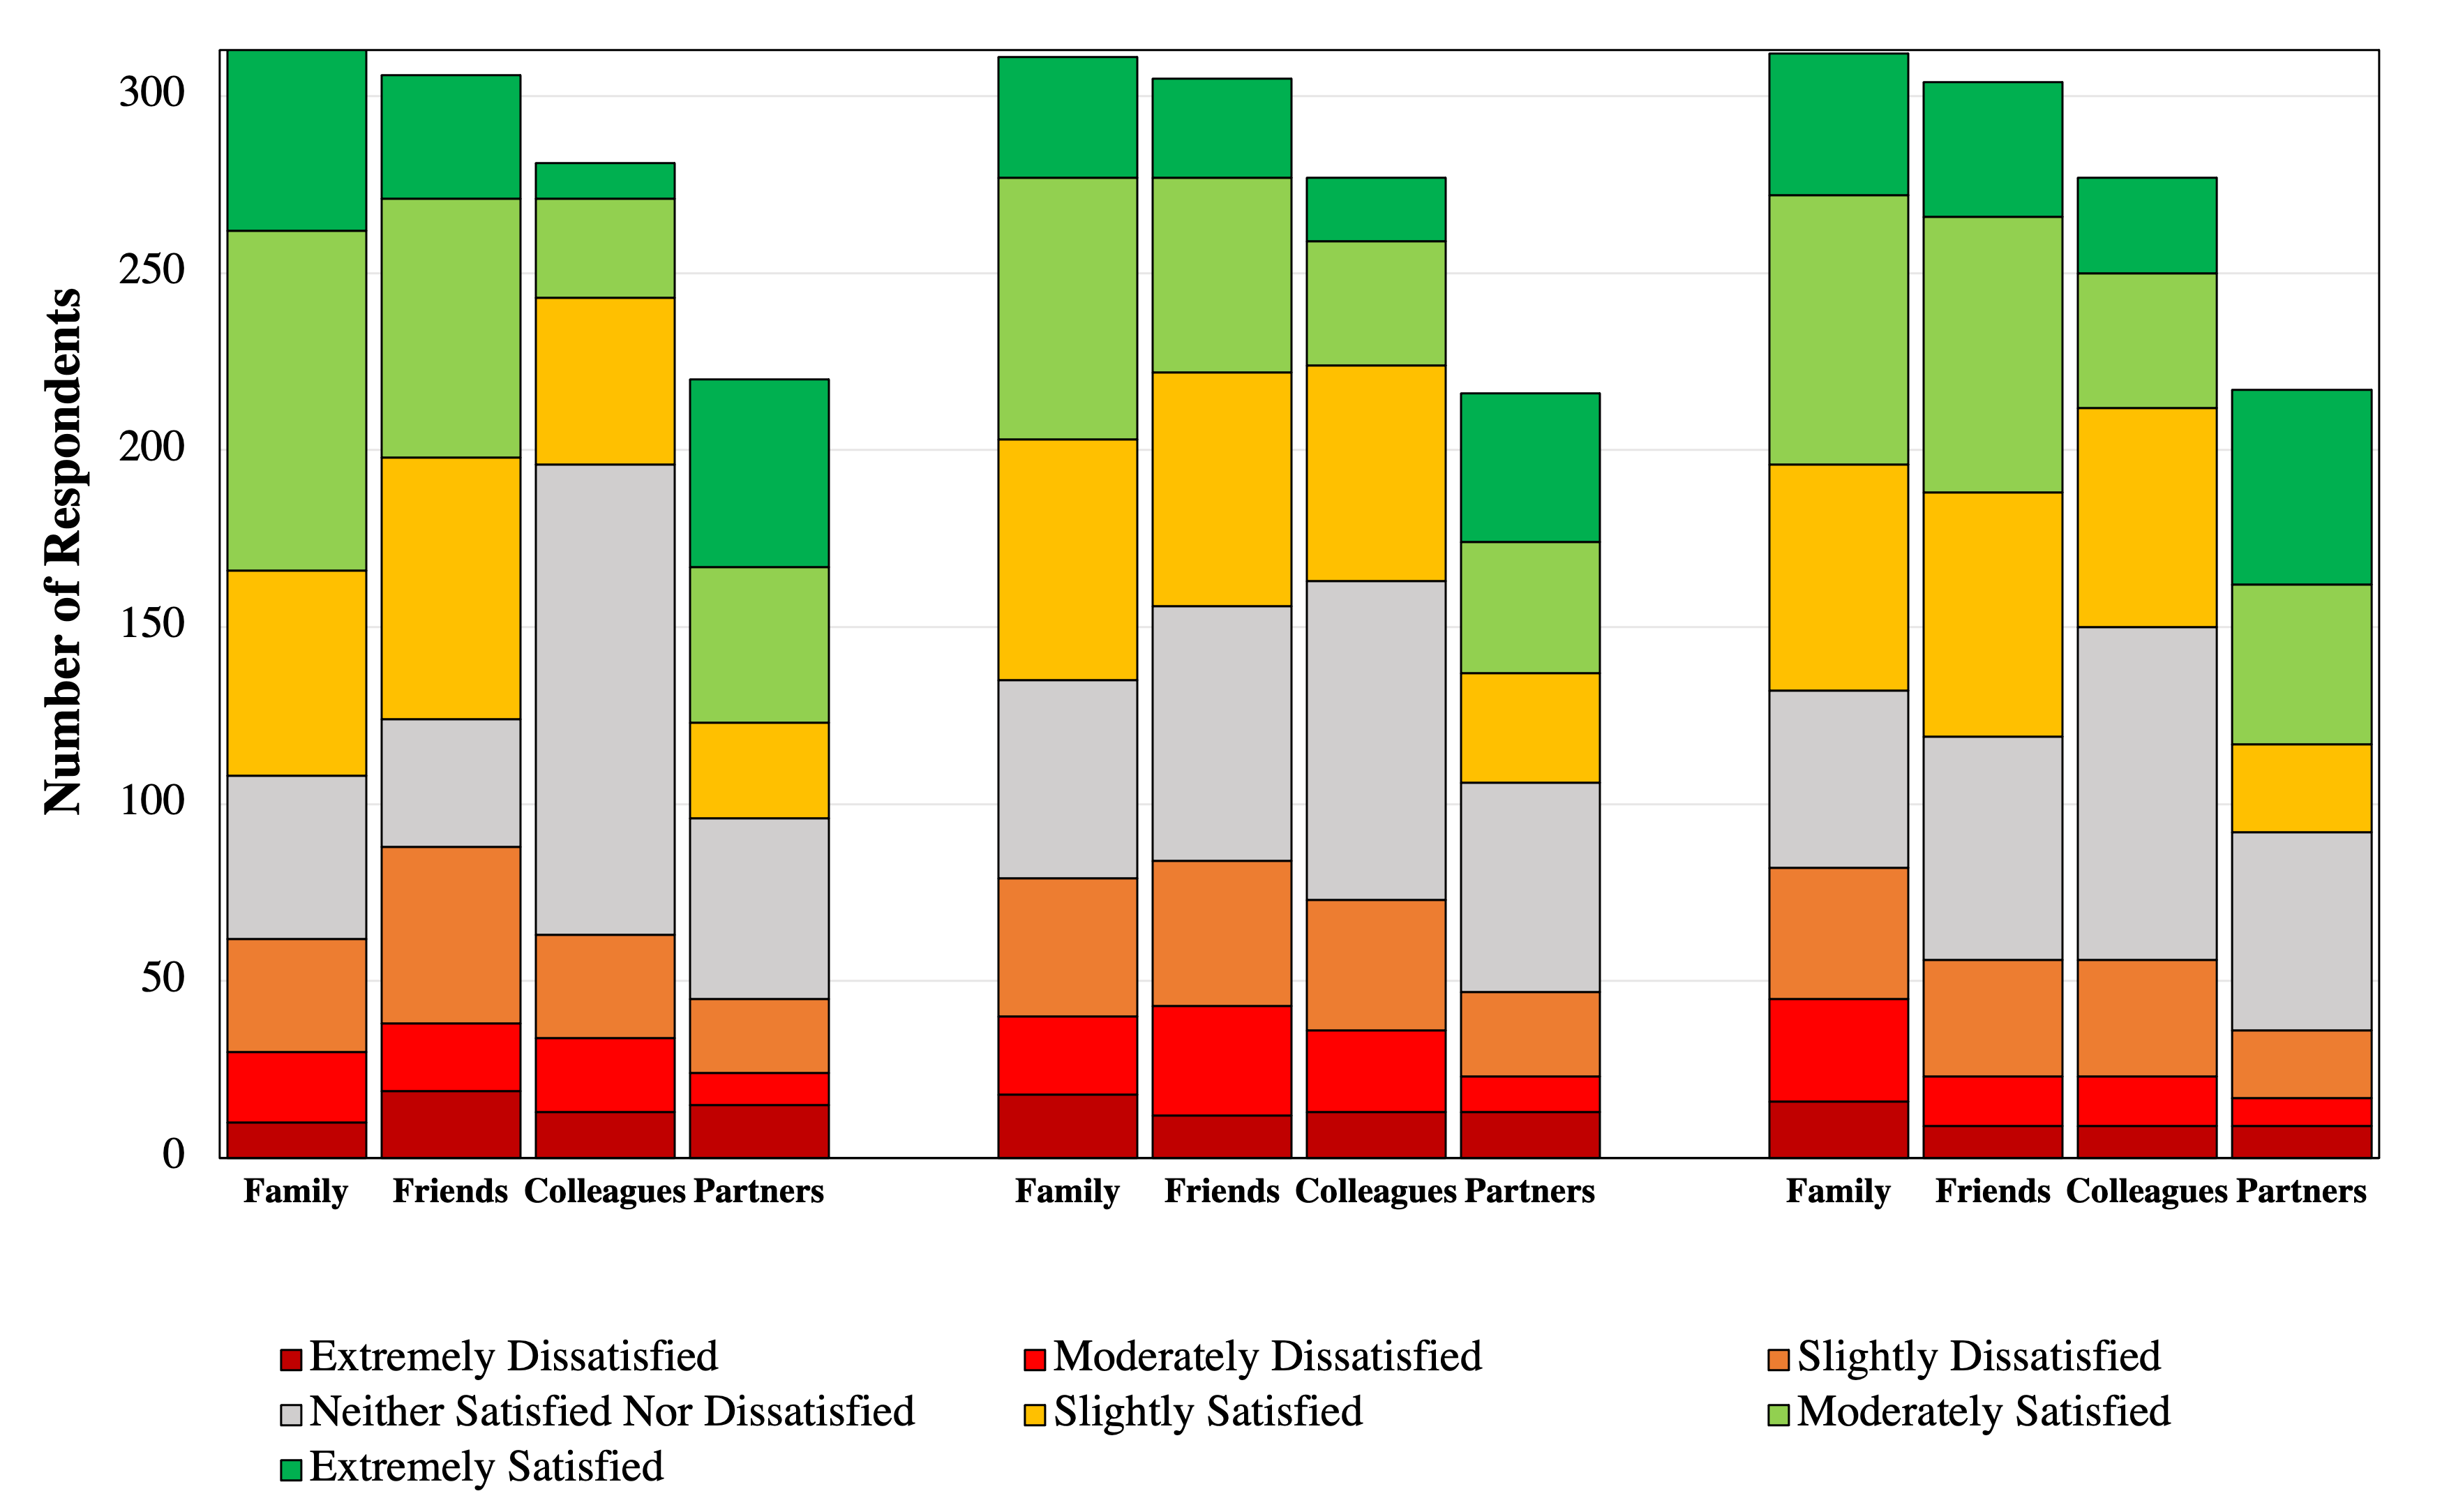
Impacts of the pandemic on emotional well-being and social relationships are shown in Figure 3. As examined qualitatively, the majority of respondents were satisfied with the affection (i.e., the feeling that they are liked, loved, trusted, accepted, and understood), behavioral confirmation (i.e., the feeling that they are useful, doing things well, part of a functional group, and contributing to a common goal), and status (i.e., the feeling that they are independent, treated with respect, taken seriously, and have influence) that they received from family, friends, partners, and colleagues during the pandemic. The dissatisfaction that occurred largely around affection and behavioral confirmation from friends seems aligned with the observed network shifts away from friendships. The dissatisfaction with status received from family despite network shifts toward family members may suggest that those social support needs are not being met during the pandemic. In terms of emotional well-being, the majority of respondents reported negative mental health impacts, negative physical activity impacts, and feelings of social isolation. This is likely due to a reliance on virtual socialization and virtual mobility during the pandemic. As such, intervention policies should look for ways to improve feelings of social connection and incentivize the maintenance of mental and physical health for young adults during the pandemic.
Figure 3. Pandemic Impact on Health and Relationships
Qualitative impacts of the pandemic on social support are shown in Figure 4. The majority of respondents felt satisfied with the level of affection, behavioral confirmation, and status they received during the pandemic. In terms of affection, the greatest number of respondents were satisfied with that provided by family members, followed by friends, intimate partners, and colleagues. In terms of behavioral confirmation, the greatest number of respondents were satisfied with that received from family, followed by intimate partners, friends, and colleagues. In terms of status, the greatest number of respondents were satisfied with that received from friends, followed by family, intimate partners, and colleagues. Where dissatisfaction occurred, it was mostly around a lack of affection received from friends, a lack of behavioral confirmation received from friends and a lack of a sense of status received from family members .
Figure 4. Satisfaction Across Social Support Dimensions
Physical Versus Virtual Mobility
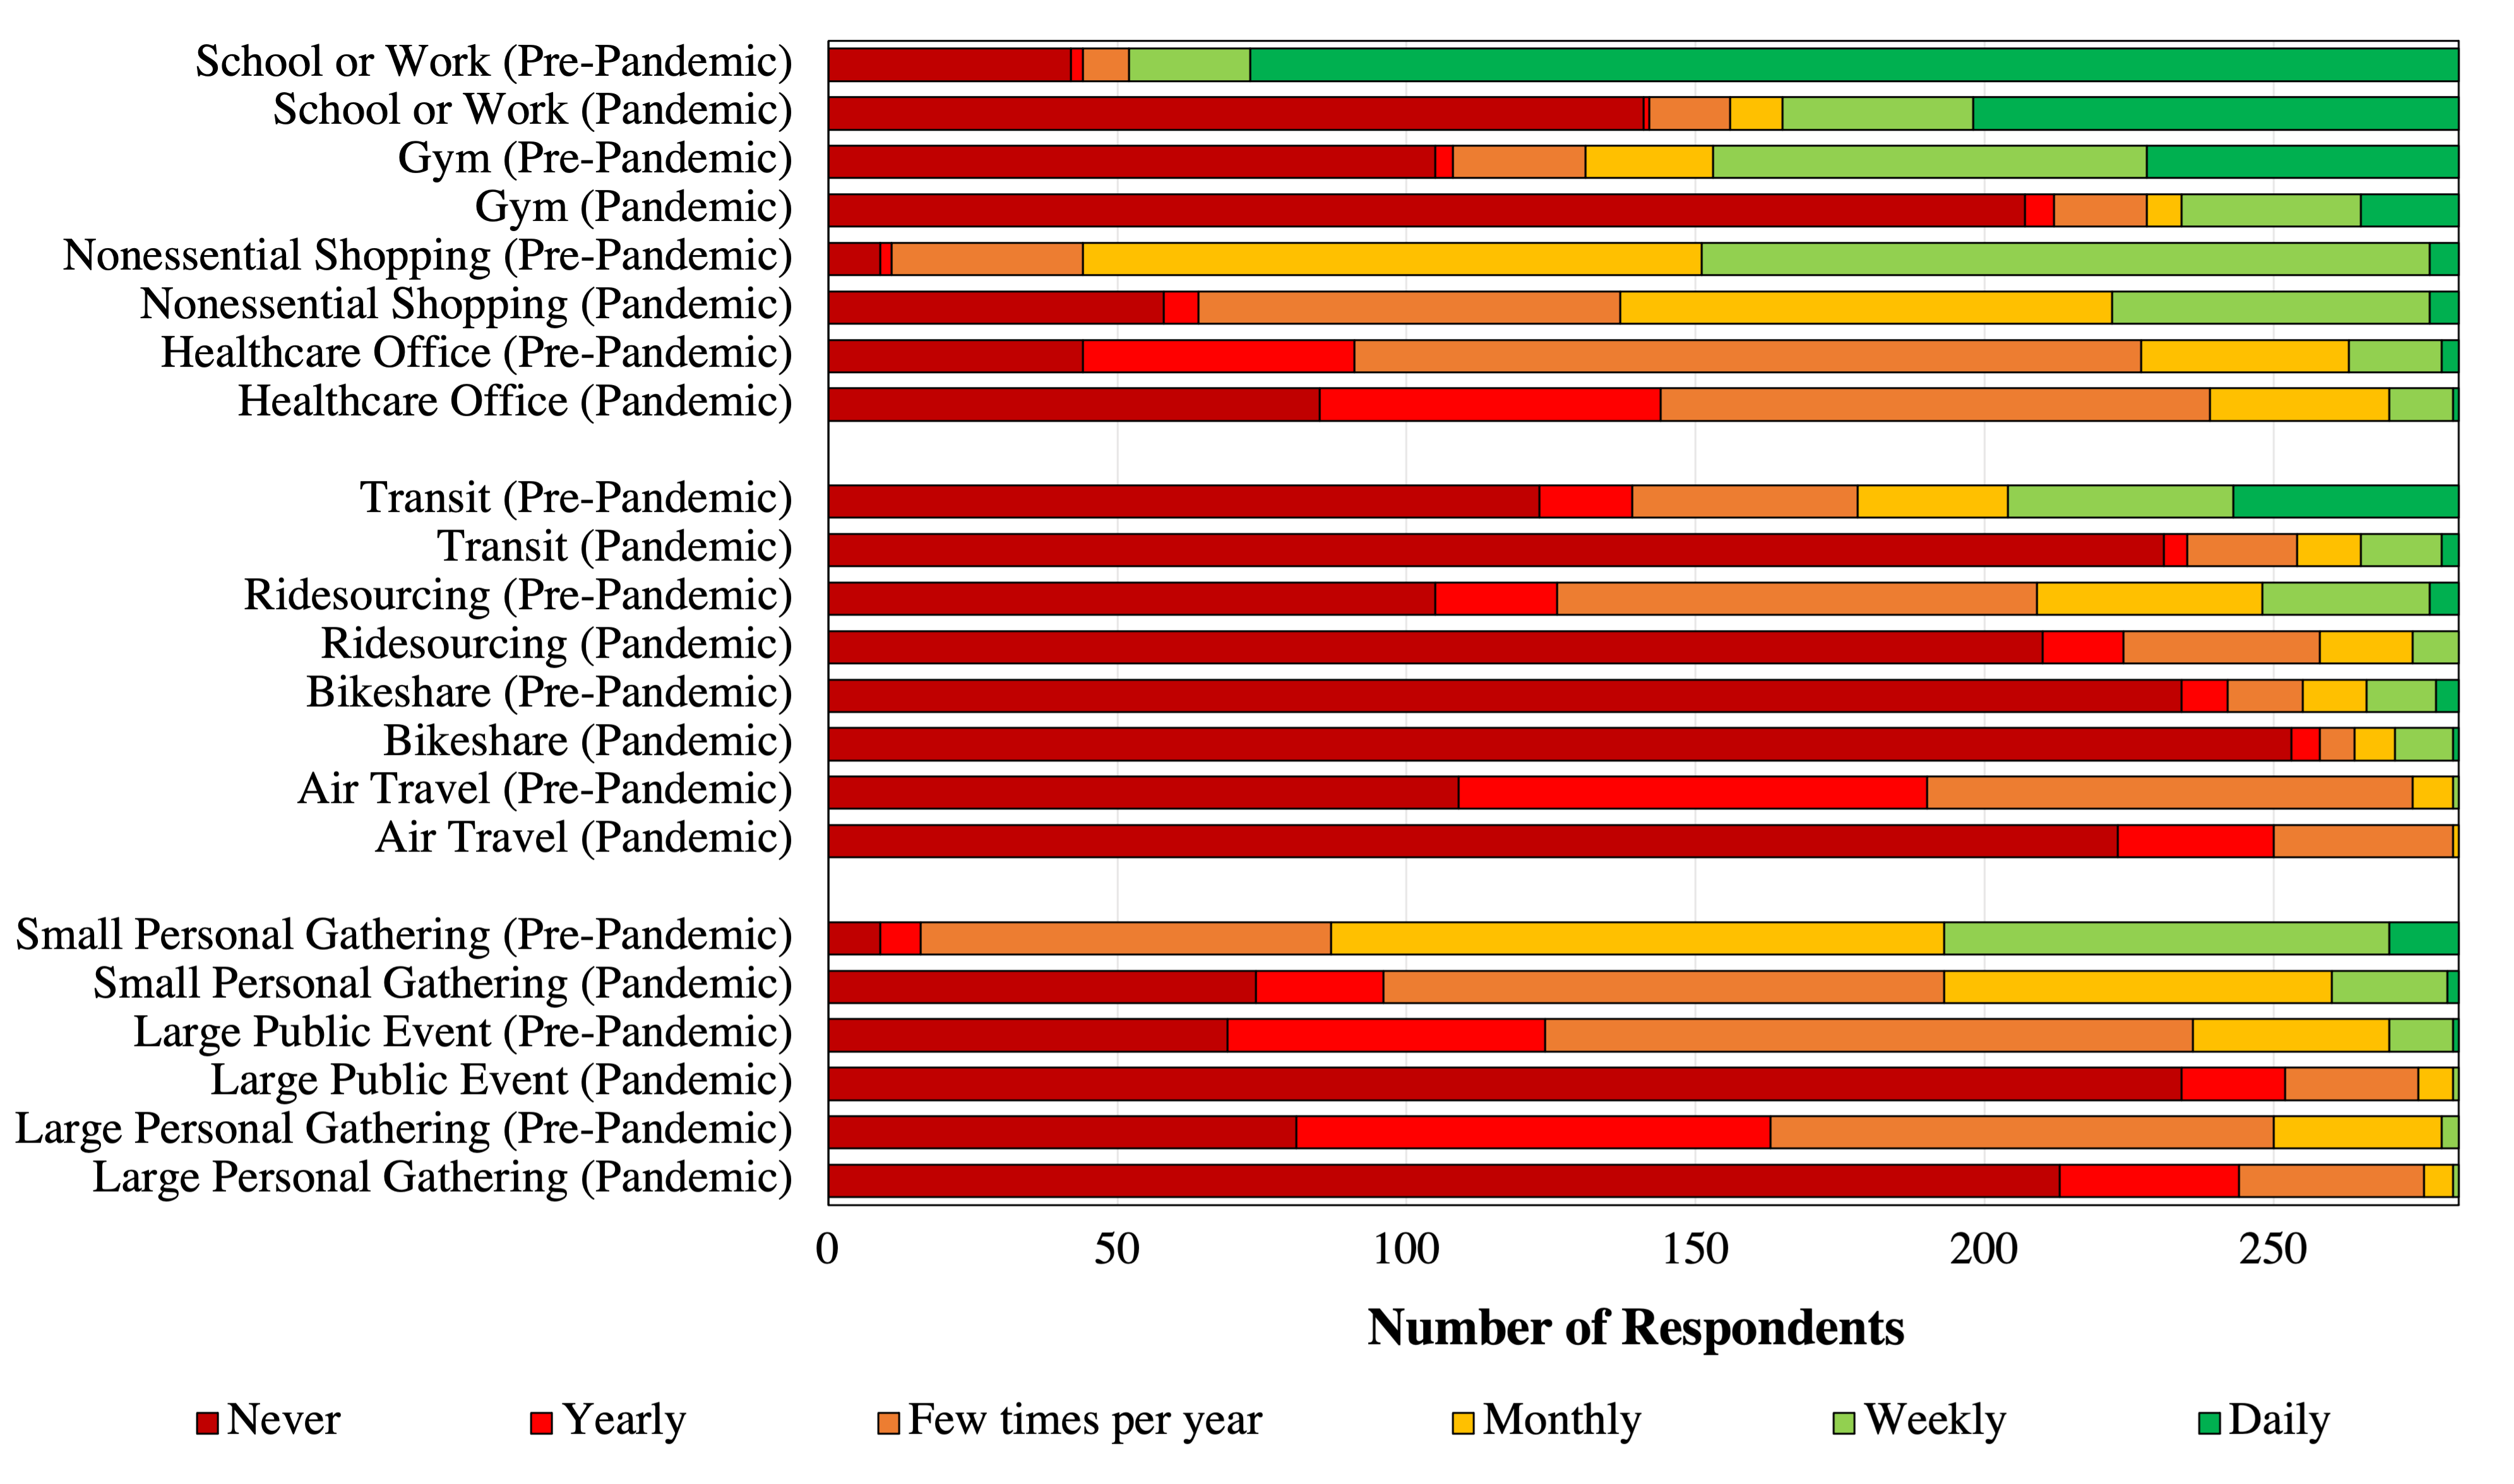
Changes in the annual frequency of 11 in-person travel activities are shown in Figure 5. On average physical travel decreased for all 11 activities examined. Most notable were decreases in public transportation use and social gatherings. Overall, respondents were satisfied with conducting mandatory travel (e.g., working and shopping) remotely, but virtual mobility does not appear to be a satisfactory substitute for interpersonal activities (such as celebrating holidays, meeting new people, volunteering, or having spontaneous conversations) or more physically engaging activities like touring new places or exercising. Barriers to virtual socialization highlighted difficulties with internet connection, as well as time constraints, slowness, and lags. The most commonly experienced technological challenge was not having access to personal technological equipment. The most common downside to using virtual technology for social support was spending too much time on devices. Overall, respondents felt that virtual mobility provided convenience, ease of use, and comfort at the cost of losing physical touch, closeness, and intimacy.
Figure 5. Annual Frequency of In-Person Travel Activities
Satisfaction with remote substitution for in-person activities is shown in Figure 6. Overall, the only two remote activities reported to be better than the in-person alternatives were working (40%) and shopping (34%). The least satisfying remote alternatives reported were celebrating holidays (79%) followed by traveling/tourism (78%), meeting new people (64%), volunteering (63%), maintaining existing relationships (57%), being a student (56%), exercising (55%), spontaneous conversations (53%), practicing spirituality (49%), and accessing healthcare (48%).
Figure 6. Satisfaction with Virtual Alternatives Versus In-Person Activities
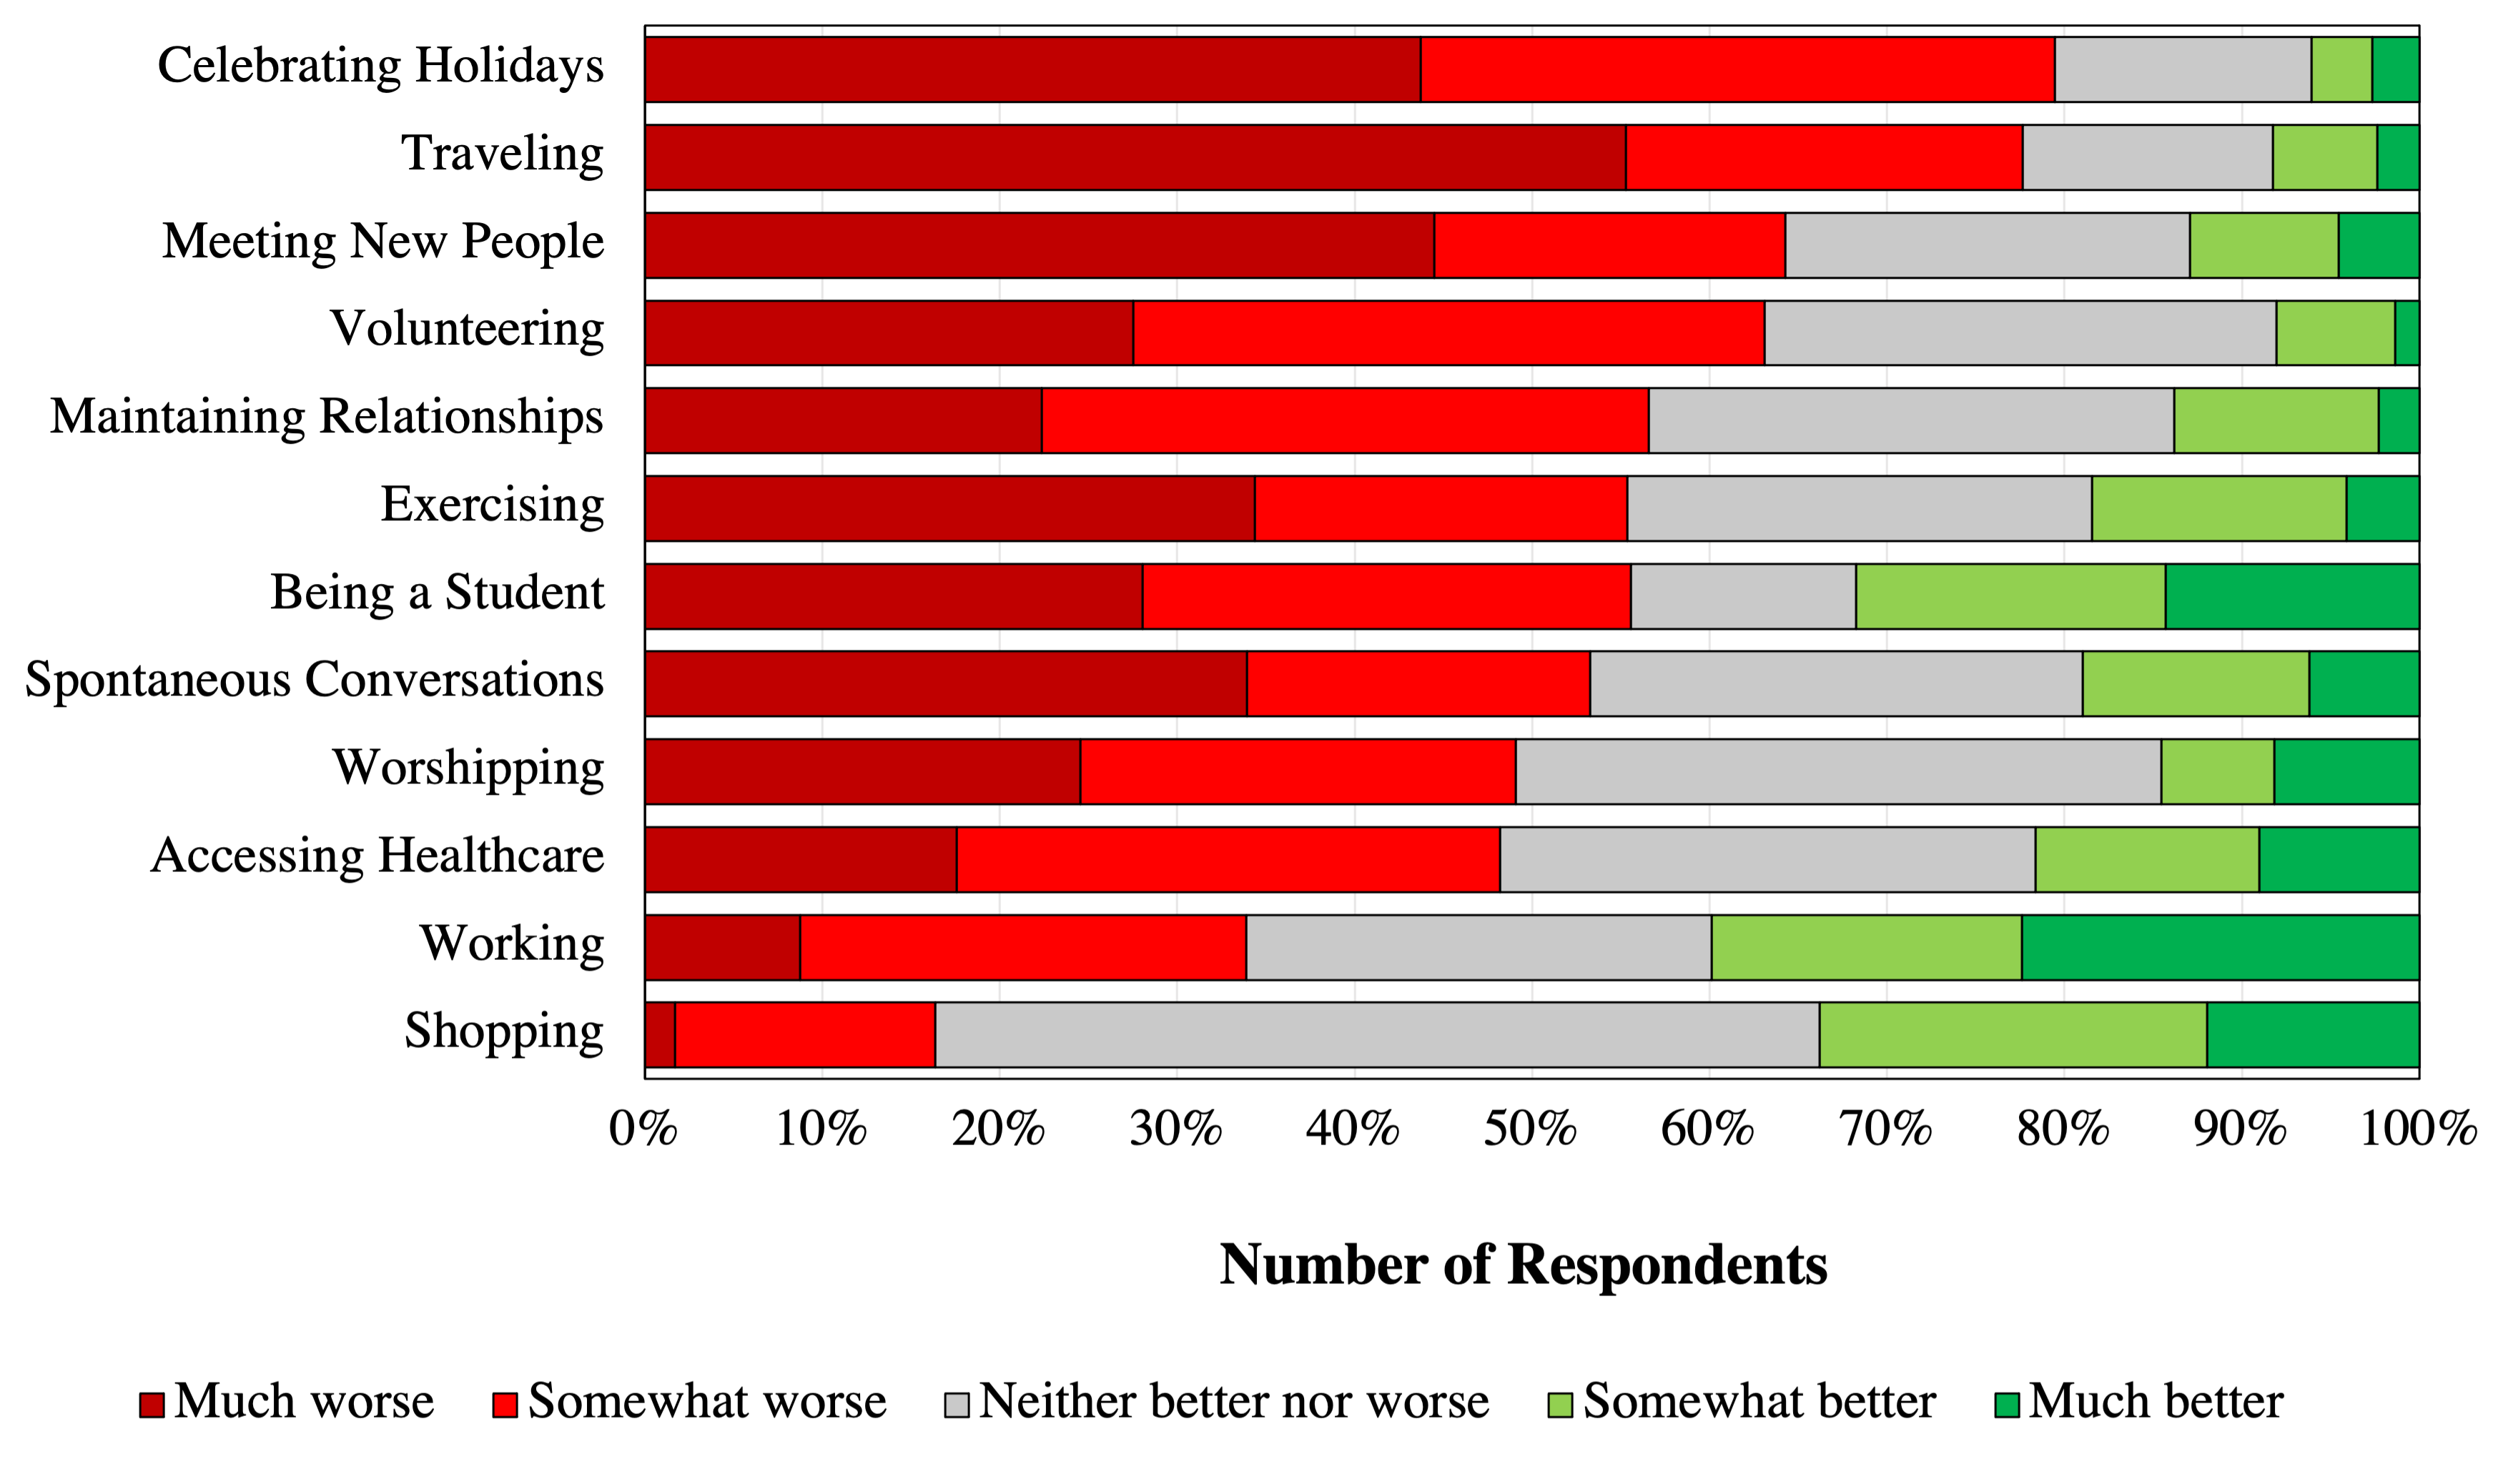
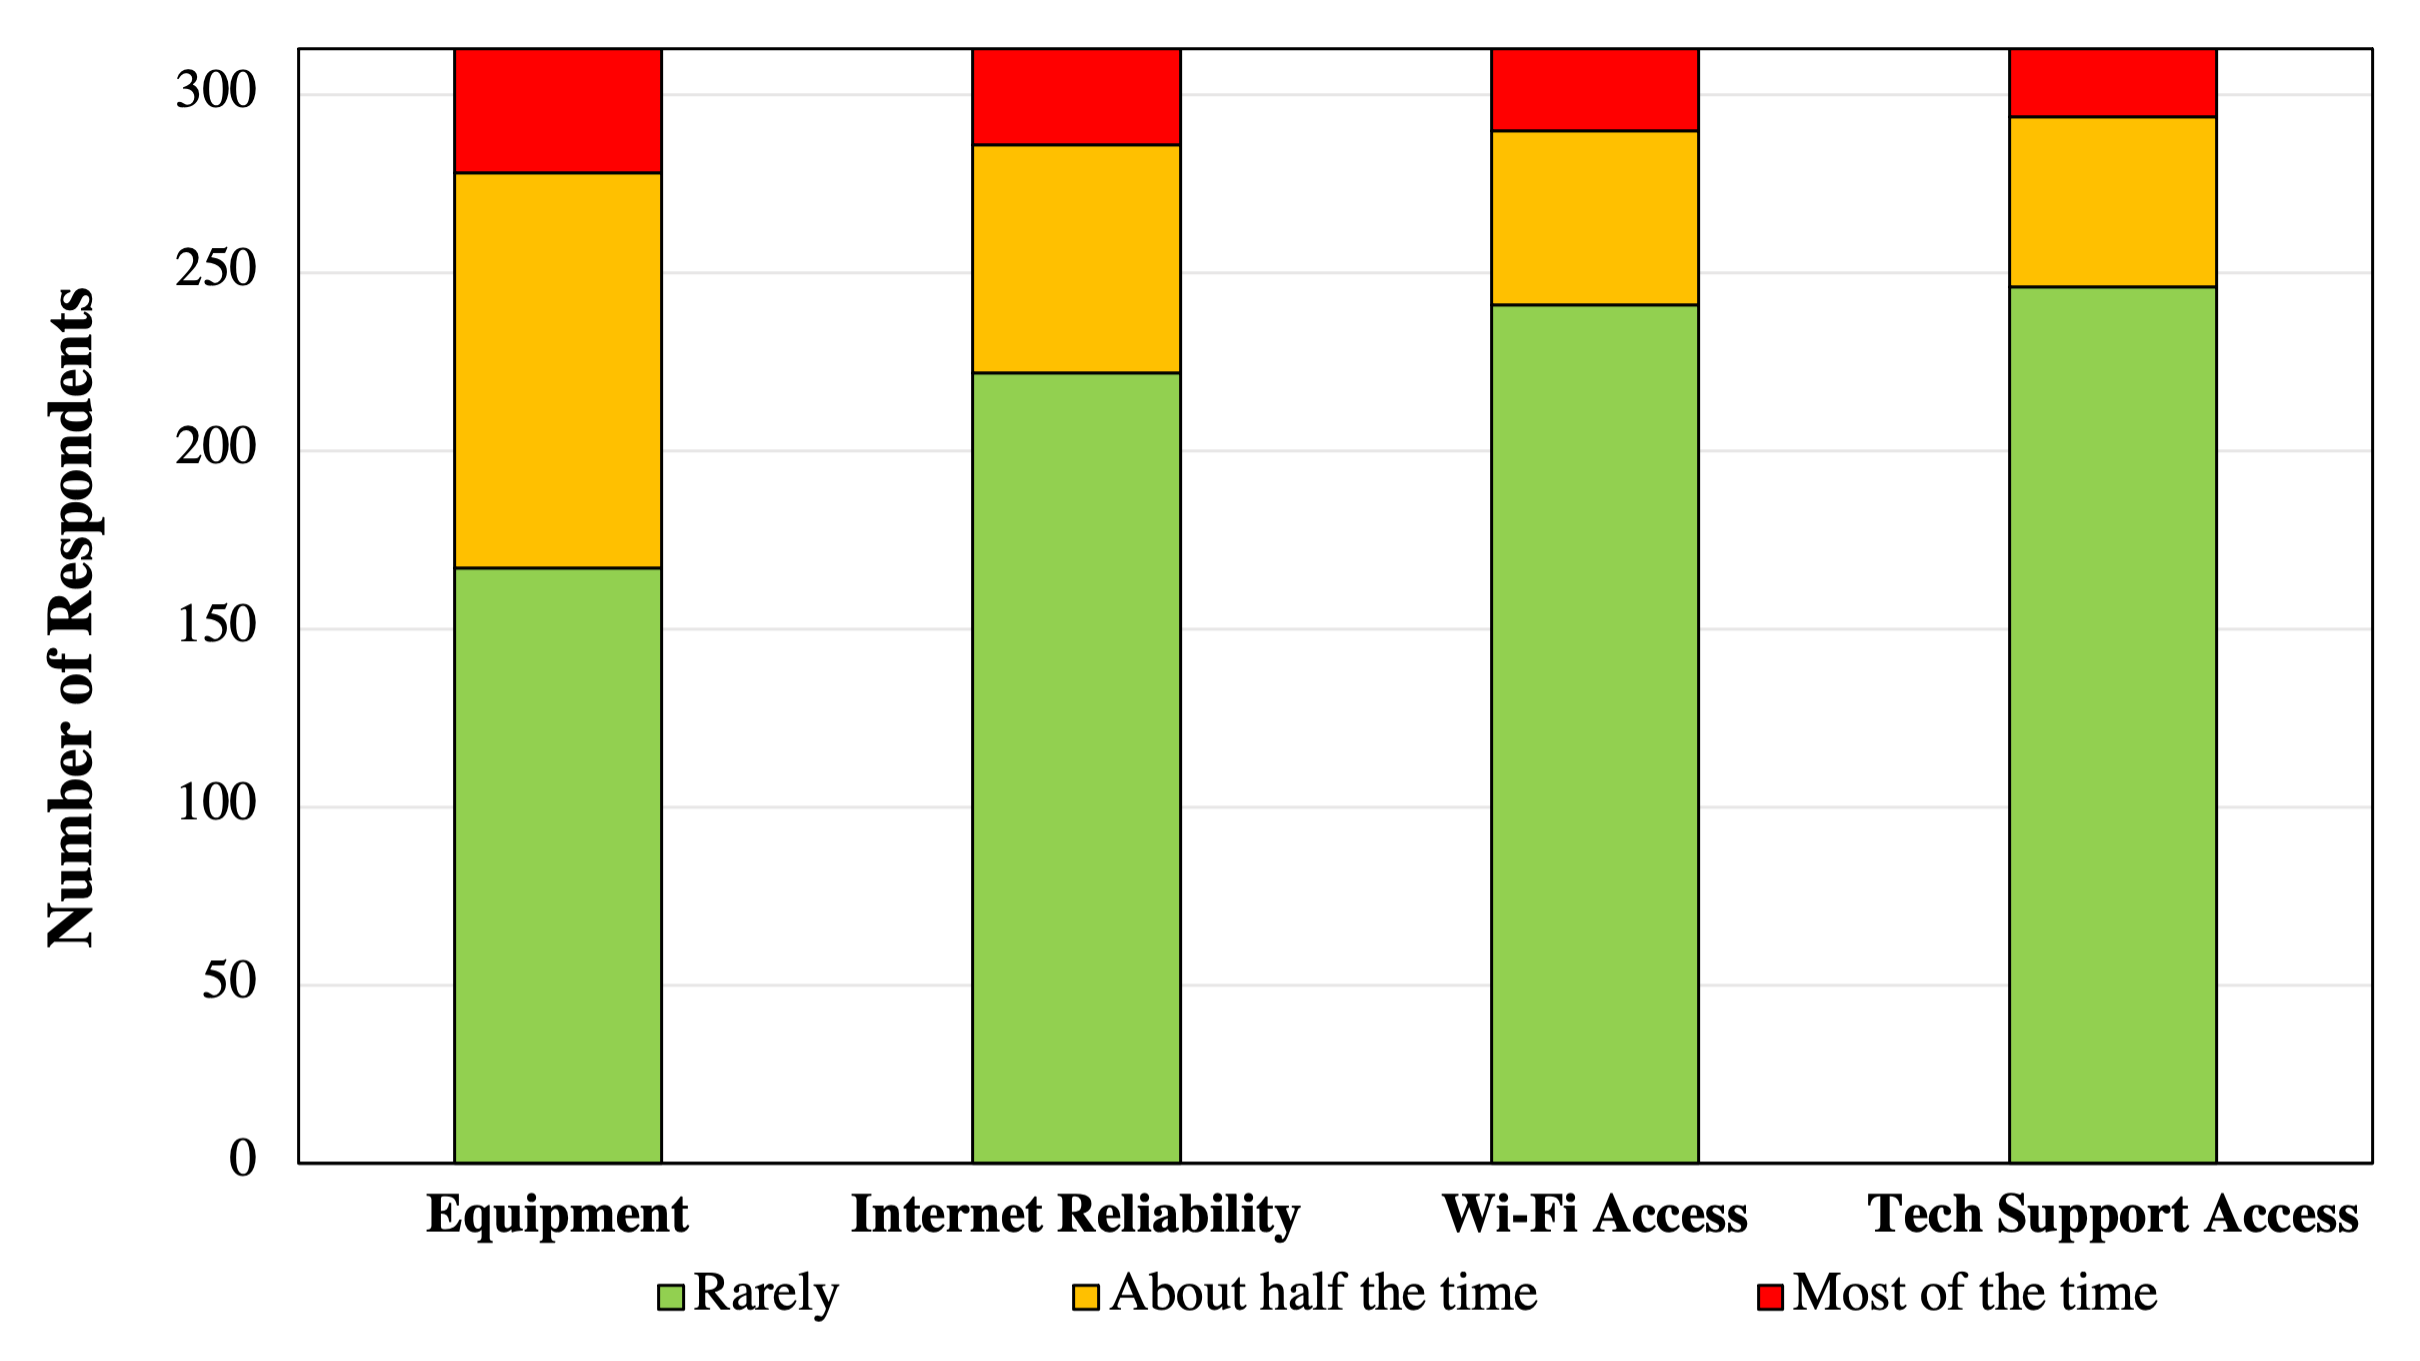
Figure 7 depicts a ranking of technology challenges experienced by respondents. Of those examined, the most ubiquitous challenge was access to equipment, internet reliability, Wi-Fi access, and access to tech support. It is important to note that this survey of young adults was conducted online, so a sampling bias exists favoring those with access to technology.
Figure 7. Technology Challenges Experienced During the Pandemic
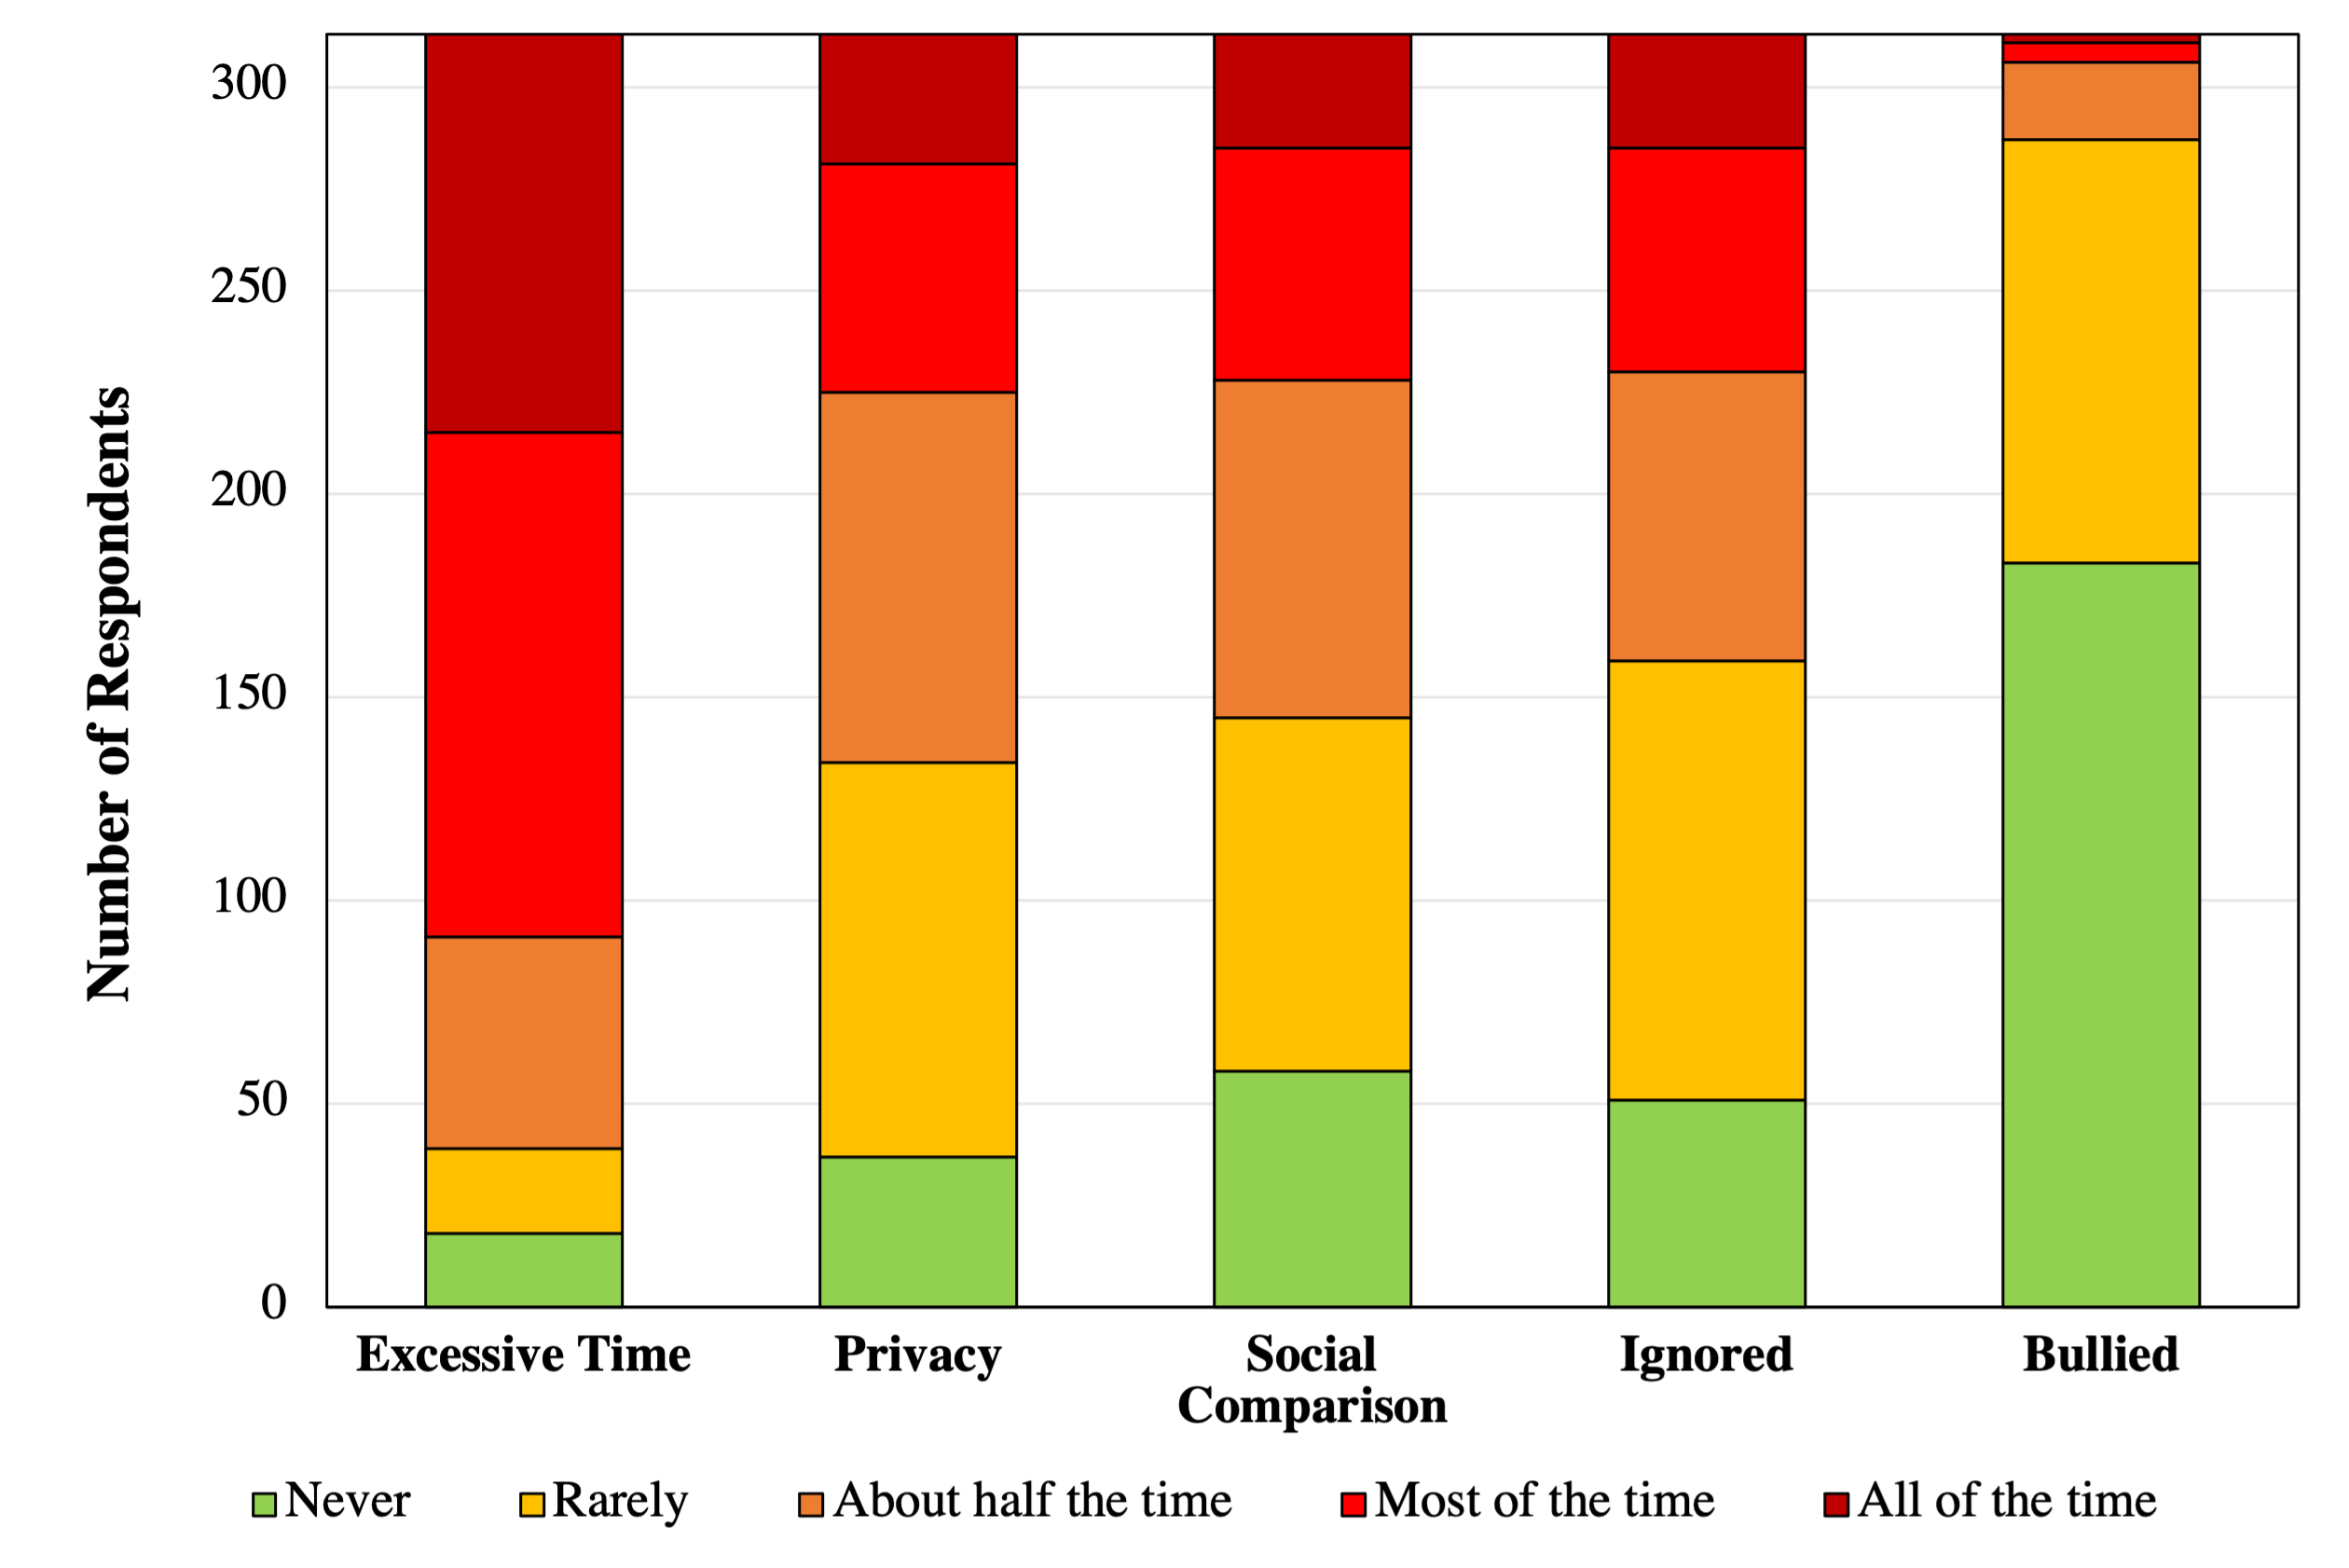
The downsides to using technology for virtual social connection are ranked in Figure 8. The greatest downside was excessive time spent on devices, followed by privacy concerns, social comparison, feeling ignored, and being bullied.
Figure 8. Downsides to Virtual Connection Experienced During the Pandemic
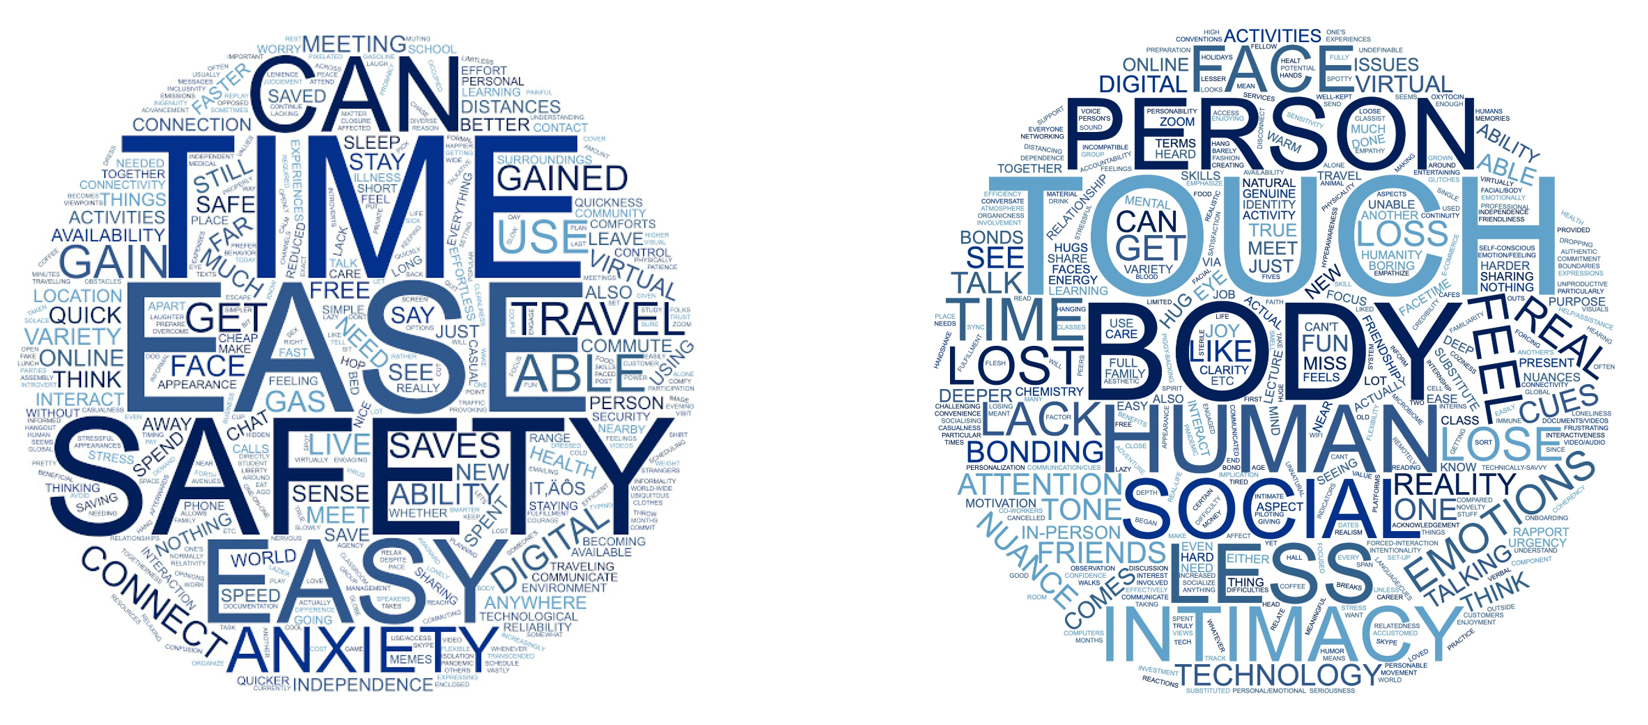
Three open-ended questions were used to learn more about gains, losses, and barriers to using technology for virtual social support. Word clouds were generated to represent the frequency of terms reported in response to these three questions, as shown in Figure 9. The most frequent words used by respondents are identified below to provide the general, overarching idea of the concepts most readily accessible in the minds of respondents. However, one of the greatest limitations of using word clouds is that the larger context would be required to provide a more detailed understanding of the ideas shared by respondents. Future work will examine entire statements to provide the necessary context, but that is beyond the scope of this report. According to respondents, the main gains to using virtual technology for social connection were: convenience, time, ease, safety, comfort, anonymity, and flexibility. The main losses include: connection, physical, interaction, touch, personal, contact, “body”, closeness, and intimacy. Barriers to using virtual technology were: Internet, connection, time, Wi-Fi, hard, lag, and slow.
Figure 9. Word Clouds Showing Virtual Socialization Gains, Losses, and Barriers
Third Places: Physical and Virtual
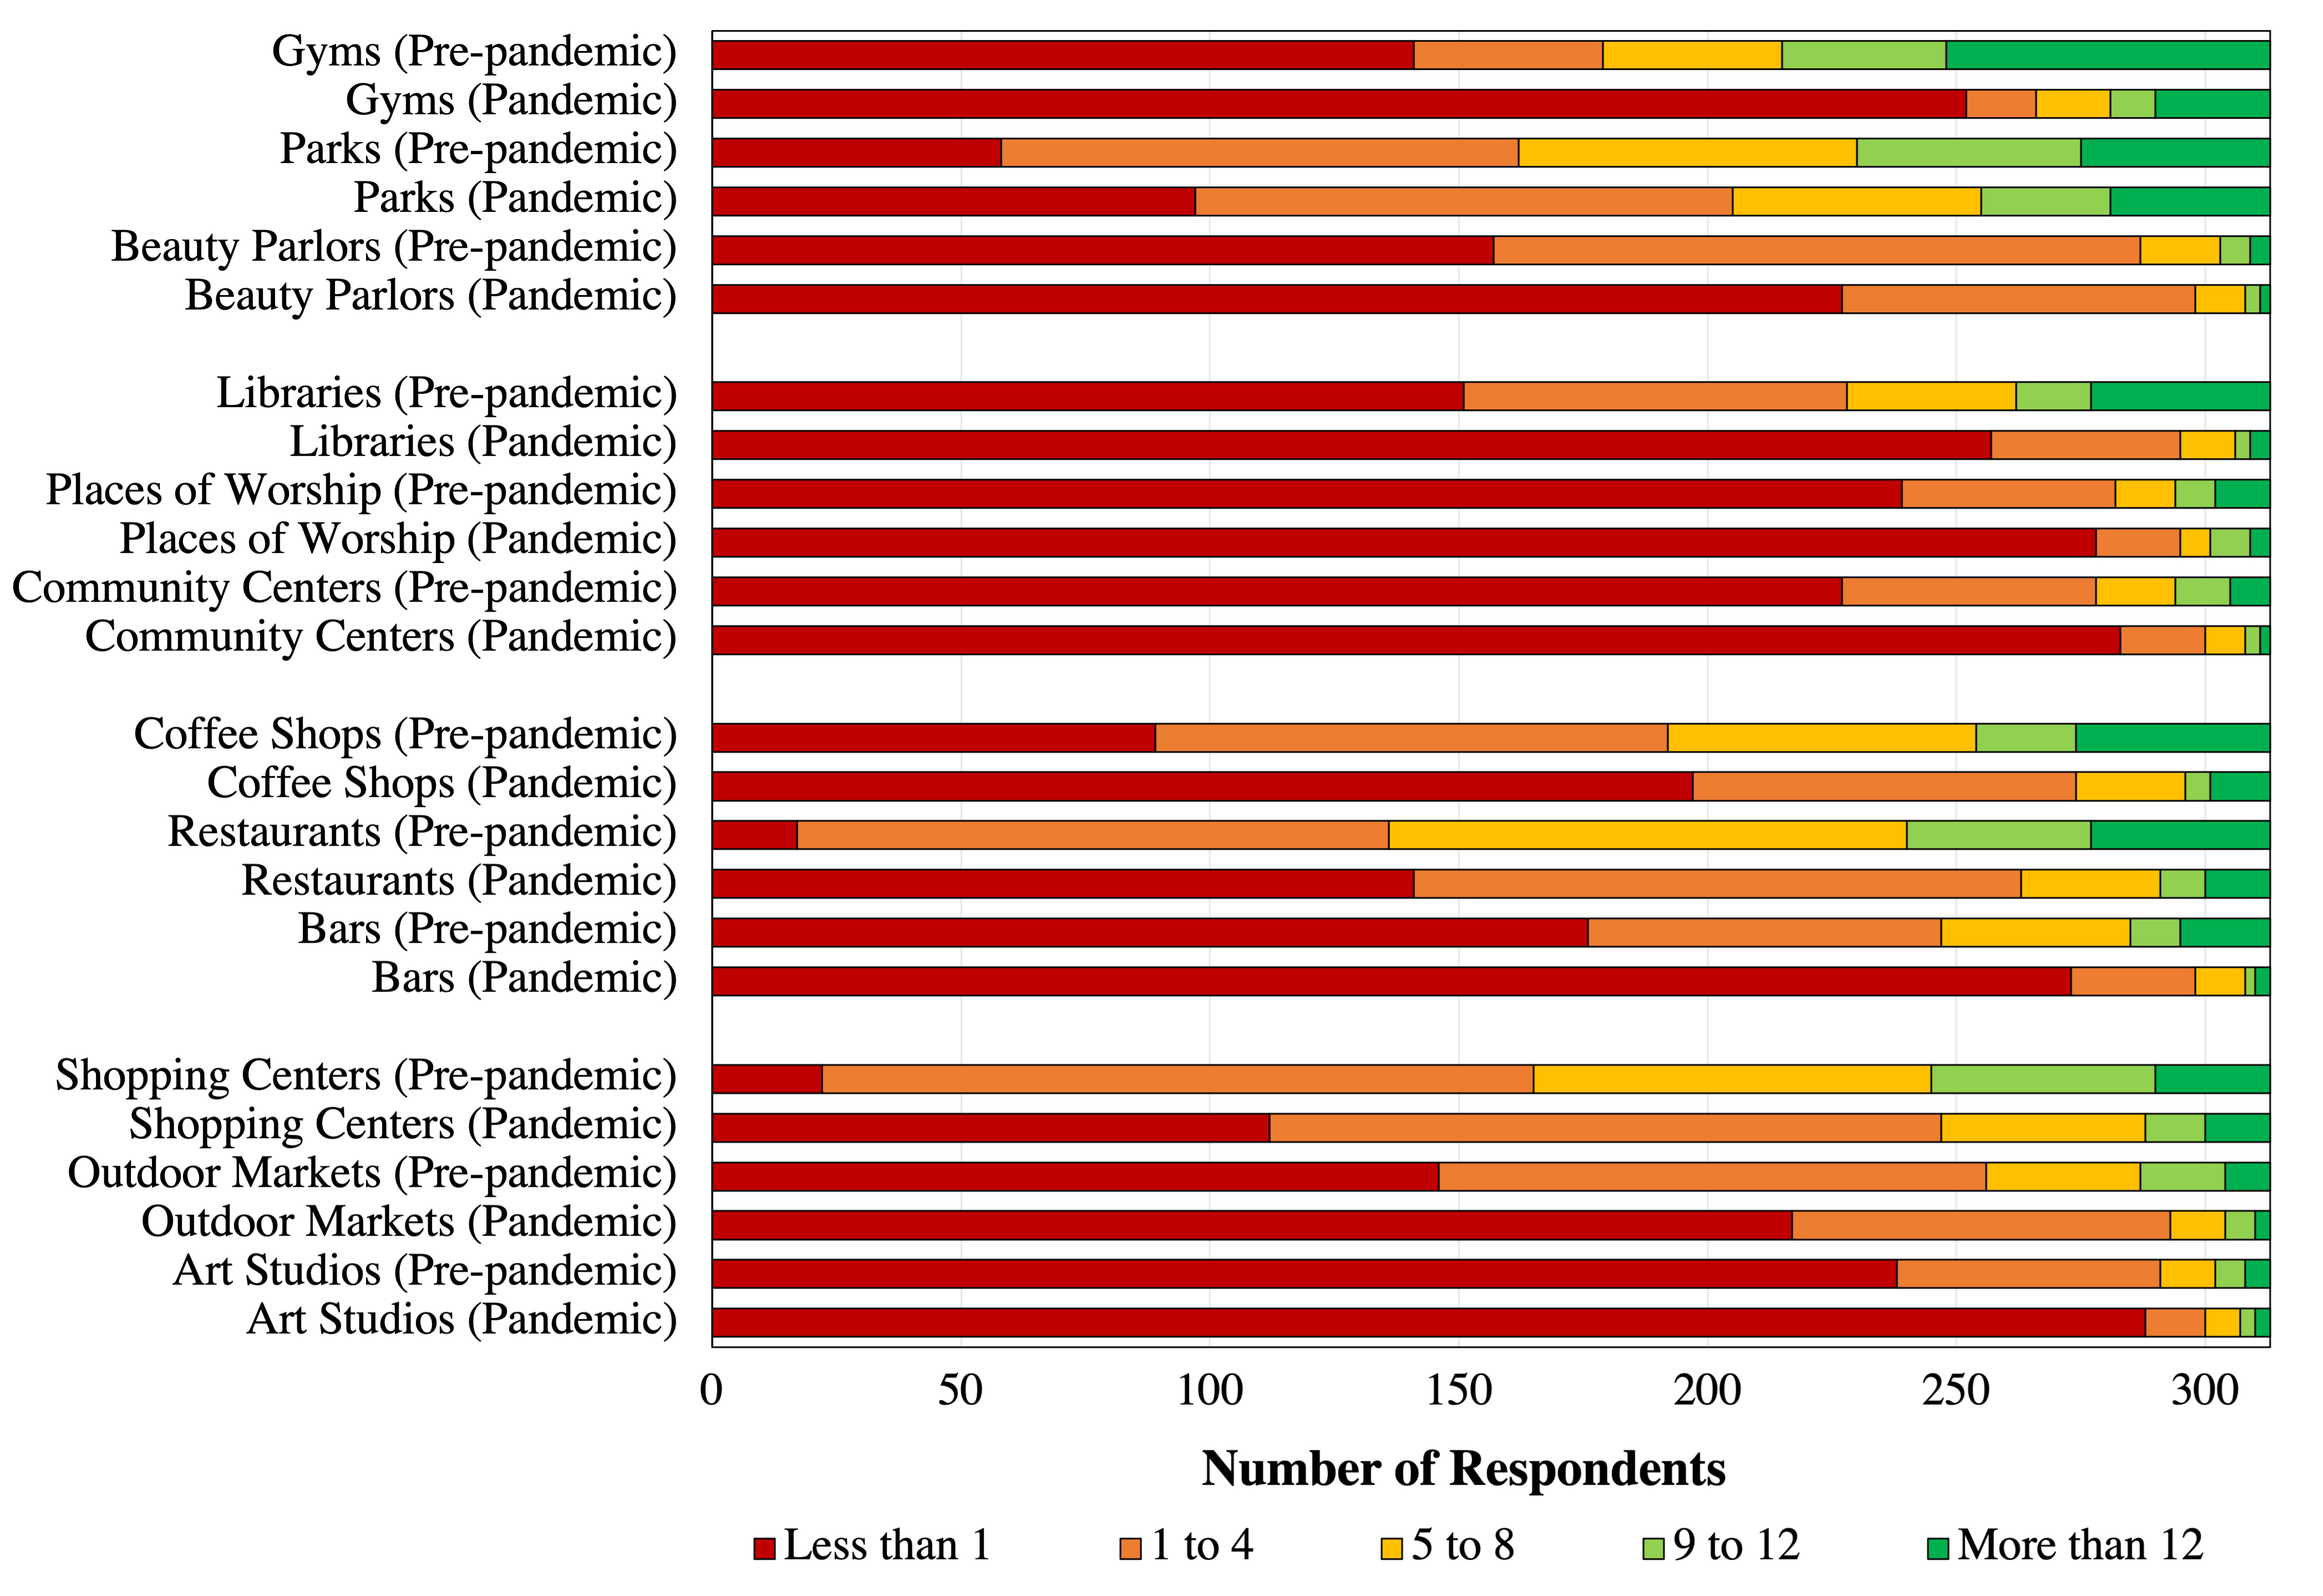
Third places refer to social places that are beyond the “first place” (i.e., the home) and the “second place” (i.e., the workplace) (Oldenburg & Brissett, 198219). Changes in monthly frequency of visits to a physical third place are shown in Figure 10.
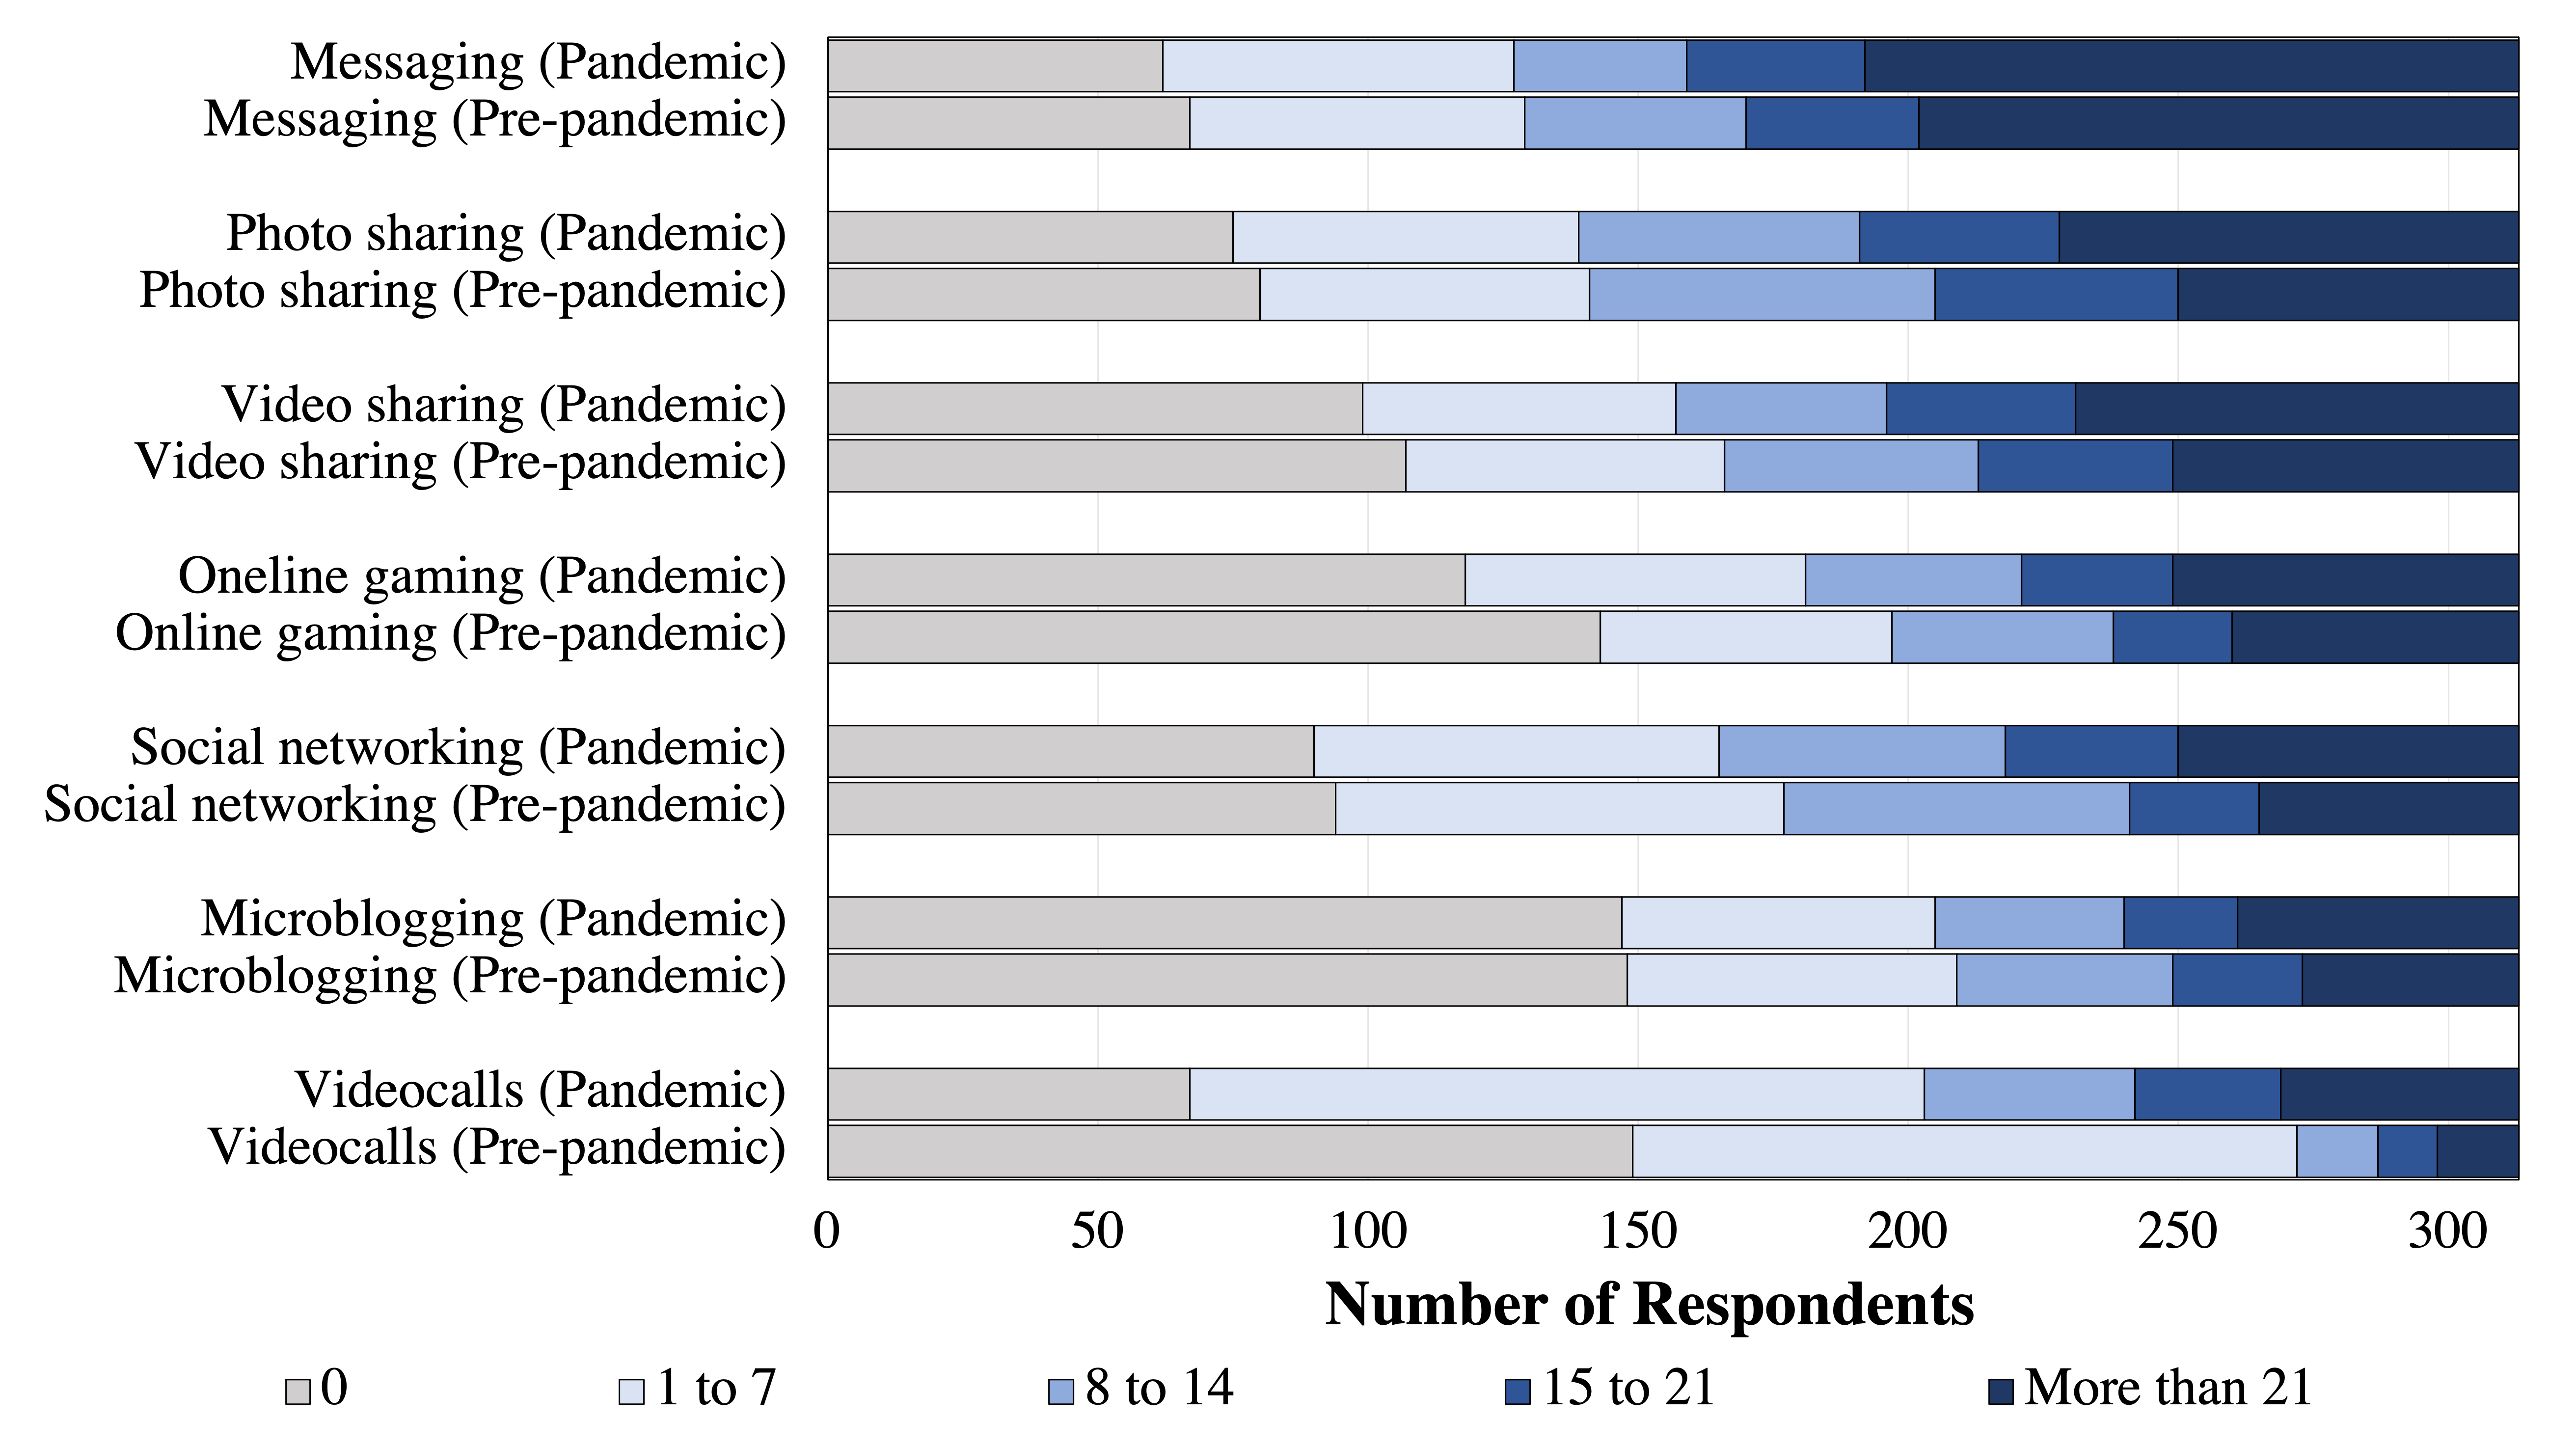
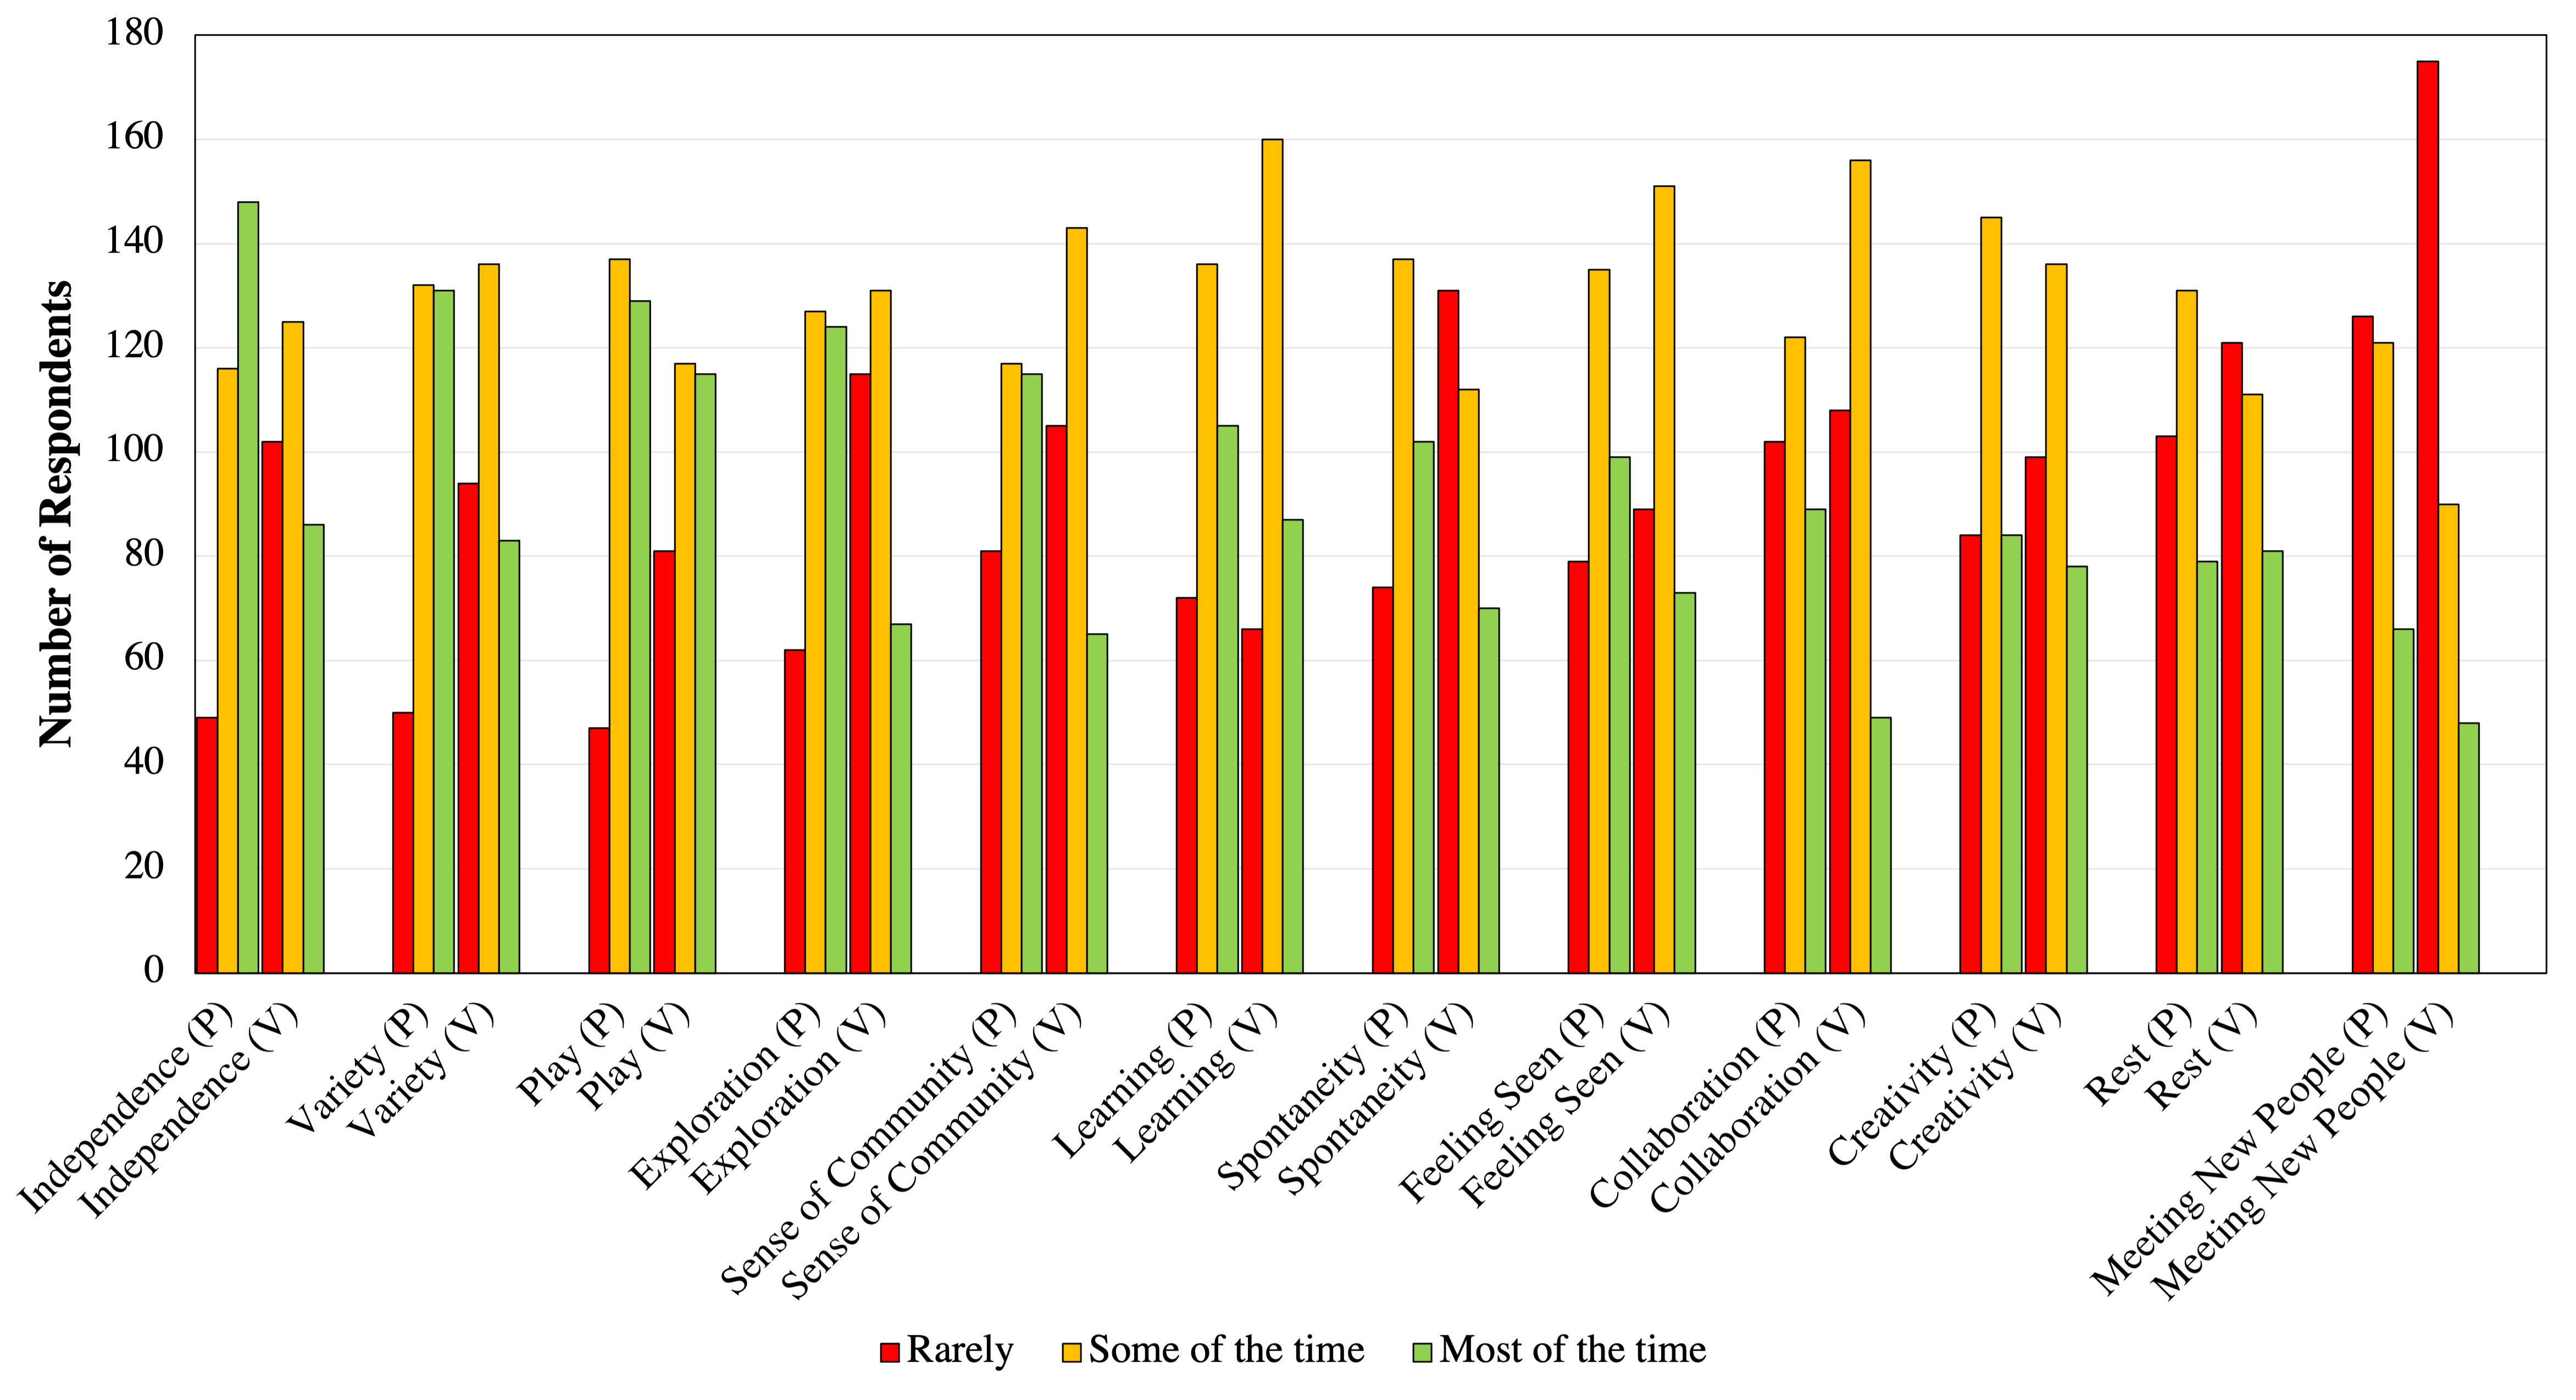
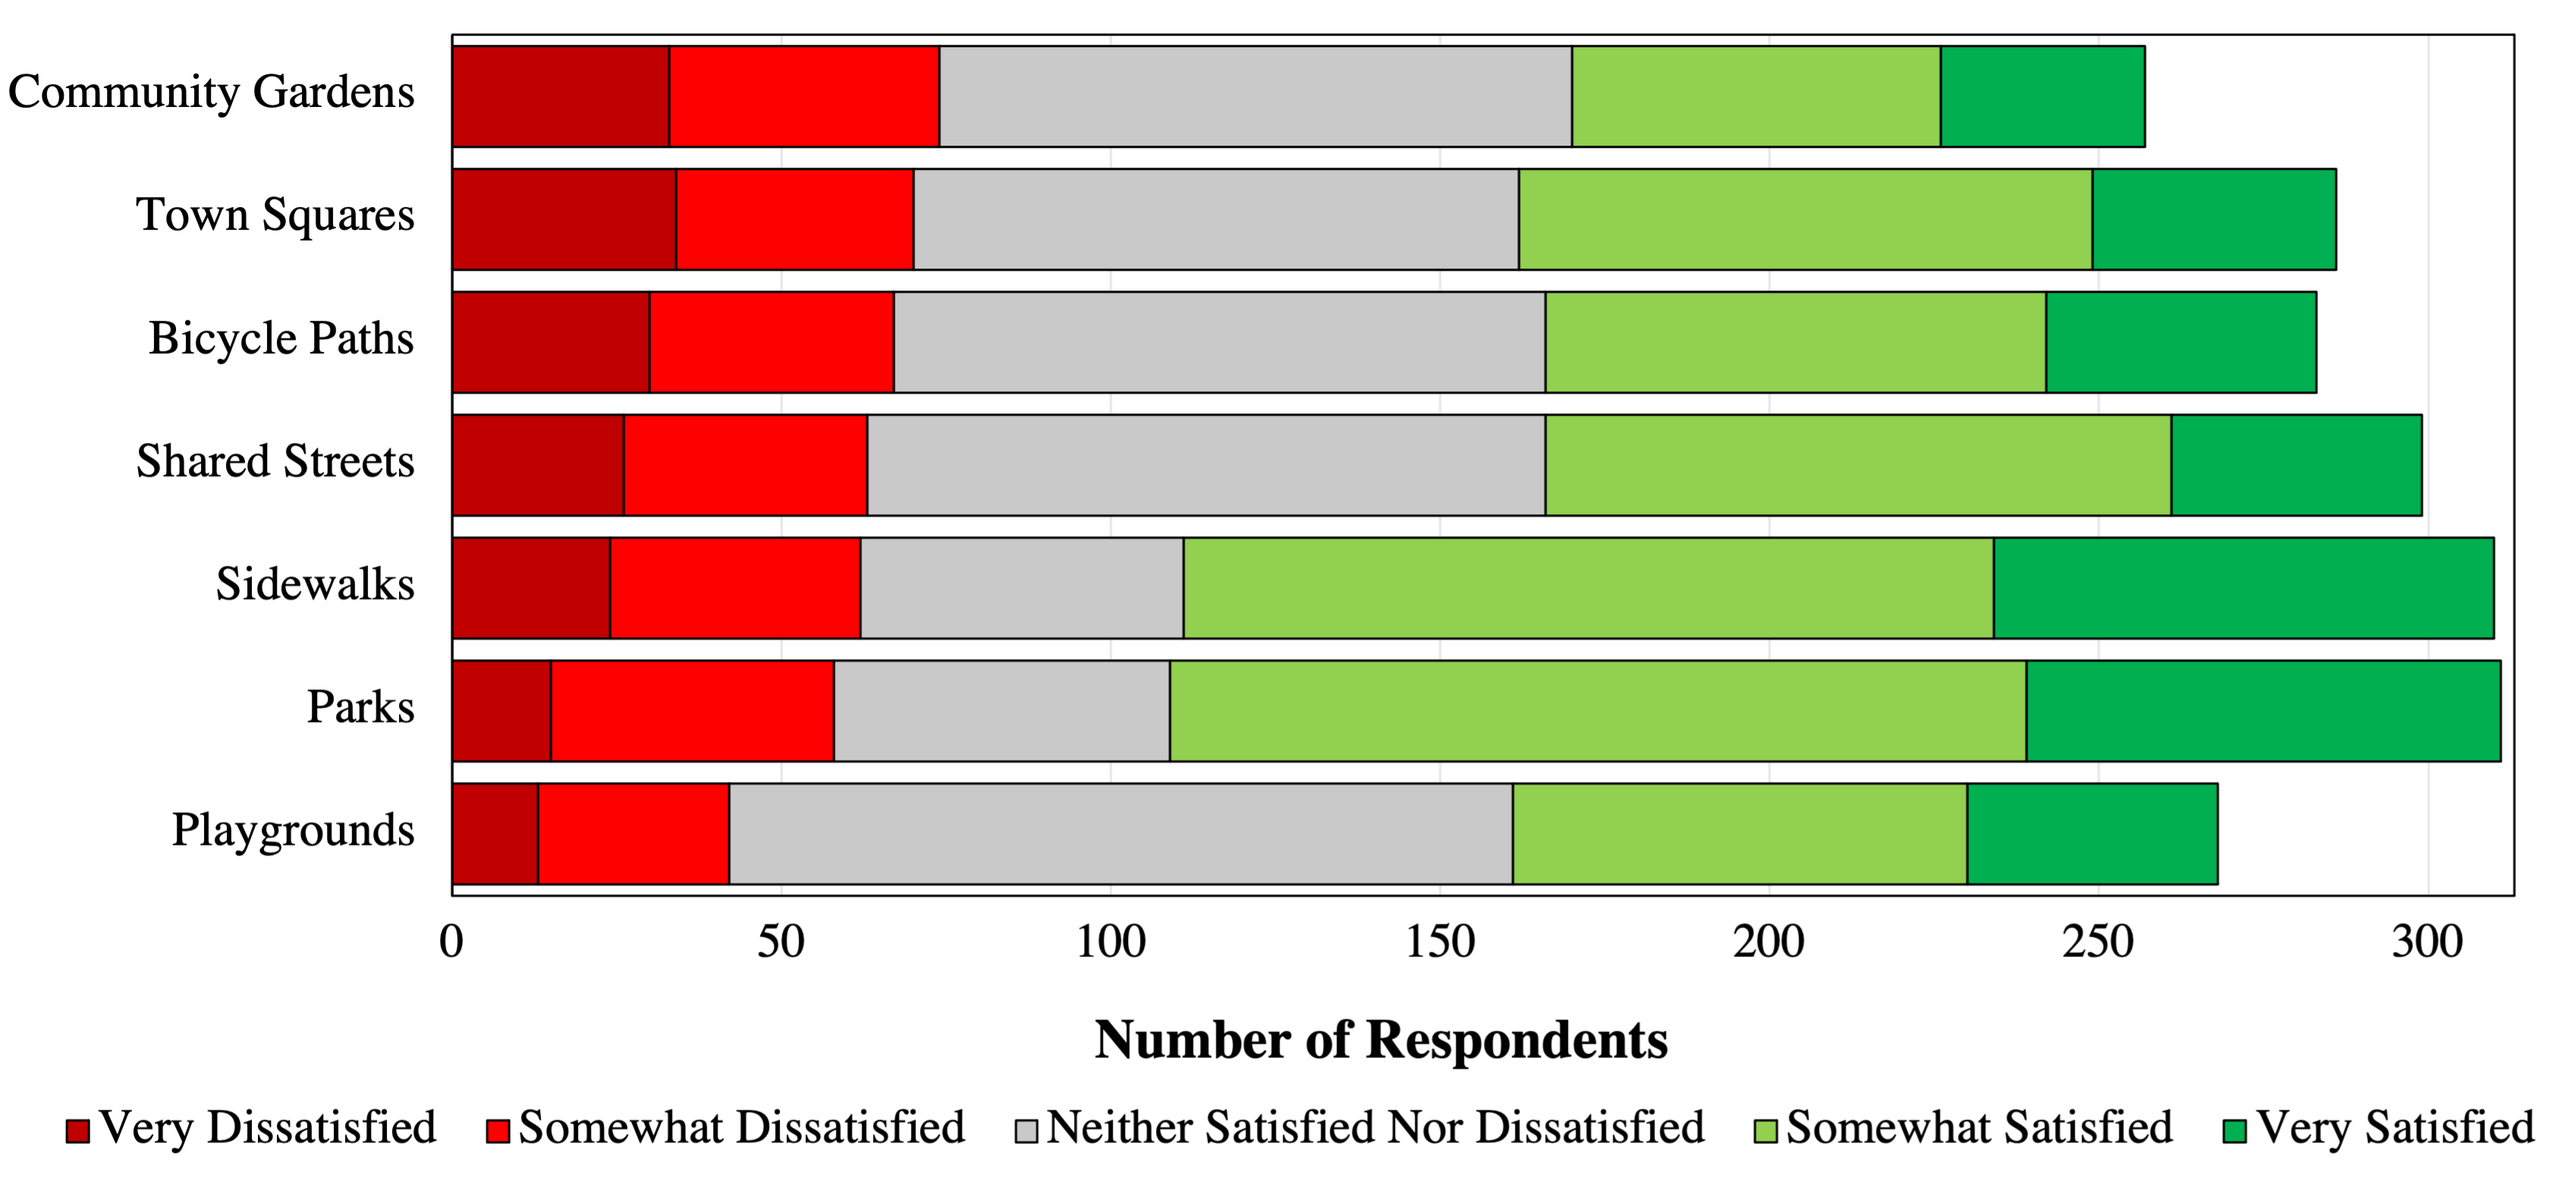
Monthly travel to physical third places decreased during the pandemic across all 12 of the examined venues, including libraries, gyms, restaurants, bars, and coffee shops. During the pandemic, respondents shifted toward virtual mobility and socialization largely using video calls, as well as slightly more online gaming, social networking, and video sharing. However, except for rest, virtual mobility was worse at meeting basic human needs than physical third places. Notably, needs for exploration, collaboration, sense of community, independence, and variety were better met by physical places. Therefore, virtual mobility appears to be a satisfactory substitute for mandatory travel but fails to meet human needs to the same extent as physical travel to third places. This suggests there may be something inherent in the structure of physical places that virtual technology has yet to replicate. The majority of respondents were satisfied with the outdoor public spaces available to them, although the most significant improvement was desired for community gardens and town squares. While the majority of respondents felt welcome and safe from harm in the outdoor spaces available to them, more could be done for some respondents, especially in terms of safety.
During the pandemic, respondents reported decreased frequency of visits to all 12 venue types examined, including monthly reductions in visits to libraries (56%), gyms (53%), restaurants (51%), bars (50%), coffee shops (49%), shopping centers (39%), outdoor markets (36%), community centers (35%), beauty parlors (25%), art studios (24%), places of worship (23%), and parks (20%).
Figure 10. Monthly Frequency of Visits to Physical Third Places
Changes in the weekly frequency of using a variety of virtual technologies are shown in Figure 11. Across all seven categories, the average times per week that virtual technologies were used increased during the pandemic. The greatest increase was observed for video calls (115%), followed by online gaming (17%), social networking (13%), video sharing (10%), microblogging (7%), photo sharing (6%), and text messaging (4%).
Figure 11. Weekly Frequency of Virtual Technology Use
While travel motivations are often considered in research to be extrinsic, some researchers have examined intrinsic motivations (i.e., autotelic, hedonic, and experiential), noting that the desire to satisfy needs motivates people to act and physically move about to meet those needs (Mokhtarian et al., 201520). Twelve travel motivations reflecting basic human needs as satisfied by physical third places and virtual technologies are shown in Figure 12. Comparing the performance of virtual spaces and physical places in meeting these needs, we see that human needs are met most of the time for more respondents by physical places as compared to virtual spaces. This was true for all but one of the 12 examined needs. Most notably, needs were reported to be met most of the time by physical mobility by more respondents than by virtual mobility, including exploration (85%), collaboration (82%), sense of community (77%), independence (72%), variety (58%), spontaneity (46%), meeting new people (38%), feeling seen (36%), learning (21%), play (12%), and creativity (8%). Rest was reported as being met most of the time by virtual space for 3% more respondents than by physical places. Eleven of the 12 examined human needs were reported as being met rarely by virtual infrastructure for more respondents than by physical infrastructure, most notably for independence (an increase in respondents of 108%; i.e., 102 compared to 49), variety (88%), exploration (85%), spontaneity (77%), play (72%), meeting new people (39%), sense of community (30%), creativity (18%), rest (17%), feeling seen (13%), and collaboration (6%). Learning was reported as being met rarely by physical space for 9% more respondents compared to virtual space.
Figure 12. Ability of Physical (P) and Virtual (V) Spaces to Satisfy Human Needs
Overall, satisfaction with available outdoor public spaces is shown in Figure 13. Dissatisfaction was most widespread for community gardens (29% of respondents), followed by town squares (25%), bicycle paths (24%), shared streets (21%), sidewalks (20%), parks (19%), and playgrounds (16%). The majority of respondents felt very or somewhat welcome in outdoor spaces (67%), and very or somewhat safe from harm in outdoor spaces (62%). While only 13% felt very or somewhat unwelcome in outdoor spaces, as many as 24% felt very or somewhat unsafe in the outdoor public spaces available to them.
Figure 13. Satisfaction with Available Outdoor Public Spaces
Views on COVID-19 Policies
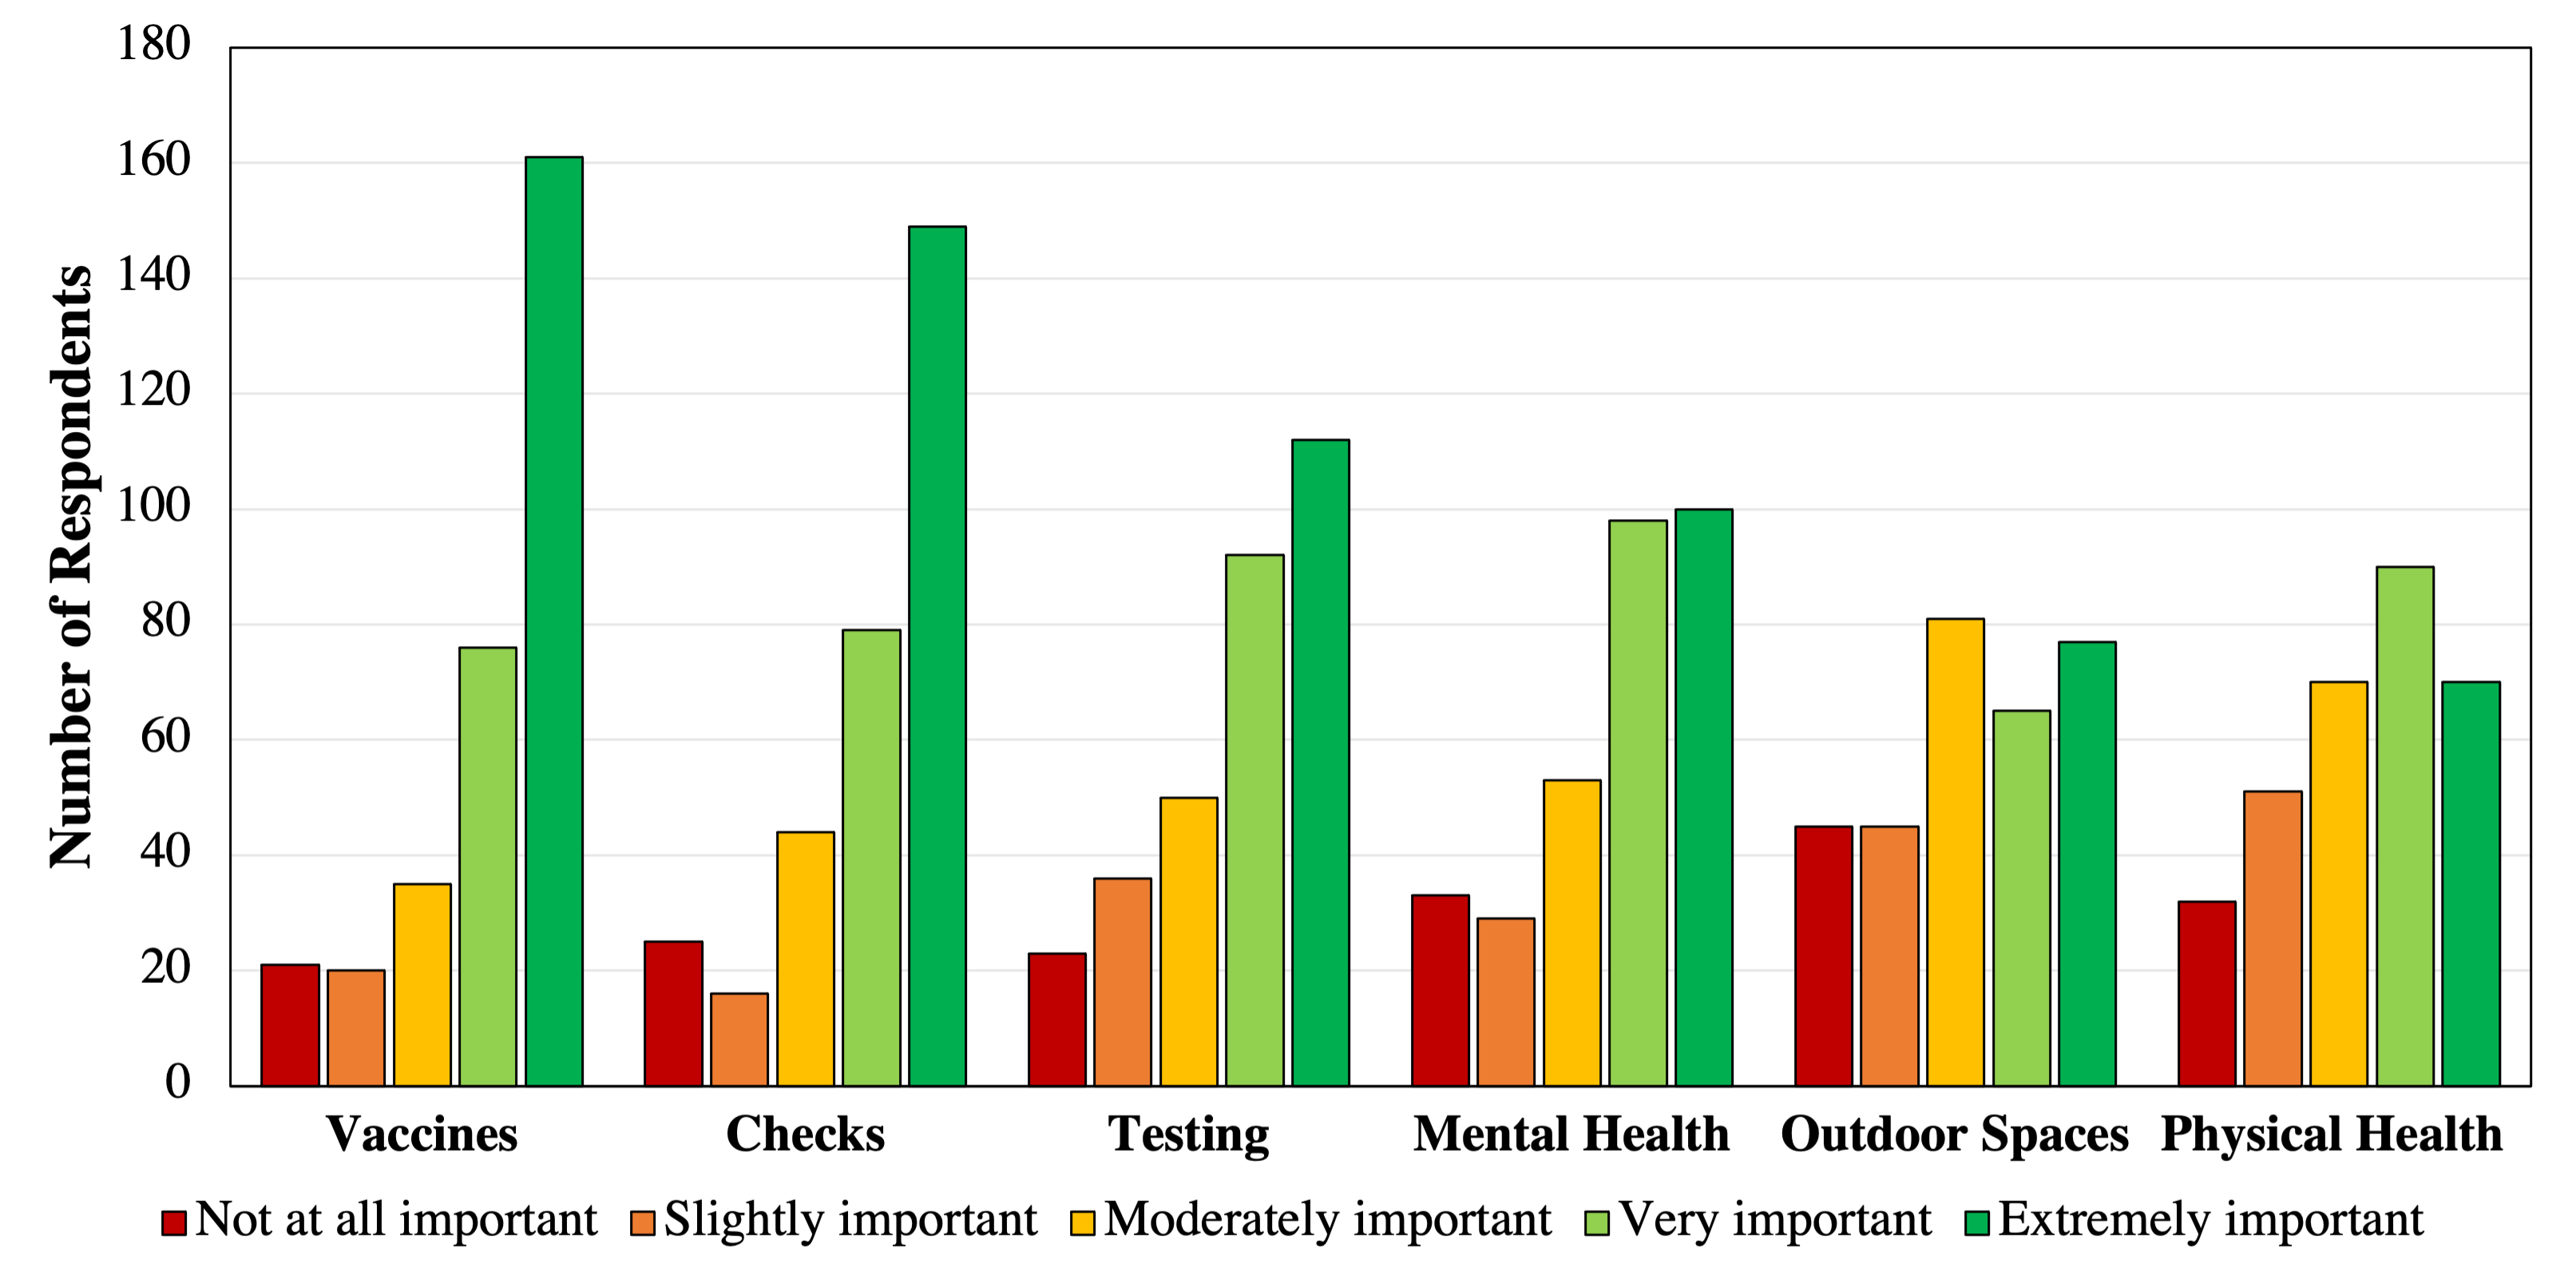
A ranking of policies by importance for providing coping capacity is shown in Figure 14. Of the six proposed policy efforts, the majority of respondents felt that easily accessible COVID-19 vaccines were very or extremely important (76%) followed by regular stimulus checks (73%), easily accessible COVID-19 testing (65%), incentives to engage in mental health practices (63%), incentives to engage in physical health practices (51%), and access to dedicated outdoor social spaces (45%). In terms of the COVID-19 vaccine, 7.5% of respondents had already received at least one dose as of February 2021. Of those remaining, 74% reported they were very or somewhat likely to get the vaccine if it were available to them and 15% reported they were very or somewhat unlikely to get the vaccine. Among them, 46% said nothing would prevent them from getting the vaccine, 32% were concerned about side effects, 11% were concerned about vaccine effectiveness, and 6% were not sure how to access the vaccine.
Optional write-in answers revealed motivations for not being vaccinated related to recommendations not to get it, not trusting the science behind the vaccine, anticipating the need to take time off from school and work to recover from its side effects, general ambivalence about COVID-19, feeling the vaccine was unnecessary, and frustrations about having to wear a mask after vaccination
Figure 14. Importance of Pandemic-Related Policies to Provide Coping Capacity
Summary
This quick response report examines the impact of the COVID-19 pandemic on the social support networks of young adults. A detailed web-based survey using a retrospective name and place generator was developed to reconstruct the strong and weak ties of social support networks. We examined both physical and virtual engagement of young adults with their networks. Data was collected from 313 individuals of ages 18 to 34 years in California, Illinois, and Texas recruited via the Prolific platform. Our preliminary findings reveal numerous impacts of social isolation in terms of changes to social support networks, impacts on emotional well-being, physical versus virtual mobility, and the role of third places in socialization.
Overall, our initial findings suggest that social support networks have decreased in size during the pandemic and shifted away from friends and colleagues toward family and intimate partners, individuals who have been known for long durations, live in close proximity, can communicate in-person, and are racially and politically similar to the respondent. In general, respondents did not find virtual mobility to be a satisfactory substitute for physical mobility with the exception of mandatory travel (i.e., working and shopping). Virtual mobility was reported to be worse at fulfilling human needs and fails to provide physical touch, closeness, and intimacy.
Conclusions
The pruning of social support networks to be condensed around the household unit does not necessarily suggest decreased satisfaction with the social support received during the pandemic. Nevertheless, our findings related to the maintenance and growth of social support networks during the pandemic have important implications regarding long-term pandemic recovery rates. Young people who experience more notable declines in their social support and well-being during the pandemic will likely suffer from reduced access to resources and coping capacity, thereby elongating their pandemic recovery time. Extending this discussion beyond the current pandemic, these findings suggest that some young adults will shoulder a great proportion of burdens if elements of virtual lifestyles are retained. The importance of physical third places for meeting needs provides some guidance for the prioritization of funding for urban spaces, as well as the need for policies and the redesign of outdoor public spaces to improve safety and belonging.
These findings fit into the bigger picture of disaster research by highlighting the loss of social support among young adults during the pandemic. As social networks decrease in size, resource accessibility is expected to decline, as well. Social support is needed to improve coping capacity in multi-hazard disasters that may occur during the current or future pandemics. Therefore, it is critical that we identify changes in social and emotional vulnerability among young adults that may be exacerbated by crisis-induced adversity, such as unemployment and bereavement, in addition to the physical mobility constraints experienced in the built environment.
Implications for Practice
These findings suggest that young adults require additional opportunities to maintain their social support networks and mental health while practicing pandemic-related distancing measures. A number of implications for practice to prevent social isolation among young Americans may be implemented, such as tailoring messages, improving means of communication, and providing incentives to address the specific social support losses experienced, as well as improving access to telehealth services and mental health screenings, hotlines, digital technology monitoring and assistance, and financial support.
Limitations and Strengths
While this study demonstrates how the social support networks of young adults have changed during the COVID-19 pandemic, there are certain limitations that need to be acknowledged. First, this study was designed to capture the experiences of young adults in three states across the United States, but the sociodemographics of the sample are not representative of the United States as a whole. Therefore, the findings are not generalizable to all young adults in the nation. Second, given that the survey was administered online (which was considered to be one of the safest data collection approaches during the pandemic), it does not capture all of the technological barriers young adults may be experiencing during the pandemic. Finally, this study relies on a retrospective name and place generator that might be affected by memory limitations. While care was taken in the design and pretesting of these questions, it is difficult to control recall-based response biases.
Future Research Directions
This quick response research is an exploratory pilot study that will be expanded to better understand the impacts of the pandemic on social support experienced by young adults. Future data analysis will incorporate discrete choice modeling to study changes in physical-virtual social support networks. Future models will be specified to include latent constructs based on indicator questions in the survey, such as extroversion, personal agency, and loneliness, and random effects to capture heterogeneity, as exemplified in Calastri et al. (201821). An open-source program for social network analysis called E-NET (Borgatti, 200922) will be used to calculate network attributes like homophily, as in Sadri et al. 201823, and to compare attributes of retained, lost, and added connections to study the theoretical mechanisms driving network evolution (Halgin & Borgatti, 201224). This advanced modeling will be conducted to examine differential impacts across sociodemographic groups to tailor policymaking designed to assist those groups most impacted by social isolation.
Acknowledgements. The authors would like to thank Dr. Michelle Birkett and Dr. Lauren Beach at Northwestern University for their guidance on survey question specification.
References
-
Aldrich, D. P., & Meyer, M. A. (2015). Social capital and community resilience. American Behavioral Scientist, 59(2), 254-269. https://journals.sagepub.com/doi/10.1177/0002764214550299 ↩
-
Grootaert, C., Narayan, D., Nyhan Jones, V., & Woolcock, M. (2004). Measuring social capital: An integrated questionnaire(World Bank Working Paper No. 18). The World Bank. https://openknowledge.worldbank.org/handle/10986/15033 ↩
-
Uphoff, N. (1999). Understanding social capital: Learning from the analysis and experience of participation. In P. Dasgupta & I. Serageldin (Eds.), Social capital: A multifaceted perspective (pp. 215-249). World Bank Group. http://documents.worldbank.org/curated/en/663341468174869302/Social-capital-a-multifaceted-perspective ↩
-
Sanyal, S., & Routray, J. K. (2016). Social capital for disaster risk reduction and management with empirical evidences from Sundarbans of India. International Journal of Disaster Risk Reduction, 19, 101-111. https://www.sciencedirect.com/science/article/pii/S2212420916301777?via%3Dihub ↩
-
Littau, J. (2009). The virtual social capital of online communities: Media use and motivations as predictors of online and offline engagement via six measures of community strength. Doctoral dissertation, University of Missouri-Columbia. https://mospace.umsystem.edu/xmlui/handle/10355/7026 ↩
-
Tomai, M., Rosa, V., Mebane, M. E., D’Acunti, A., Benedetti, M., & Francescato, D. (2010). Virtual communities in schools as tools to promote social capital with high school students. Computers & Education, 54(1), 265-274. https://www.sciencedirect.com/science/article/pii/S0360131509002048?via%3Dihub ↩
-
Portela, M., Neira, I., & del Mar Salinas-Jiménez, M. (2013). Social capital and subjective wellbeing in Europe: A new approach on social capital. Social Indicators Research, 114(2), 493-511. https://www.jstor.org/stable/24720260 ↩
-
van Beuningen, J., & Schmeets, H. (2013). Developing a social capital index for the Netherlands. Social Indicators Research, 113(3), 859-886. 10.1007/s11205-012-0129-2 ↩
-
Valtorta, N. K., Kanaan, M., Gilbody, S., Ronzi, S., & Hanratty, B. (2016). Loneliness and social isolation as risk factors for coronary heart disease and stroke: Systematic review and meta- analysis of longitudinal observational studies. Heart, 102(13), 1009-1016. https://heart.bmj.com/content/102/13/1009 ↩
-
Aldrich, D. P. (2017). The importance of social capital in building community resilience. In W. Yan & W. Galloway (Eds.), Rethinking resilience, adaptation and transformation in a time of change (pp. 357-364). Springer, Cham. 10.1007/978-3-319-50171-0 ↩
-
Nakagawa, Y., & Shaw, R. (2004). Social capital: A missing link to disaster recovery. International Journal of Mass Emergencies and Disasters, 22(1), 5-34. http://ijmed.org/articles/235/ ↩
-
Norris, F. H., Stevens, S. P., Pfefferbaum, B., Wyche, K. F., & Pfefferbaum, R. L. (2008). Community resilience as a metaphor, theory, set of capacities, and strategy for disaster readiness.* American Journal of Community Psychology, 41*(1-2), 127-150. https://onlinelibrary.wiley.com/doi/full/10.1007/s10464-007-9156-6 ↩
-
Haworth, B. T., Eriksen, C., & McKinnon, S. J. (2019, May 29). Online tools can help people in disasters, but do they represent everyone? The Conversation. Haworth, B. T., Eriksen, C., & McKinnon, S. J. (2019, May 29). Online tools can help people in disasters, but do they represent everyone? The Conversation. https://theconversation.com/online-tools-can-help-people-in-disasters-but-do-they-represent-everyone-116810 ↩
-
Klinenberg, E. (2018). Palaces for the people: How social infrastructure can help fight inequality, polarization, and the decline of civic life. Crown. ↩
-
Liu, C. H., Pinder-Amaker, S., Hahm, H. C., & Chen, J. A. (2020). Priorities for addressing the impact of the COVID-19 pandemic on college student mental health. Journal of American College Health, 1-3. https://doi.org/10.1080/07448481.2020.1803882 ↩
-
Baum, N. M., Jacobson, P. D., & Goold, S. D. (2009). “Listen to the people”: Public deliberation about social distancing measures in a pandemic. * The American Journal of Bioethics, 9*(11), 4-14. 10.1080/15265160903197531 ↩
-
McCallister, L., & Fischer, C. S. (1978). A procedure for surveying personal networks. Sociological Methods & Research, 7(2), 131–148. https://journals.sagepub.com/doi/10.1177/004912417800700202 ↩
-
Bidart, C., & Charbonneau, J. (2011). How to generate personal networks: Issues and tools for a sociological perspective. Field Methods, 23(3), 266-286. https://journals.sagepub.com/doi/10.1177/1525822X11408513 ↩
-
Oldenburg, R., & Brissett, D. (1982). The third place. Qualitative sociology, 5(4), 265-284. ↩
-
Mokhtarian, P. L., Salomon, I., & Singer, M. E. (2015). What moves us? An interdisciplinary exploration of reasons for traveling. Transport Reviews, 35(3), 250-274. ↩
-
Calastri, C., Hess, S., Daly, A., Carrasco, J. A., & Choudhury, C. (2018). Modelling the loss and retention of contacts in social networks: The role of dyad-level heterogeneity and tie strength. Journal of Choice Modelling, 29, 63-77. https://www.sciencedirect.com/science/article/pii/S1755534518300290?via%3Dihub ↩
-
Borgatti, S.P. (2006). E-Network Software for Ego-Network Analysis (v. 0.023). Analytic Technologies. https://sites.google.com/site/enetsoftware1/ ↩
-
Sadri, A. M., Ukkusuri, S. V., Lee, S., Clawson, R., Aldrich, D., Nelson, M. S., Seipel, J. & Kelly, D. (2018). The role of social capital, personal networks, and emergency responders in post- disaster recovery and resilience: a study of rural communities in Indiana. Natural Hazards, 90(3), 1377-1406. 10.1007/s11069-017-3103-0 ↩
-
Halgin, D. S., & Borgatti, S. P. (2012). An introduction to personal network analysis and tie churn statistics using E-NET. Connections, 32(1), 37-48. ↩
Borowski, E., & Stathopoulos, A. (2021). Resilience of Social Support Networks to Social Distancing (Natural Hazards Center Quick Response Research Report Series, Report 320). Natural Hazards Center, University of Colorado Boulder. https://hazards.colorado.edu/quick-response-report/resilience-of-social-support-networks-to-social-distancing