Social Capital, Mobility, and Evacuation Destinations During the Marshall Fire
Publication Date: 2022
Abstract
Our project seeks to understand why and how people evacuate from shocks that are preceded by little or no early warning. We are using a variety of research methods, including qualitative (interviews, map drawing exercises) and quantitative approaches (online surveys, social network structures, aggregate mobile phone data). In this preliminary report, we provide an overview of our multi-level research design and describe initial results from the online survey. While our data collection and analysis is still ongoing, we have obtained survey responses from 178 residents who were issued evacuation orders or warnings during the Marshall Fire. A majority of the survey respondents were white, college-educated, and had high incomes. Most respondents evacuated to the homes of friends and family or to private hotels rather than using public evacuation shelters. The finding that few evacuees used the temporary public shelters arranged by authorities needs further investigation. We outline a series of new research questions that this study revealed and that must be answered so that policy makers can make evidence-based decisions about how to better provide shelter during emergencies. Our analysis suggests, for example, the need for investment in social networks and social infrastructure, such as parks or community groups. These types of investments may help build social ties within communities that improve public trust in shelters.
Introduction
Evacuation—leaving an area facing or soon to face a hazard—remains the single most effective way to reduce vulnerability across risks and societies. Yet, many studies indicate that residents often fail to evacuate in time to save their lives. While past research has focused on easily captured factors such as disaster-specific risks (Baker, 19791), socioeconomic status, gender, education, and past disaster experiences (Baker, 19912; Bateman & Edwards, 20023), recent research has emphasized the role of social capital in decisions about evacuation (Metaxa-Kakavouli et al., 20184; Fraser et al., 20215). Our project seeks to build on these advancements by bringing together multiple data sources that have not been used together often in past scholarly research.
The fast-moving Marshall Fire—which devastated the suburban Sagamore and Rock Creek neighborhoods in the Colorado towns of Superior and Louisville on December 30, 2021—occurred during an era of rising numbers of extreme weather events. A drier than usual winter and powerful winds in Boulder County combined to push fires into neighborhoods where fire risk was long assumed, by both residents and insurance companies, to be close to zero. Further, shelters opened by the cities seemed to have little, if any, use by evacuees, and medium-to-long-term housing is expensive and in short supply (Brulliard, 20226).
Given the likelihood of future suburban communities will face fires across North America, more research is needed to understand how to encourage people to flee early from such risks, as well as how to assist them as they seek short-, medium-, and long-term housing. This project seeks to address this gap by helping decision makers and residents alike to better understand what drives evacuation speed and location destinations. Our initial findings bring with them relevant findings for policy makers seeking to allocate resources before shocks that will require evacuation.
Literature Review
Past scholars have investigated the field of evacuation choices using surveys at highway rest stops during crises (Collins et al., 20177, 20188); post-hoc surveys of disaster-affected neighborhoods in the weeks and months following crises (Elliott et al., 20109); and, more recently, through geocoded internet user data (Martín et al., 201710; Yabe et al., 201911). While much of this literature has provided insights on long-distance evacuation, scholars still struggle to accurately measure short-distance, local evacuation to shelters, hotels, and, for those with social networks, the homes of others during hazard events. Moreover, these past studies relied primarily on ex-post data and the memories of evacuees, which introduces a strong likelihood of bias. For example, when respondents who have been through a shock are asked to think about the event, it is quite likely that their recollections have changed over time and also may be altered by current circumstances. Survivors whose experiences since the shock have been uniformly negative may have a more negative recollection of events than those who have been able to access resources and assistance.
Recent scholarship has also suggested that community resources, particularly the forms of social ties known as bridging and linking social capital (Fraser et al., 2021; Metaxa-Kakavouli et al., 2018), motivate long-distance evacuation. Social capital is made up of the networks and connections that bind us to others along with the trust and engagement that develop from them (Aldrich, 201212). Bridging social capital is a connection between someone and another person to whom they are not directly related and to whom they have relatively irregular contact. These bridging ties bring together people who have different ethnicities, religions, backgrounds, and worldviews. Where bridging social capital connects people of the same levels of power and authority, linking social capital, in contrast, connects regular residents with people who run organizations and command resources.
When warnings are received from credible and trusted sources (Perry, 197913; Cutter & Barnes, 198214; Baker, 1991; Riad et al., 199915; Hasan et al., 201116; Metaxa-Kakavouli et al., 2018), such as family, friends, community members, or local officials, individuals are more likely to take them seriously. For example, in a study of 289 individuals from Minamisoma City in Japan following the Fukushima nuclear disaster, researchers found that individuals cited their social network as the most influential factor in determining their first, and, in many cases, their second, evacuation destination (Do, 201917). Among the respondents in that study, 29% stated they chose their evacuation destination because they knew someone they could stay with, and another 14% indicated their destination was near someone they knew. The further individuals were from their home, the more important this effect became. Similarly, another study found that close bonding ties, often characterized by connections with close friends and family, were associated with individuals sheltering in place during Hurricane Irma in 2017 (Metaxa-Kakavouli et al., 2018). Broad, second-degree social ties, including distant friends-of-friends, were strongly associated with the greatest likelihood of evacuation during Hurricanes Irma and Harvey in 2017.
Our research project builds on these past studies, using a variety of previously unavailable data sources to better track actual movement during evacuation and sheltering in place and tying our data into theories recognizing the power of social ties. By combining exact information on the location of residents before, during, and after the fire with social network data on the ways that they receive and process information, our study can build a better understanding of how people make decisions during perilous times. Importantly, our study can help decision makers—especially at the local level—consider how to best allocate resources for residents who may need to evacuate.
Research Design
Research Questions
We asked two research questions focused on disaster behaviors during the Marshall Fire:
- What factors—including demographics (sex, education, income, race, and social ties); type of warning (neighbor, direct contact with first responder, reverse 911 call); infrastructure accessibility (transportation, communication, water, etc.); and social ties (bonding, bridging, and linking)—drive evacuation choices?
- What factors—including demographics, type of warning, infrastructure accessibility, and social ties—drive decisions about short-, medium-, and long-term evacuation destinations (e.g., evacuation shelters, house of friend or family, hotel)?
Data, Methods, and Procedures
Our project seeks to understand why and how people evacuate from shocks that are preced¬ed by little or no early warning. We are also interested in the destinations they choose as shelters during evacuation periods. We are using a variety of research methods, including qualitative interviews and map drawing exercises along with quantitative analyses of online surveys, social network structures, and mobile phone data. Below we provide an overview of the two levels of data that we are examining in this study: (1) aggregated and anonymous “big data” from mobile phones that we are using to study community-level mobility patterns during the Marshall Fire and (2) surveys and interviews that we are using to examine the perceptions and evacuation behaviors of individual residents during the disaster.
Sampling and Participants
Level 1: Aggregate “Big Data” Measures of Evacuation
Our first level of analysis is at the aggregate level and involves two sources of anonymous mobility data from cell phones. We accessed our first source of aggregate data through an arrangement with the Cuebiq Data for Good initiative. Cuebiq is a third-party data collector that provided us with mobility data from cell phones of people in the Marshall Fire area from December 1, 2021, to January 28, 2022. This wide range includes three dates of particular interest, namely: the day before (December 29), the day of (December 30), and the day after (December 31) the Marshall Fire. Evacuation orders were first issued between 11:47 a.m. and 2:58 p.m. for some neighborhoods on December 30, 2021. We visualize our bounding box below in Figure 1, highlighting five potential distance ranges from the center of the fire for which we can analyze evacuation data.
Figure 1. Census Tracts by Proximity to Marshall Fire
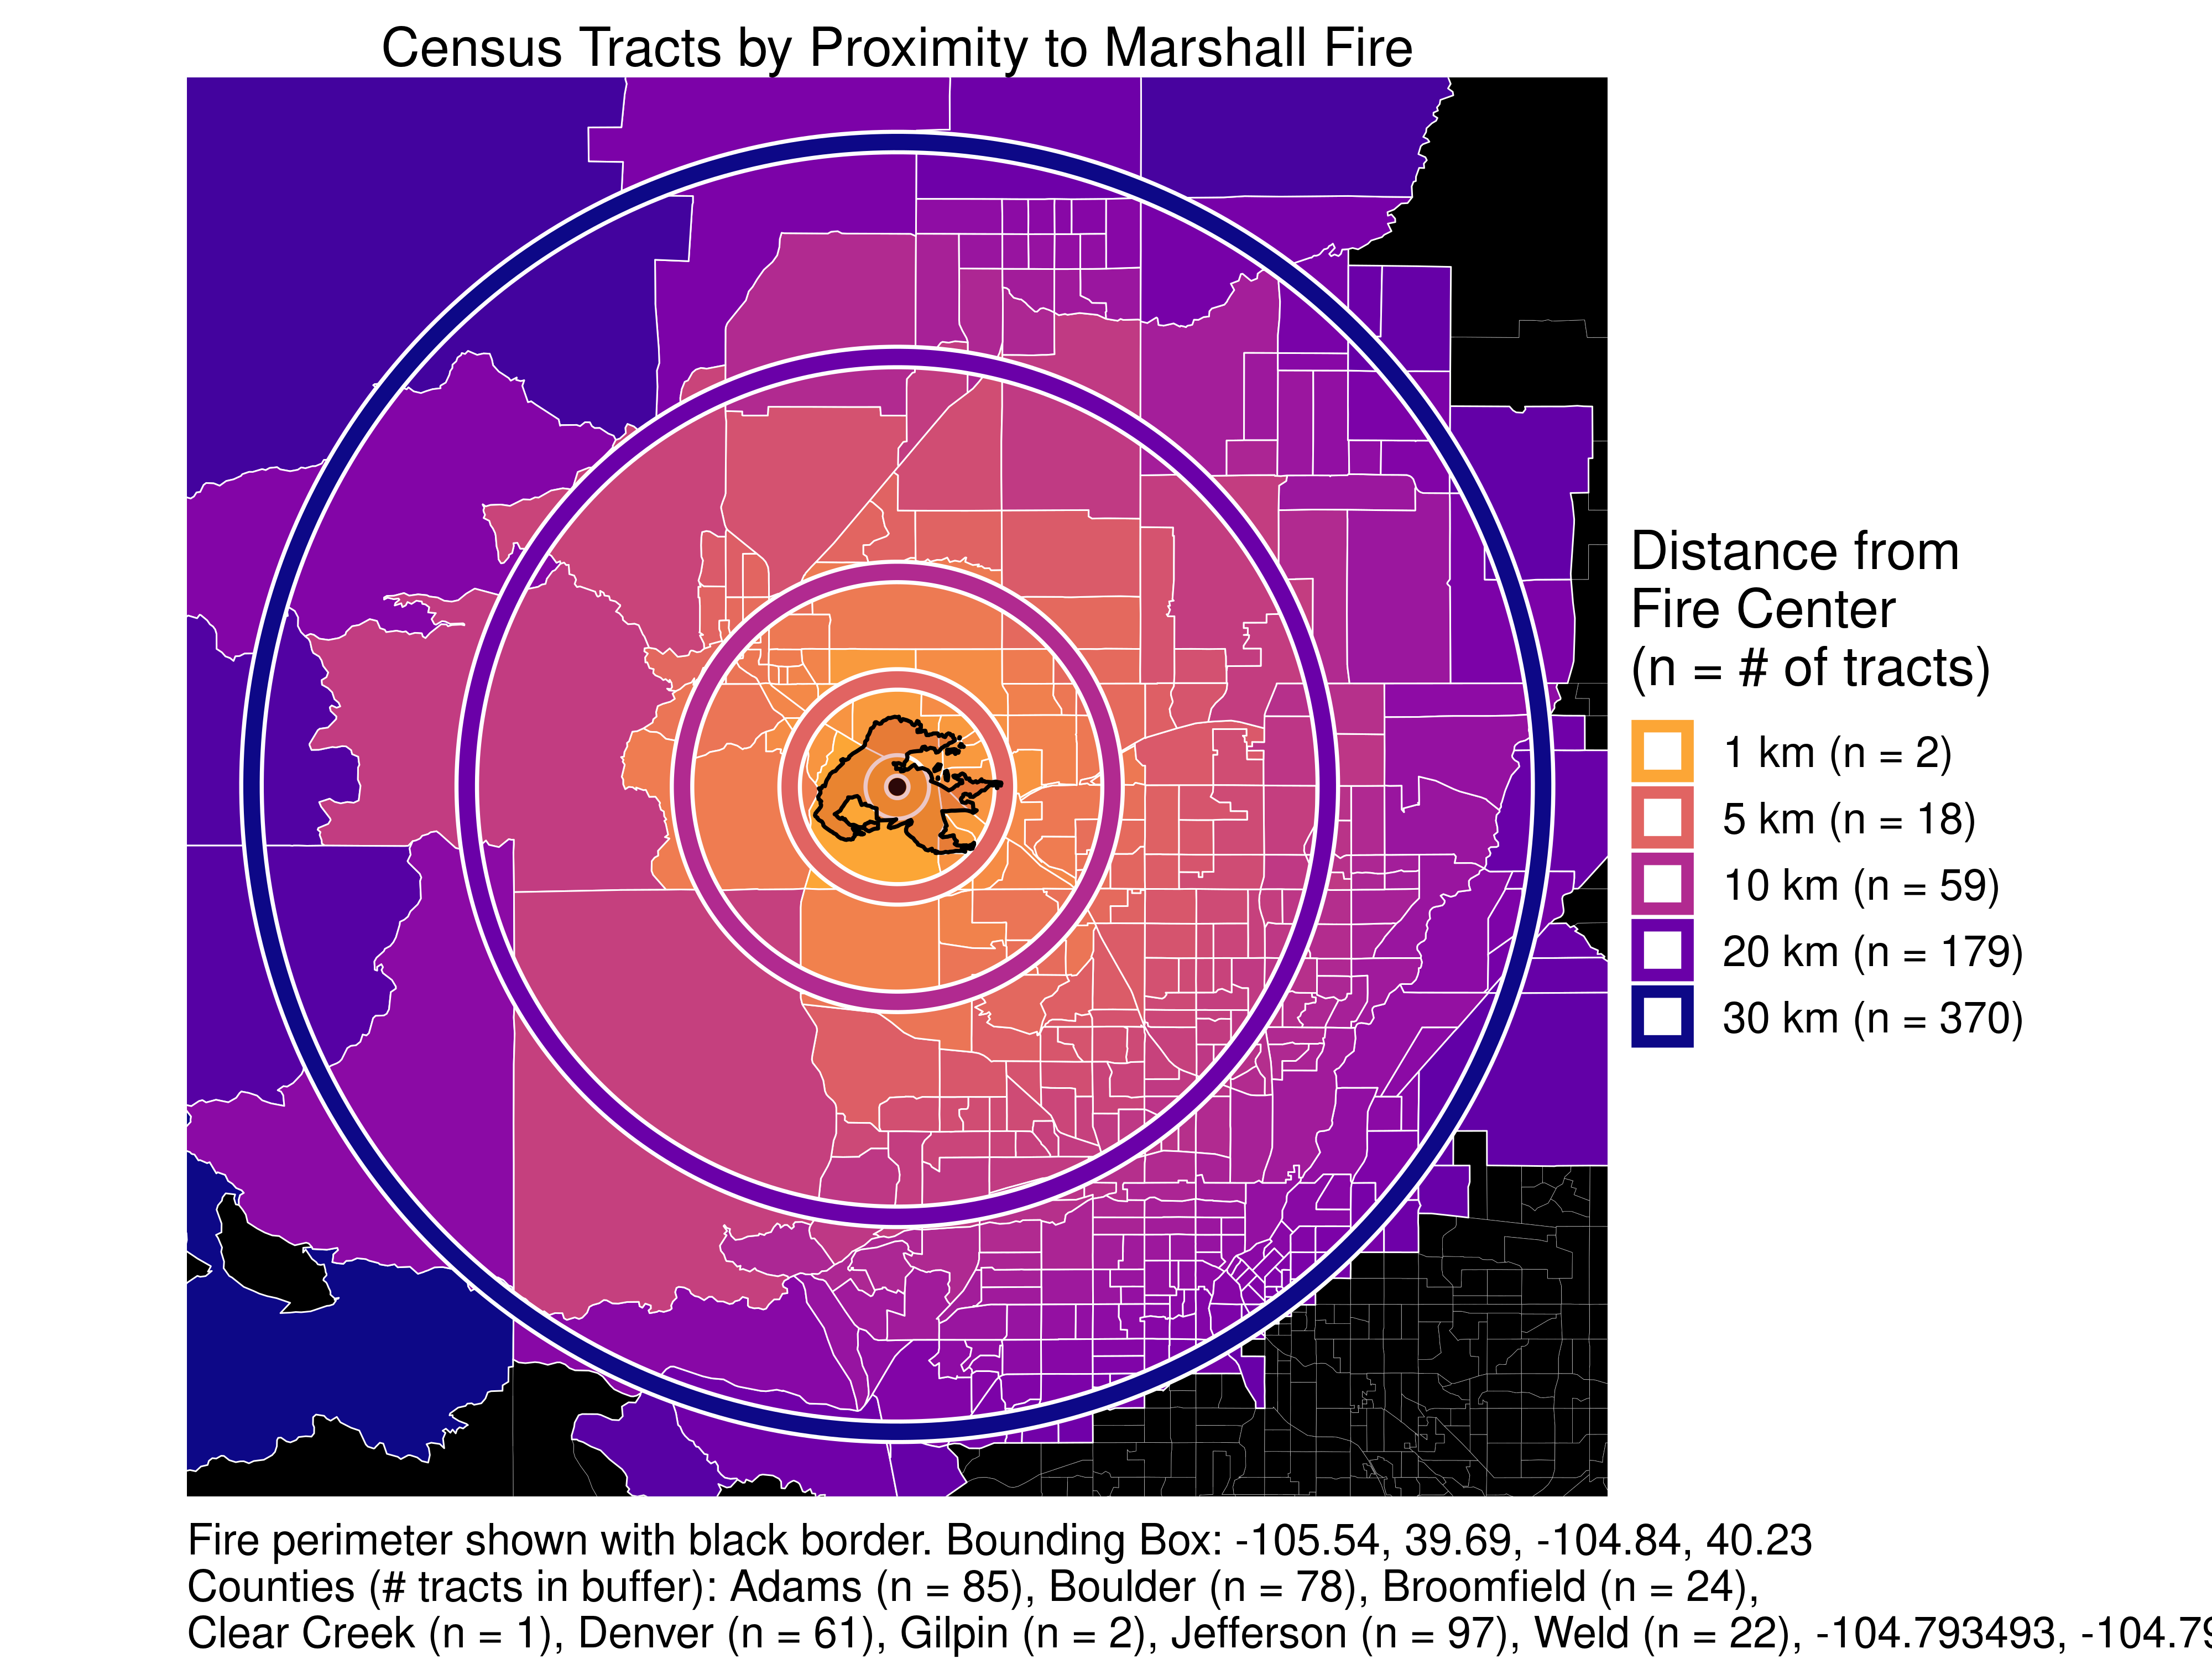
Although Cuebiq does not provide information on precise individual movements, they can provide aggregate information on the timing and number of flows of individuals from homes and businesses in the fire-affected areas to safer places elsewhere. In this instance, Cuebiq recorded the total number of residents who did not spend the night in the census tract of their primary residence as well as the maximum distance traveled from home per census tract. This data product measures census tract by mobility flows, including information such as average distance traveled over set periods of time. Cuebiq’s data allows us to study immediate evacuation choices and destinations, including where users went immediately before, during, and after the onset of the crisis; how many residents evacuated during each period; how far they traveled; and how these levels varied hour by hour. This analysis is ongoing.
To analyze medium-term post-fire evacuation, we are utilizing a second source of aggregate data— Facebook’s Data for Good Program. This Facebook program provides neighborhood block-by-block mobility estimates and includes movement data for users who indicate the presence of a risk or hazard, including man-made risks like mass casualty events as well as natural hazards like fires. This platform estimates evacuation after a crisis by geolocating Facebook users in the region in the weeks prior to the crisis and documenting how many of these users move from one neighborhood to another after the crisis. Facebook provides these neighborhood-aggregated tallies to humanitarian non-governmental organizations (NGOs) and disaster researchers for disaster response and analysis while preserving user privacy (Maas et al., 201918).
Through an arrangement with Facebook, we gathered mobility data from cell phones of Facebook users in the Marshall Fire areas over 14 days, from December 31, 2021, to January 13, 2022. We examined affected neighborhoods for 14 days after the disaster, using 600 square meter tile estimates of evacuation provided by Facebook Data for Good, along with pre-fire measures of social ties at the census tract level using the Kyne and Aldrich Social Capital Index (SoCI, from Kyne & Aldrich, 201919). Facebook reported mobility flows for 100 grid cells over 42 time-steps, each eight hours in duration. The majority of evacuation occurred in 39 cells that overlapped with our core study region.
In contrast to evacuation from hurricanes which usually take place over a period of days prior to landfall, evacuation from fires, earthquakes, and tornadoes start only after the crisis materializes. The 14-day window described above helps capture the changing mobility patterns of residents over the short and medium term. Facebook does not provide information on precise individual movements, but instead provides aggregate information on the timing and amount of flows of individuals from homes and businesses in the fire-affected areas to safer areas elsewhere. Using this data, we can approximate six kinds of evacuation behavior, including: (1) overall evacuation, represented by increased mobility compared to pre-disaster baseline levels; (2) local evacuation, captured by increased mobility within the same neighborhood; (3) long-distance evacuation, which involves increased mobility between neighborhoods; (4) sheltering in place, represented by decreased mobility compared to pre-disaster baseline levels; (5) reductions in local movement, captured by less mobility within the same neighborhoods; and (6) reductions in long-distance movement, represented by lower levels of mobility between different neighborhoods.
Level 2: Individual Measures of Evacuation
Our second level of analysis is at the individual level and involves both qualitative and quantitative approaches. For qualitative data, we are carrying out individual interviews with survivors, decision makers, and local nonprofit organizations in the area to ask about their choices during the evacuation, with a focus on their sources of information and the factors influencing their timing and destination location. So far, we have completed 10 interviews, each one hour long, with residents and are using these conversations to build a more nuanced understanding of decision-making after the fire. We will continue recruiting interview participants through our contacts with local residents and plan to interview 20 survivors and residents over the course of the study.
For quantitative data, we are conducting online surveys with residents through the online survey tool Qualtrics. We are coordinating survey recruitment and distribution with other research teams to avoid oversaturating community members with research requests. To acquire the names and addresses of residents, we used publicly available town voter registration and homeownership records and privately owned lists. Sourcing exclusively through publicly available records limits our results to homeowners and those registered to vote.
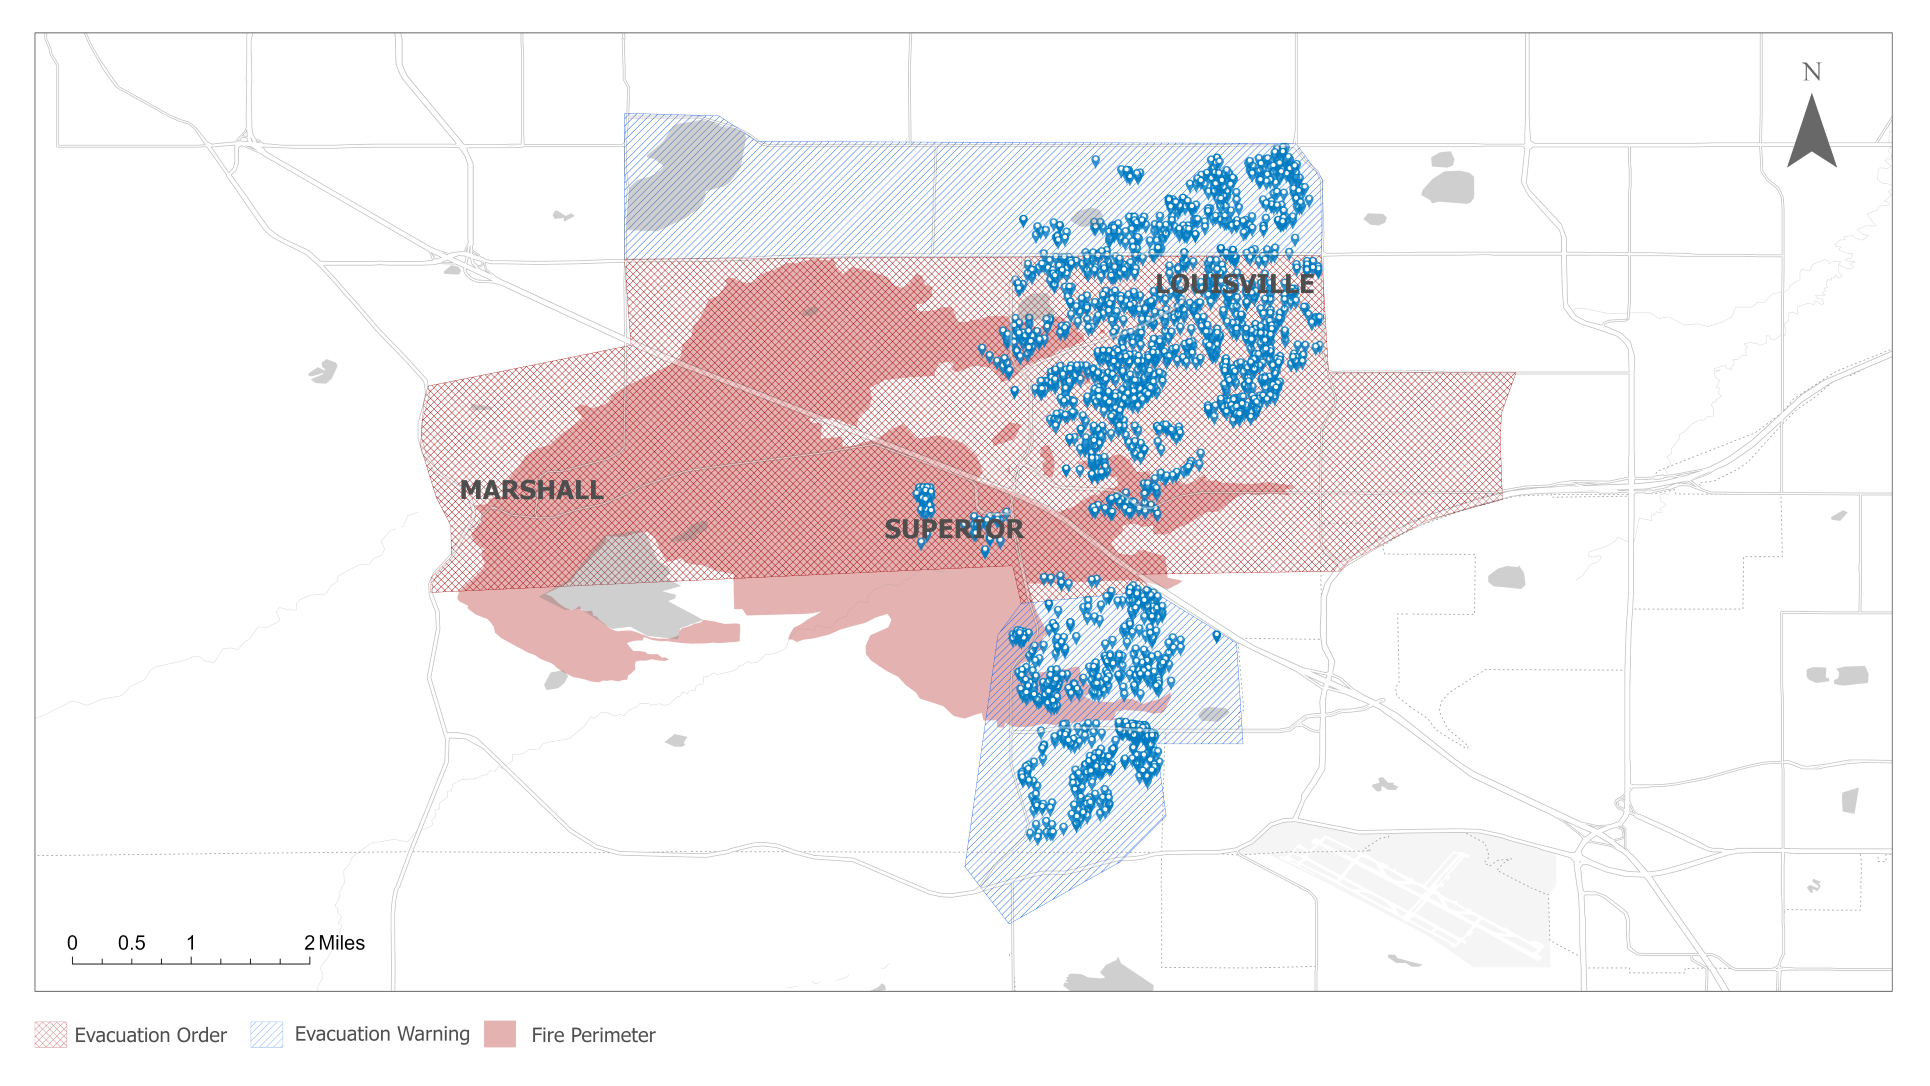
Based on reports made available from the Boulder County Sheriff’s Office, we first generated evacuation warning and order polygons in ArcGIS Pro (a geographical information systems, or mapping, software) from official orders issued on December 30, 2021. We then mapped individuals from the lists we acquired from the Boulder County Elections Office (N=23,405) and further triangulated this list with a list of current residents from the Boulder County Assessor's Office. This process reduced our list to 15,116 individuals. We then performed a spatial clip to capture individuals in the evacuation warning and order polygons, reducing our list to 12,309 individuals. To ensure we sampled evenly across the evacuation polygons, we mapped the U.S. Census Block Groups with data on education, income, and race and ethnicity. Finally, as depicted in Figure 2, we generated a stratified sample from our master list of 2,000 individuals with unique addresses to ensure our sampling occurred proportionally across 18 unique Census Block Groups in the evacuation zones to reduce the possibility of oversampling in our survey recruitment.
Figure 2. Stratified Survey Sample of Households in Marshall Fire Evacuation Zones
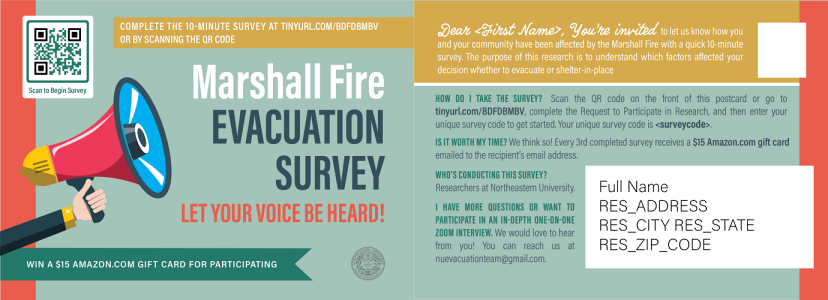
Using this master list, we mailed 2,000 recruitment postcards, depicted in Figure 3 below, to establish contact with potential participants. We received 178 responses from residents across the seven census tracts where the fire perimeter spread. These seven census tracts have a population totaling 21,856 residents. Two of the tracts were within one kilometer of the fire’s epicenter; 18 within five kilometers; and 60 within 10 kilometers.
Figure 3. Survey Recruitment Postcard
Data Analysis
Data for this study are being analyzed using a variety of methods, including cross-tabulation, multiple regression, geographic information systems (GIS) mapping, and case studies.
Analysis of the demographic characteristics of the 178 survey responses showed that our respondents were mostly wealthy, educated, and white, resembling the population of Boulder reported by the U.S. Census Bureau. Less than five percent identify as Hispanic or Latinx; and less than one percent identify as Black, Asian, or Native American, respectively. More than two-thirds of the survey respondents had earned a college degree: One-third had attained a Bachelor of Arts or Bachelor of Science degree. And an additional one-third had completed a Master’s degree in the arts, sciences, or business. Roughly 40% of respondents had annual incomes higher than $100,000. The majority (88%) also reported that they could count on close family or friends if they needed help.
Ethical Considerations, Researcher Positionality, Reciprocity, and Other Considerations
Institutional review board approval for this project took place at Northeastern University (NEU IRB# 22-03-17). Thanks to our past work with area-based nonprofit organizations, such as Boulder Colorado Strong (BoCo Strong), and connections with local faculty members, several members of our research team had spoken with or interviewed local residents in the immediate aftermath of the fire. This allowed us to avoid cold-calling already overwhelmed residents by only contacting those who previously expressed interest in talking about their evacuations. Further, we are coordinating with other research teams in the area in our survey efforts to ensure that we are not overburdening the population with requests to participate in research. Additionally, we are also reducing burden by using anonymous aggregated mobility data from Facebook and Cuebiq.
Preliminary Findings
Table 1 shows that 94% survey respondents chose to heed the warnings and evacuate during the fire. Only six percent of respondents sheltered in place. Below we describe our analysis of the places where respondents sought shelter during the evacuation. This study has produced several intriguing preliminary findings regarding evacuation destinations.
Table 1. Respondent Decision to Evacuate or Shelter in Place
| Evacuate | ||
| Shelter in Place | ||
| Total |
Bonding vs. Bridging Social Contacts
Table 2 shows that that most respondents evacuated to a family member’s (45%) or friend’s home (38%), highlighting that private social networks drove most evacuation behaviors. In contrast, coworkers’ homes were utilized by just 4% of respondents. Family and friends, who typically represent bonding social ties, were the primary sources of shelter for evacuees; meanwhile, evacuees rarely sought shelter from people with whom they had “bridging weak ties” (Granovetter, 1973, p. 137120), such as coworkers.
Table 2. Respondent Evacuation Destinations
| Friend's Home | ||
| Co-worker's Home | ||
| Family Member's Home (immediate or extended family) |
||
| Shelter | ||
| Place of Worship (e.g., church, synagogue, mosque, etc.) |
||
| Hotel |
Previous research has suggested that bridging social ties between individuals at their workplaces, houses of worship, sports clubs, and the proverbial bowling alley (Putnam, 200021) build trust, reciprocity, and a sense of shared stake in community. Our survey data indicates, however, that Boulder County residents affected by the Marshall Fire relied very little on bridging ties to find refuge from the disaster. This may be due to lower levels of social vulnerability in the affected community; as stated above, for example, as many as 40% of residents in our study area had annual incomes higher than $100,000. Residents may not have needed to contact members of their bridging networks because their close friends and family were more likely to have abundant social and financial resources that they could share with them during a crisis. Similarly, while bridging social ties might help residents spread the word about public shelters, the need to evacuate, or how to rebuild, residents are much more likely to ask for or offer shelter in their own home to friends and family. Still, the gap in reports of evacuation destinations by bonding vs. bridging social contacts found in our study is notable.
Private vs. Public/Social Institutions
Another prominent theme in our findings was the high level of evacuation to private sources of shelter rather than other public or social institutions. As previously discussed, most residents evacuated to the homes of family (38%), friends (45%), or hotels (23%). In contrast, only three percent stayed at a place of worship while another three percent stayed at a public shelter. These findings indicate that evacuees primarily used private social networks to access shelter. While publicly available shelters were available, we found that residents evacuated to these sites much less frequently than private locations.
It is also noteworthy that residents were much more likely to evacuate to hotels (23%) rather than public shelters (three percent), especially considering that these private market-based housing options levy significant costs on evacuees. There are a variety of possible explanations for this finding. Residents who evacuated to hotels may have had limited social ties or individuals within their social networks may have had fewer resources to share with them (e.g., no extra rooms for housing). Another possible explanation is that evacuees chose to stay at hotels out of concern for exposure to COVID-19 and updated regulations on non-congregate shelters during the pandemic to reduce exposure to disaster victims. Alternatively, respondents who stayed at hotels may have had higher incomes or other resources needed to secure private housing. We will test these hypotheses in the next phase of survey and interview data collection and analysis.
Conclusions
Our analysis remains ongoing, but two major policy implications can be derived from our preliminary results.
Policy Applications
First, we found that social networks strongly shape the destinations where evacuees seek shelter Our survey findings suggest suggests that when wealthier areas face disaster, residents may be less likely to utilize public emergency shelters and evacuate instead to the private homes of friends and family or hotels. Future research should build upon our findings to investigate why residents did not choose public shelters as their evacuation destinations. This finding could indicate that residents lacked information about public shelter locations or how to access them. Alternatively, it could indicate that some evacuees, especially wealthier ones with strong social networks, may prefer other forms of emergency support than public shelters. Future investigations should examine these hypotheses and help build an evidence base that policymakers can use to update decisions around public shelter and evacuation resources.
Second, we found that residents overwhelmingly evacuated to the homes of friends and family (i.e., bonding, in-group social ties), rather than coworkers’ homes, places of worship, or public shelters (i.e., inter-group, bridging social encounters and ties). This division between bonding vs. bridging social ties is interesting and potentially worrisome. It could signal, for example, how the COVID-19 pandemic has isolated residents for multiple years and contributed to a decline across communities in bridging social ties that are needed to foster inter-group trust and reciprocity. The weakening of these bridging ties may also be contributing to a loss of trust in public institutions, including public shelters. It is possible that , residents in Boulder County may have felt dissuaded from staying in a public shelter with strangers during their most vulnerable hour. We will be exploring these questions in subsequent rounds of interview and survey data collection and analysis. If those analyses confirm these hypotheses about declining trust, we would encourage policy makers to consider pre-disaster and during-disaster messaging that frame shelters as safe locations. We also suggest that they consider investing in social infrastructure, such as parks, libraries, and civic centers, which have been shown to build bridging social capital (Fraser et al., 202222).
Future Research Directions
Although this study has only examined evacuation destinations so far, the additional data respondents have provided offers an opportunity to understand additional facets of how and why residents evacuate. In the future, we aim to expand this research using residents’ reports of the five individuals who most influenced their decision to evacuate. These survey questions offer a chance to investigate how much the specific social contacts of an individual shape their evacuation decisions, compared to overall measures of their social ties or the aggregate social capital of their neighborhood. Further, aggregate level data from Cuebiq and Facebook offers exciting opportunities to investigate change in evacuation levels over time, particularly whether hotspots with greater social resources experience cascading levels of evacuation, or lower rates.
References
-
Baker, E. J. (1979). Predicting Response to Hurricane Warnings: A Reanalysis of Data from Four Studies. Mass Emergency, 4(1), 9–24. ↩
-
Baker, E.J. (1991). Hurricane Evacuation Behavior. International Journal of Mass Emergencies and Disasters, 9, 287–310. ↩
-
Bateman, J. M. & Edwards, B. (2002). Gender and evacuation: A closer look at why women are more likely to evacuate for hurricanes. Natural Hazards Review 3(3), 107–117. ↩
-
Metaxa-Kakavouli, D,, Maas, P., & Aldrich, D.P. (2018). How Social Ties Influence Hurricane Evacuation Behavior. Proceedings of the ACM on Human-Computer Interaction, 2 (CSCW), 1-16. https://doi.org/10.1145/3274391 ↩
-
Fraser, T., Morikawa, L., & Aldrich, D.P. (2021). Rumor has It: The Role of Social Ties and Misinformation in Evacuation to Nearby Shelters after Disaster. Climate Risk Management, 33(3). https://doi.org/10.1016/j.crm.2021.100320 ↩
-
Brulliard, K. (2022, January 25). Can they go home again? The Washington Post. https://www.washingtonpost.com/nation/interactive/2022/marshall-fire-colorado-rebuilding/ ↩
-
Collins, J., Ersing, R., & Polen, A. (2017). Evacuation Decision-Making during Hurricane Matthew: An Assessment of the Effects of Social Connections. Weather, Climate, and Society, 9(4), 769– 776. ↩
-
Collins, J., Ersing, R., Polen, A., Saunders, M., & Senkbeil, J. (2018). The Effects of Social Connections on Evacuation Decision Making during Hurricane Irma. Weather, Climate, and Society, 10(3) 459– 469. ↩
-
Elliott, J. R., Haney, T. J., & Sams-Abiodun, P. (2010). Limits to Social Capital: Comparing Network Assistance in Two New Orleans Neighborhoods Devastated by Hurricane Katrina. Sociological Quarterly, 51(4), 624–648. ↩
-
Martín, Y., Li, Z., & Cutter, S.L. (2017). Leveraging Twitter to gauge evacuation compliance: Spatiotemporal analysis of Hurricane Matthew. PLoS ONE, 12, e0181701 ↩
-
Yabe, T., Sekimoto, Y., Tsubouchi, K., & Ikemoto, S. (2019). Cross-comparative analysis of evacuation behavior after earthquakes using mobile phone data. PLoS ONE, 14(2), e0211375. https://doi.org/10.1371/journal.pone.0211375 ↩
-
Aldrich, D.P. (2012). Building Resilience: Social Capital in Post Disaster Recovery. University of Chicago Press. ↩
-
Perry, R. W. (1979). Evacuation decision-making in natural disasters. Mass emergencies, 4(1), 25-38. ↩
-
Cutter, S., & Barnes, K. (1982). Evacuation behavior and Three Mile Island. Disasters, 6(2), 116- 124. ↩
-
Riad, J. K., Norris, F. H., & Ruback, R. B. (1999). Predicting evacuation in two major disasters: Risk perception, social influence, and access to resources. Journal of Applied Social Psychology, 29(5), 918-934. https://doi.org/10.1111/j.1559-1816.1999.tb00132.x ↩
-
Hasan, S., Ukkusuri, S., Gladwin, H., & Murray-Tuite, P. (2011). Behavioral model to understand household-level hurricane evacuation decision making. Journal of Transportation Engineering, 137(5), 341-348. ↩
-
Do, X. B. (2019). Fukushima Nuclear Disaster displacement: How far people moved and determinants of evacuation destinations. International Journal of Disaster Risk Reduction, 33, 235-252. ↩
-
Maas, P., Iyer, S., Gros, A., Park, W., McGorman, L., Nayak, C., & Dow, P. A. (2019, May). Facebook Disaster Maps: Aggregate Insights for Crisis Response and Recovery [Conference Proceedings Chapter]. WiPe Paper—Social Media in Crisis and Conflicts. Proceedings of the 16th International Conference on Information Systems for Crisis Response and Management, Valencia, Spain (pp. 836-847). https://inis.iaea.org/search/search.aspx?orig_q=RN:52117277 ↩
-
Kyne, D & Aldrich, D.P. (2019). Capturing Bonding, Bridging, and Linking Social Capital through Publicly Available Data. Risk, Hazards, and Crises in Public Policy, 11, 61-86. ↩
-
Granovetter, M. S. (1973). The strength of weak ties. American Journal of Sociology, 78(6), 1360-1380. ↩
-
Putnam, R. D. (2000). Bowling alone: The collapse and revival of American community. Simon and Schuster. ↩
-
Fraser, T., Cherdchaiyapong, N., Tekle, W., Thomas, E., Zayas, J. Page-Tan, C., & Aldrich, D.P. (2022). Trust but verify: Validating new measures for mapping social infrastructure in cities. Urban Climate, 46. https://doi.org/10.1016/j.uclim.2022.101287 ↩
Aldrich, D. P., Page-Tan, C., Fraser, T., & Yabe, T. (2022). Social Capital, Mobility, and Evacuation Destinations During the Marshall Fire (Natural Hazards Center Quick Response Research Report Series, Report 348). Natural Hazards Center, University of Colorado Boulder. https://hazards.colorado.edu/quick-response-report/social-capital-mobility-and-evacuation-destinations-during-the-marshall-fire