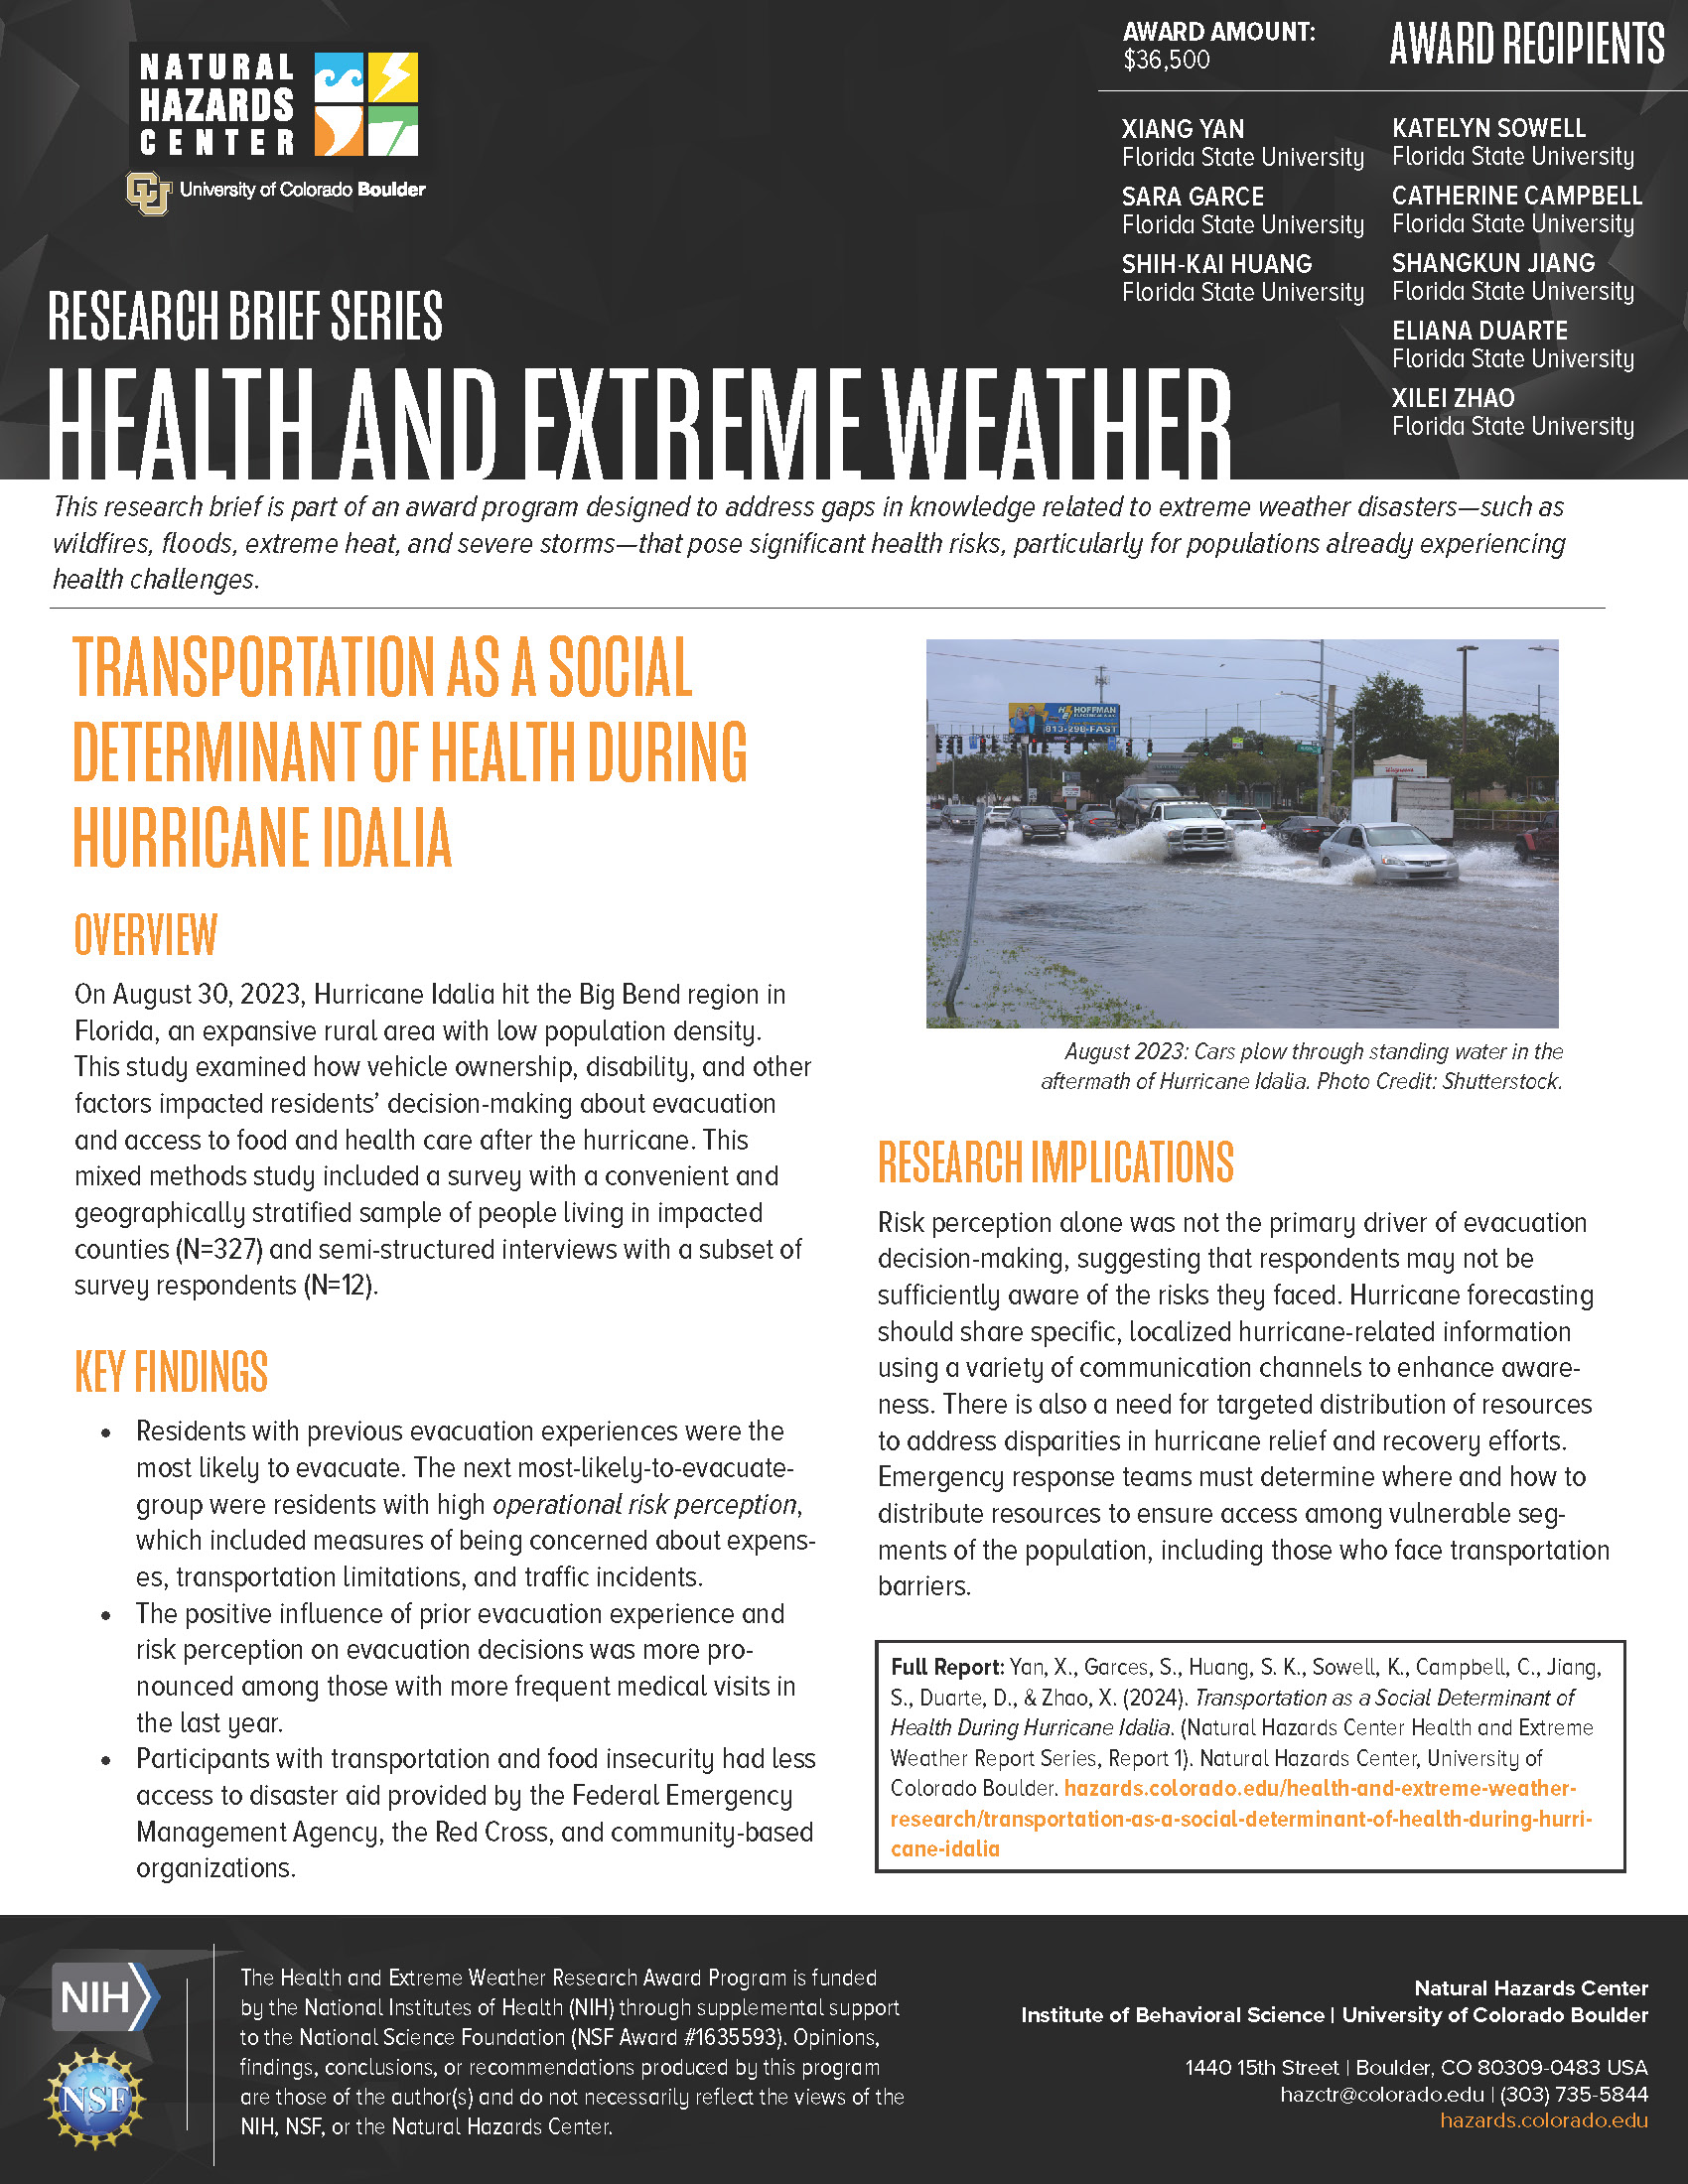
Transportation as a Social Determinant of Health During Hurricane Idalia
Publication Date: 2024
Abstract
On August 30, 2023, Hurricane Idalia hit the Big Bend region in Florida, an expansive rural area with low population density. Using survey (n=327) and interview data (n=12), this study documents transportation-related barriers preventing people from evacuating before the hurricane and accessing healthcare and food over the duration of the hurricane’s impact. Results from the survey revealed that 15% of participants faced transportation and food insecurity even before the hurricane. Risk perceptions clustered around hazard (i.e., getting hit, injury, and property damage), resource (medical, life, and food service disruptions), and operational (expenses, transportation limitations, and traffic incidents) concerns, with resource and hazard-related worries intensifying as the hurricane approached. About a quarter of the 327 respondents evacuated, mostly relying on personal vehicles. Demographic factors such as household size and marital status influenced evacuation decisions, with previous evacuation experience and family status playing significant roles. The study highlights the dominance of experiential factors over risk assessments in shaping evacuation decisions. Medical needs also had a major moderating effect, with respondents’ frequency of medical visits amplifying the effects of experience and risk perceptions on evacuation decisions. Interviews suggested that most people were well prepared for the hurricane, however, disparities in access to public assistance in vulnerable areas exist.
Introduction
On August 30, 2023, Hurricane Idalia, a Category 3 hurricane, made landfall in Florida’s Big Bend region, impacting many counties. The strongest hurricane observed in the area in more than 125 years, Hurricane Idalia caused record-breaking, life-threatening storm surges from Tampa to Big Bend. Evacuations were either recommended or required in parts of the region, but transportation-disadvantaged populations—including people who are low-income, carless, and seniors—faced challenges finding the transportation they needed to get to safety. Moreover, with a limited number of healthcare facilities and food retailers available in the region, transportation-disadvantaged populations faced additional barriers to accessing key resources, such as food and healthcare.
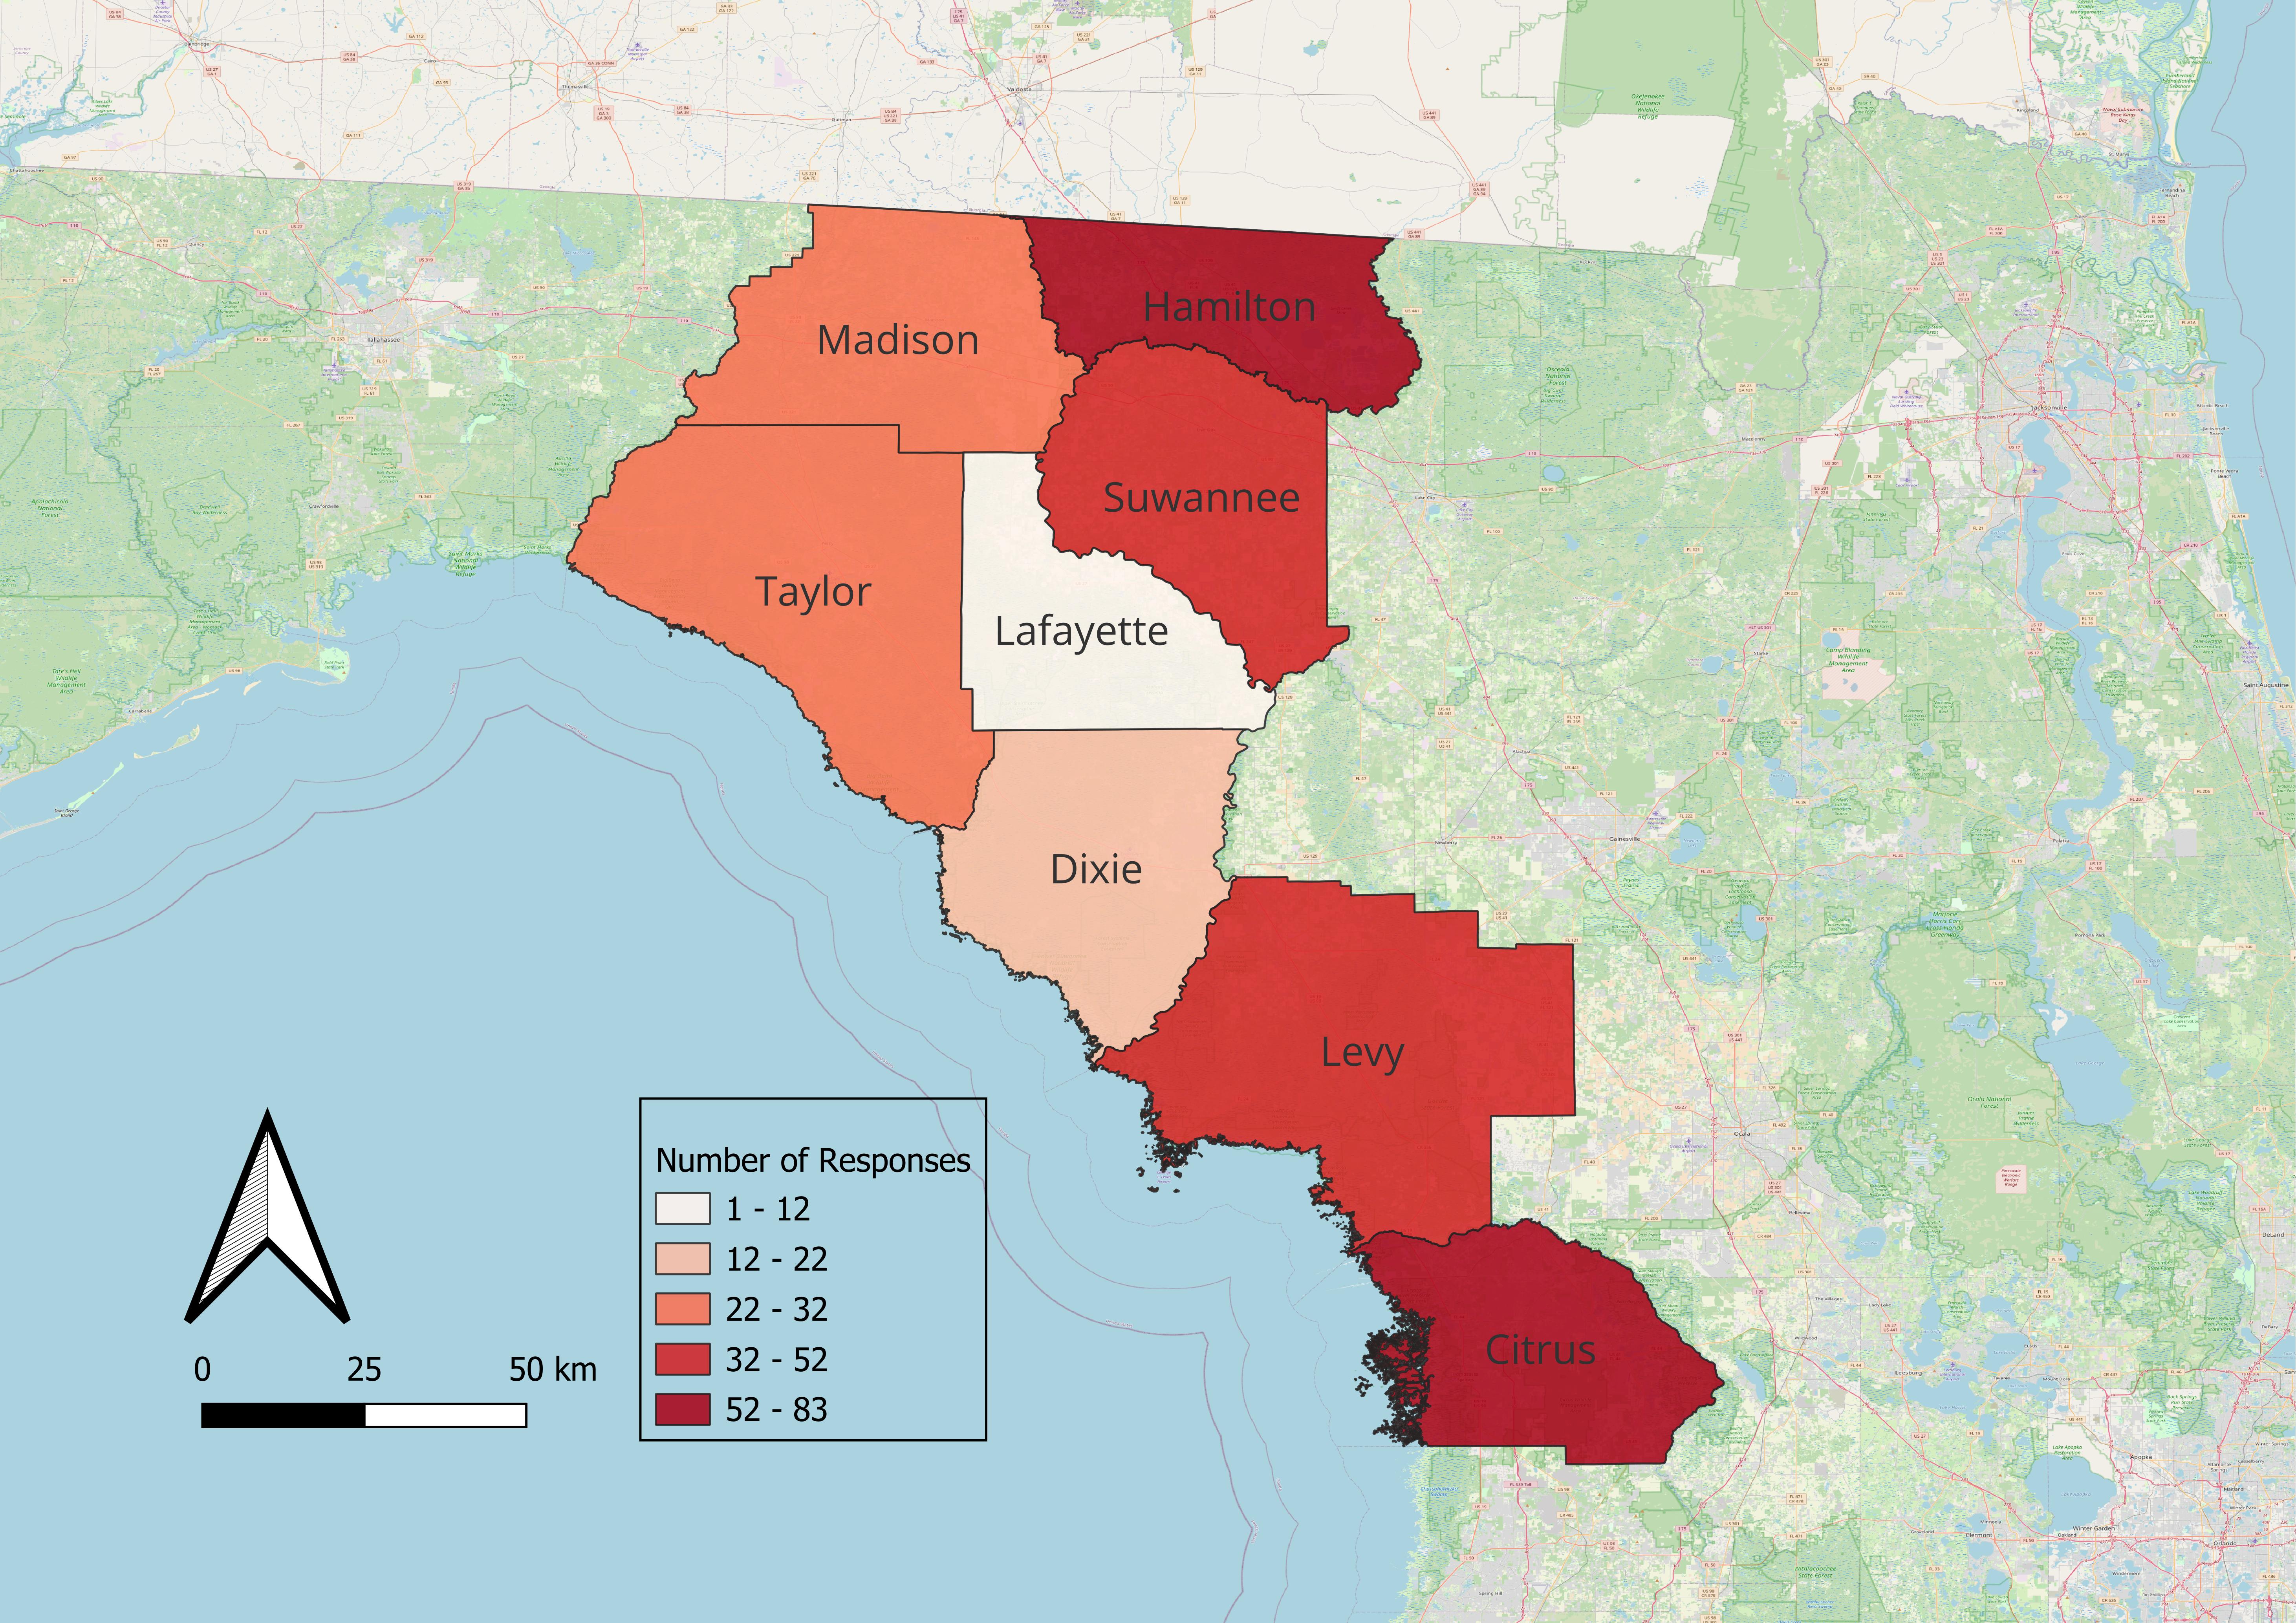
This study used a mixed-method explanatory research approach to analyze the experiences and perceptions of residents in the Big Bend region, including the counties of Citrus, Dixie, Hamilton, Lafayette, Madison, Levy, Suwannee, and Taylor (Figure 1). We collected survey (n=327) and interview (n=12) data to assess the role of transportation as a social determinant of health during Hurricane Idalia. Specifically, this study examined the extent to which transportation-related factors (e.g., vehicle ownership, disability) constitute barriers preventing people from evacuating before the hurricane or accessing healthcare and food for the whole duration of a hurricane’s impact. The findings help elucidate how transportation insecurity affects evacuation decisions and how transportation disadvantaged communities cope with healthcare and food access problems during hurricanes.
Literature Review
As a means for people to access essential resources, transportation is an important social determinant of health (Brennan et al., 20081; World Health Organization, 20082). In most U.S. regions, not having a car or being unable to drive makes it hard for people to engage in social activities and to access healthcare services and healthy food, which often results in poorer health outcomes (Wolfe et al., 20203). Previous research has suggested that significant health disparities exist between transportation-disadvantaged populations and others (Rachele et al., 20174). For example, low-income populations tend to have fewer transportation options to reach stores selling healthy food and are more likely to suffer health consequences such as diabetes and obesity (Treuhaft & Karpyn, 20105). During a hurricane, transportation is critical for individuals and households to evacuate to safe places and to obtain life-sustaining resources, such as food and healthcare. The lack of transportation options makes it harder for people to evacuate to safe places, which may cause them to be trapped in dangerous flooding and to suffer from post-traumatic stress (Golitaleb et al., 20226). Moreover, a hurricane’s disruptive effects on the local built environment tend to exacerbate the healthcare and food access issues faced by many transportation-disadvantaged populations throughout the storm’s aftermath.
Transportation resources offered by public entities and members of one’s social network play a crucial role in mitigating the health impacts of hurricanes. For example, carless and special needs populations (which include people with access and functional needs and tourists) often rely on public transportation, family, friends, or other social support systems to evacuate to shelters or other safe locations. Emergency evacuation planning for these populations has been a major research topic since Hurricane Katrina, during which many people were unable to evacuate due to a lack of transportation. For example, studies have analyzed state and local transportation policies and practices for evacuating the carless and special needs populations (Wolshon et al., 20057), as well as volunteering and community-helping behavior (Yumagulova et al., 20218). However, much of the existing research focuses on whether and what type of resources are provided, with little attention paid to understanding the needs, preferences, and behaviors of the transportation-disadvantaged populations.
Notably, while fundamental theories such as Protection Motivation Theory (Rogers, 19759), the Protective Action Decision Model (PADM; Lindell & Perry, 200310, 201211), and the Risk Information-Seeking and Processing Model (Griffin et al., 199912) have emphasized the role of risk perception and assessment in shaping evacuation decision-making, little work has been done to comprehensively incorporate transportation-related factors into existing modeling frameworks. To date, little is known about the challenges faced by transportation-disadvantaged populations and how these challenges shape their evacuation decision-making. Moreover, studies on the importance of transportation during hurricanes are largely constrained to the topic of evacuation, leaving out other important aspects such as providing access to other essential services and resources (e.g., food and healthcare). A study on Hurricane Harvey has shown that food retailers in lower-income communities with chronically low numbers of supermarkets, places often referred to as food deserts, were closed longer than other stores (Rosenheim et al., 202413), potentially exacerbating pre-existing food insecurities. If this is universally true, transportation becomes even more crucial in addressing food insecurity during hurricanes, as it enables people to access food from distant locations when local supplies are disrupted.
In sum, while the link between transportation and health is well established by the literature, we have limited understanding of the role of transportation as a social determinant of health both during and after hurricanes. Specifically, we lack knowledge of the extent to which transportation-related factors (e.g., vehicle ownership, disability) constitute a major barrier to evacuating before a hurricane and to accessing healthcare and food in the aftermath. We also lack understanding of the transportation challenges faced by transportation-disadvantaged populations, their help-seeking behaviors, and to what extent the assistance offered by public and private entities addresses their travel needs. Hurricane Idalia offers a unique opportunity for us to address these research gaps by exploring both the direct impact of transportation-related factors on evacuation decisions and their influence on the decision-making process.
Research Questions
This report addresses two research questions:
- How did transportation-related factors affect residents’ evacuation decision-making during Hurricane Idalia, not only through their direct effects but also through their indirect effects on risk perceptions?
- How did transportation-disadvantaged populations cope with healthcare and food access challenges in the aftermath of Hurricane Idalia?
Research Design
To answer these questions and understand the effects of Hurricane Idalia on groups with transportation disadvantages, we employed an explanatory mixed-method approach that involved conducting a survey followed by semi-structured interviews among a subsample of survey respondents. These methods are described in more detail below.
Study Site and Access
Our study involved surveying and interviewing residents of the Florida Big Bend region that was impacted by Hurricane Idalia. Specifically, the study areas included Citrus County, Dixie County, Hamilton County, Lafayette County, Madison County, Levy County, Suwannee County, and Taylor County (see Figure 1). The study region is predominantly rural with low population densities. Considerable proportions of the population are over age 65 (25%), have disabilities (21%), or are living in poverty (17%) (U.S. Census Bureau, 202314). In addition, a notable share of households are carless (5%). Few transportation options are available in these areas, making it difficult for the carless population or others with access and functional needs to evacuate. News outlets, for example, reported that some older adults in Cedar Key, Levy County, which is part of our study area, were unable or refused to evacuate despite dire warnings from officials (Levenson, 202315). Moreover, the limited number of healthcare facilities and food retailers available in the region made the healthcare and food systems extremely vulnerable to disruptions. In response to Hurricane Idalia, the Florida Department of Health staged mobile field hospitals and emergency rooms in several counties and deployed seven strike teams while nonprofit food banks mobilized to distribute meals and food to the impacted region (Lyons, 202316; Thomas, 202317).
Figure 1. Florida Counties in Study Area
Survey
Survey Measures
The survey instrument was adapted from two existing survey instruments, including one used in a Hurricane Ian evacuation study conducted by co-PIs Zhao and Huang (Zhao & Huang, 2023-202418) and another used in a study about transportation (in)security (Murphy et al., 202119). Specifically, the survey followed the three-stage framework and definitions proposed by PADM, incorporating questions on evacuation decisions, travel-related logistics, risk perceptions regarding both hazard-related and resource-related concerns, as well as socioeconomic and demographic characteristics (Lindell, 201820). We also adapted the questions from the transportation security index questionnaire to assess respondents’ access to various transportation options and the challenges they face in reaching healthcare and food establishments throughout Hurricane Idalia’s impact. In addition, survey questions regarding individuals’ knowledge, attitudes, and usage of transportation options available through public agencies or their social network (e.g., family and friends) and to what extent these resources address their travel needs were included.
Survey Sampling and Participants
We combined the use of convenience sampling and geographically stratified sampling to recruit respondents. Specifically, we reached out to state and county government agencies (Florida Commission for the Transportation Disadvantaged, County Offices of Emergency Management, and County Public Health Departments), transportation service providers (Big Bend Transit, Citrus County Transit, Suwannee River Economic Council), nonprofit organizations (Feed Florida, Farm Share), and neighborhood associations to request their help in distributing the online survey. This approach only resulted in 10 responses. We also conducted in-person recruitment at public locations (e.g., at the Hamilton County Emergency Management EXPO event), during which tablets were offered to respondents for offline survey taking. This approach led to a total of 83 responses. An incentive of a $15 Amazon gift card was offered to each survey participant recruited from the first two approaches. To increase the sample size, we employed Qualtrics to recruit an additional 234 individuals from the study area.
Survey Data Analysis Procedure
Upon completing data collection, we first conducted descriptive analysis of the survey data to develop a general understanding of respondents’ evacuation decision-making across population groups and whether they experienced healthcare/food access challenges during Hurricane Idalia. Then, we applied structural equation modeling with IBM SPSS Amos software (Amos 26) to examine the hazard- and transportation-related perception changes between respondents’ normal life and the hurricane striking period and to explore the comprehensive mechanism of respondent’s evacuation decisions. Table A1 in the appendix provides a full list of the variables we tested in the model specification process.
Interviews
Participant Selection and Data Collection
We invited a subset of the survey respondents to participate in a 20- to 30-minute semi-structured interview. We aimed to recruit a diverse range of participants, with special efforts to include transportation-disadvantaged populations. We stopped recruitment upon reaching a sample size of 12 due to data saturation. Each interviewee received a $30 Amazon e-gift card. The interviews allowed us to obtain detailed information on individual experiences related to transportation and understand the contextual factors underlying people’s evacuation decisions and healthcare/food access behaviors. The results shed light on individual decision-making before, during, and after a hurricane, the role of transportation barriers in shaping these behaviors, and the extent to which transportation assistance from public and private entities mitigated the impacts.
Interview Data Analysis Procedure
The research team used NVivo qualitative data analysis software (Version 12 Plus) to analyze the semi-structured interview transcripts. Interview transcripts were analyzed via thematic analysis (Nowell et al., 201721). The research team coded using a combination of inductive and deductive approaches (Northcutt & McCoy, 200422). Before analyzing the data, the research team developed a list of the deductive codes that corresponded with this study’s research questions and anticipated responses. The inductive codes were data-driven, or emergent codes, which were not anticipated in advance. Coders identified topics that participants discussed through descriptive or topical coding, which describes the coding with descriptive nouns (Saldana, 201523). This coding allowed us to gain a nuanced understanding of how affected populations coped with transportation challenges during the hurricane, whether and how they sought for transportation assistance from public agencies or private entities, and their perceptions and experiences of using these resources for food and healthcare access.
Ethical Considerations and Researcher Positionality
Since this project builds on a previous hurricane evacuation study, the research team submitted an amendment, along with the revised survey, to our existing Institutional Review Board protocol (#IRB201903432) at the University of Florida; the amendment was approved in October 2023. Ethical conduct was ensured by asking all participants to provide their consent before taking the survey, reminding respondents that they could stop the survey at any time. Both survey ($15) and interview ($30) participants are compensated. To protect privacy, the data collected were anonymized and stored in password-protected computers. Study results are published in aggregate forms (e.g., via modeling results), and we plan to share important findings and actional insights with local communities and partners in the near future. Our team has extensive knowledge of Florida and hurricane disaster responses, and we acknowledge the importance of reflexivity in minimizing potential biases. To minimize study bias, we employed both surveys and interviews to triangulate findings and made concerted efforts to recruit study participants from disadvantaged backgrounds to ensure representation.
Findings
Sample Demographics
As shown in Table A2 in the appendix, most survey participants were female (73%) and white (67%). The mean age of respondents was 48. Their education levels varied: nearly 30% had a high school degree or less, 37% had pursued some college or vocational training, 22% had finished a bachelor’s degree, and 11% had a postgraduate degree. Regarding annual household income nearly half (47%) of participants earned less than $45,000 a year. A majority (55%) of participants had lived in their home for 10 years or less and almost half (49%) lived in a detached single-family home. The mean number of working-age adults (18 to 64 years old) in each household was 1.88, while the mean number of older adults (65 or older) in each household was 0.47. Finally, although some respondents reported having family members with limited mobility, an overwhelming majority (90%) did not have anyone in their household with a disability or medical condition that prevented them from traveling alone.
Transportation Insecurity
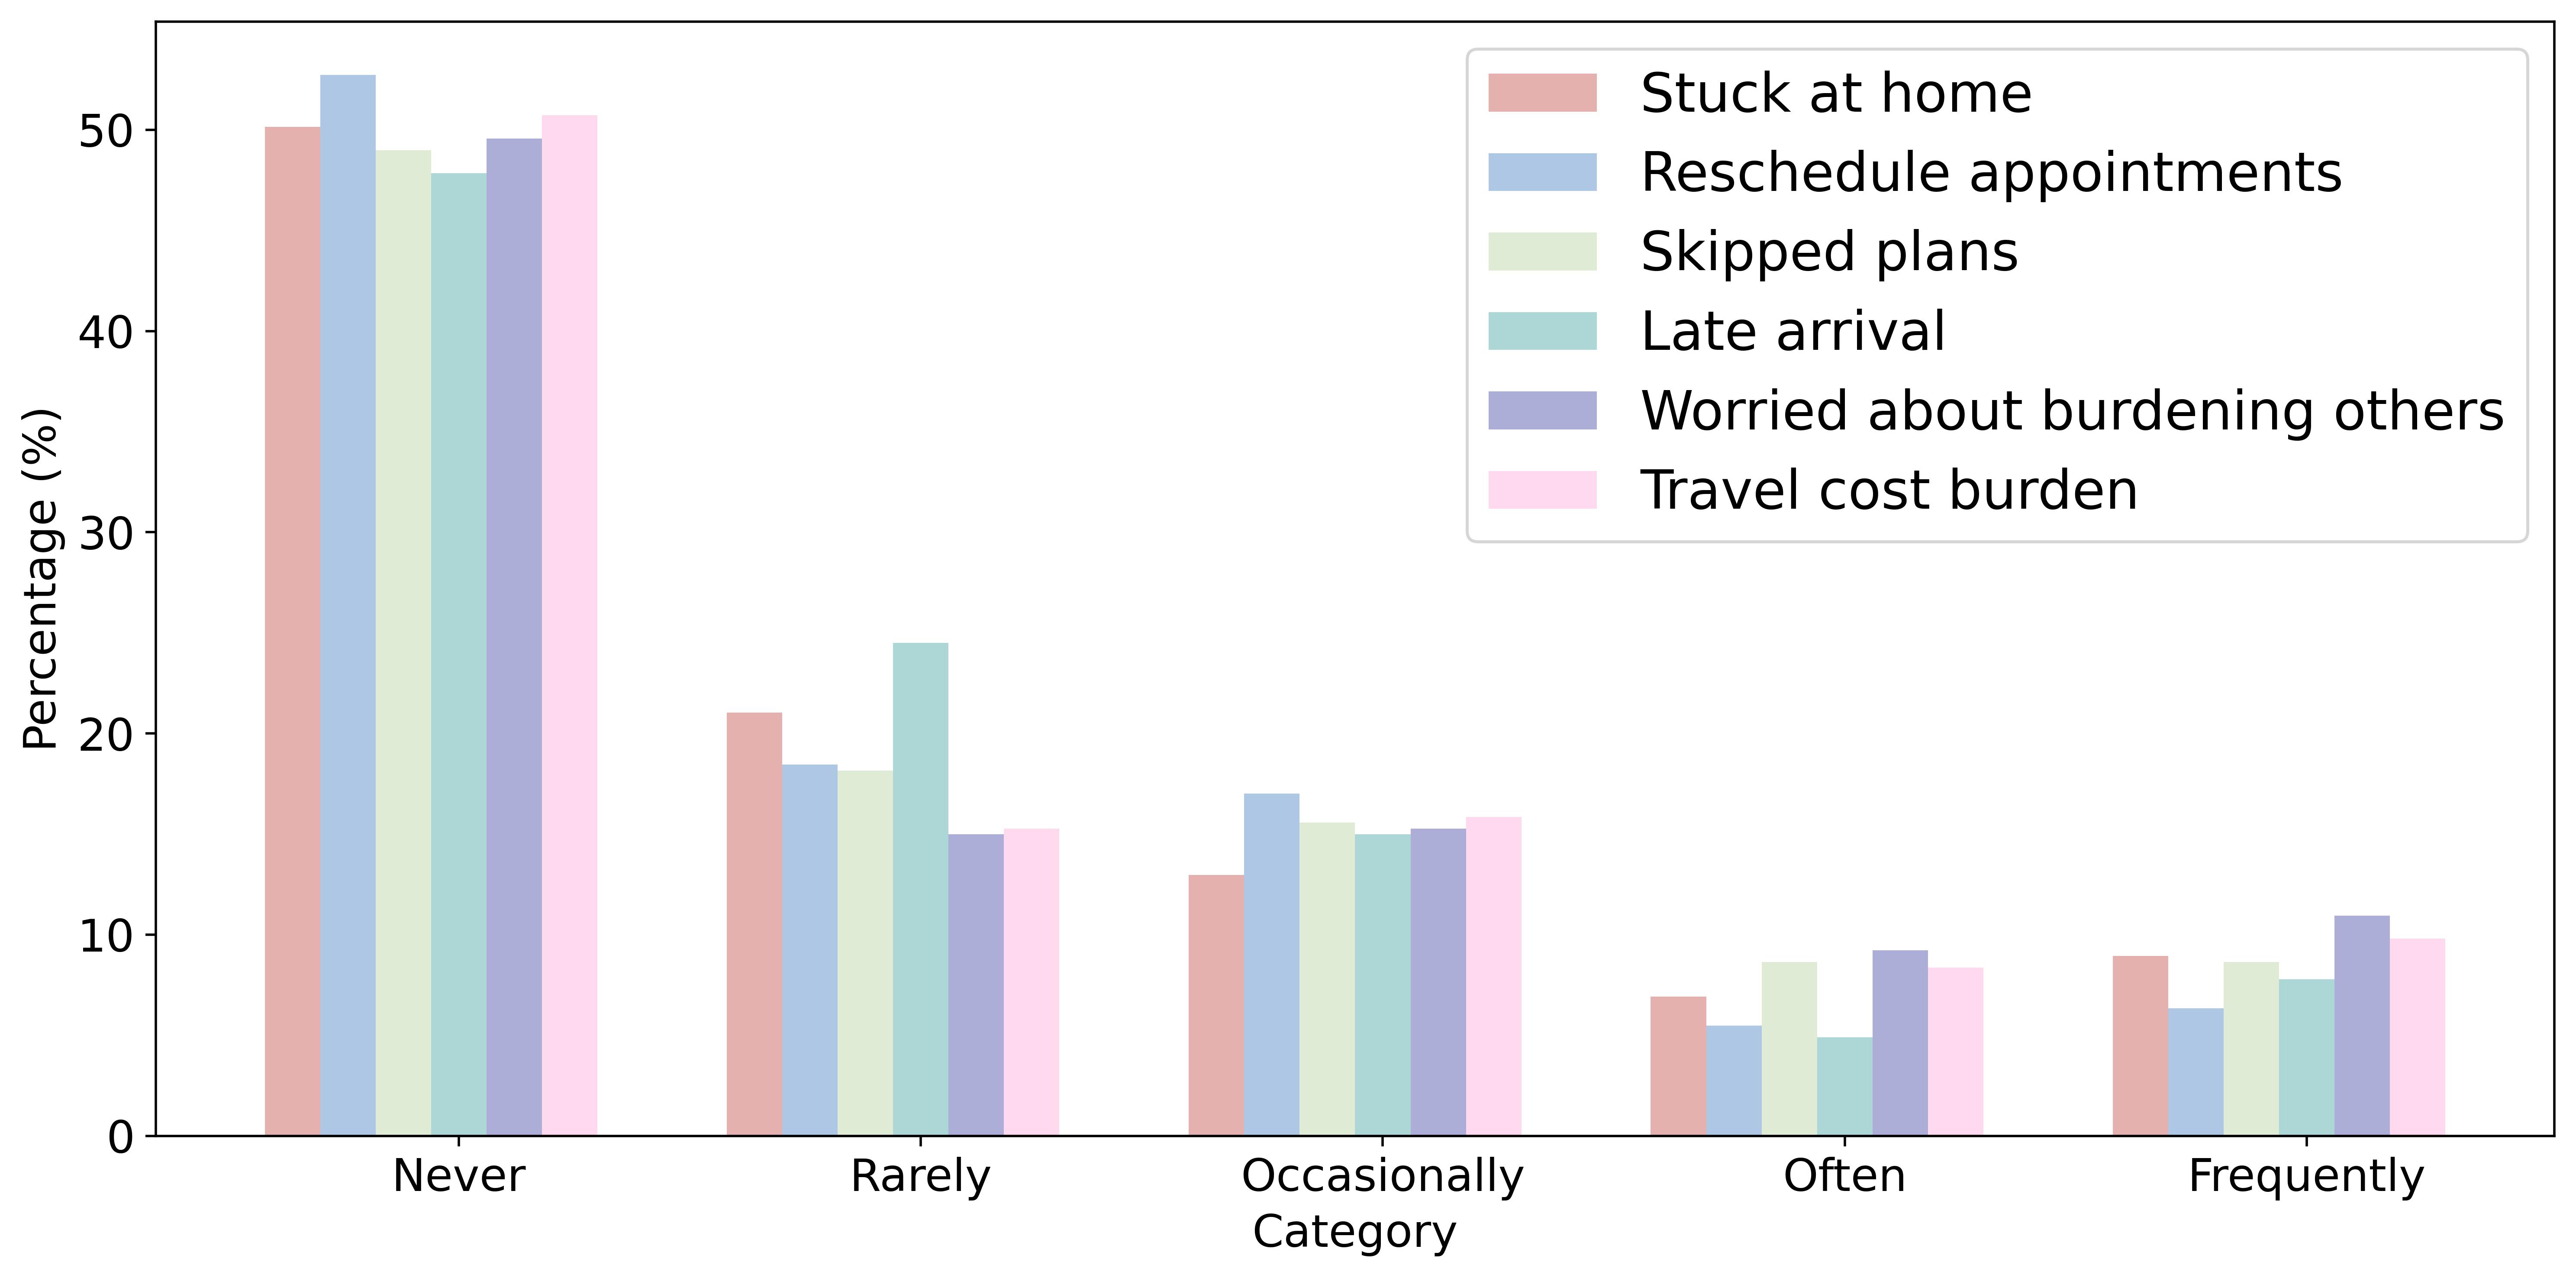
We adopted the six-item transportation security index tool developed by Murphy et al. (2024)24 to assess how frequently survey respondents experience any of the following due to transportation problems: “felt stuck at home,” “had to reschedule an appointment,” “skipped going somewhere,” “arrived late to somewhere,” “worried about inconveniencing family, friends, or neighbors,” or “had difficulties paying transportation-related expenses such as the cost of gasoline or public transportation.” Figure 2 presents the survey results. For all statements, around 50% of survey participants reported that they had “never” experienced transportation-related insecurities, while 20% of participants reported experiencing insecurities “rarely,” 15% “occasionally,” 10% “often,” and 5% “frequently.” The participants reported similar frequencies across the six statements. However, their transportation insecurity was often situational. For example, when asked if they ever missed appointments due to transportation issues, one respondent said “sometimes, sometimes, yeah.” Yet in many instances individuals find a way around it, as this interviewee expressed that they “get [their] daughter to take [them] to the store.”
Figure 2. Percentage of Respondents Facing Transportation Insecurity
Food Insecurity
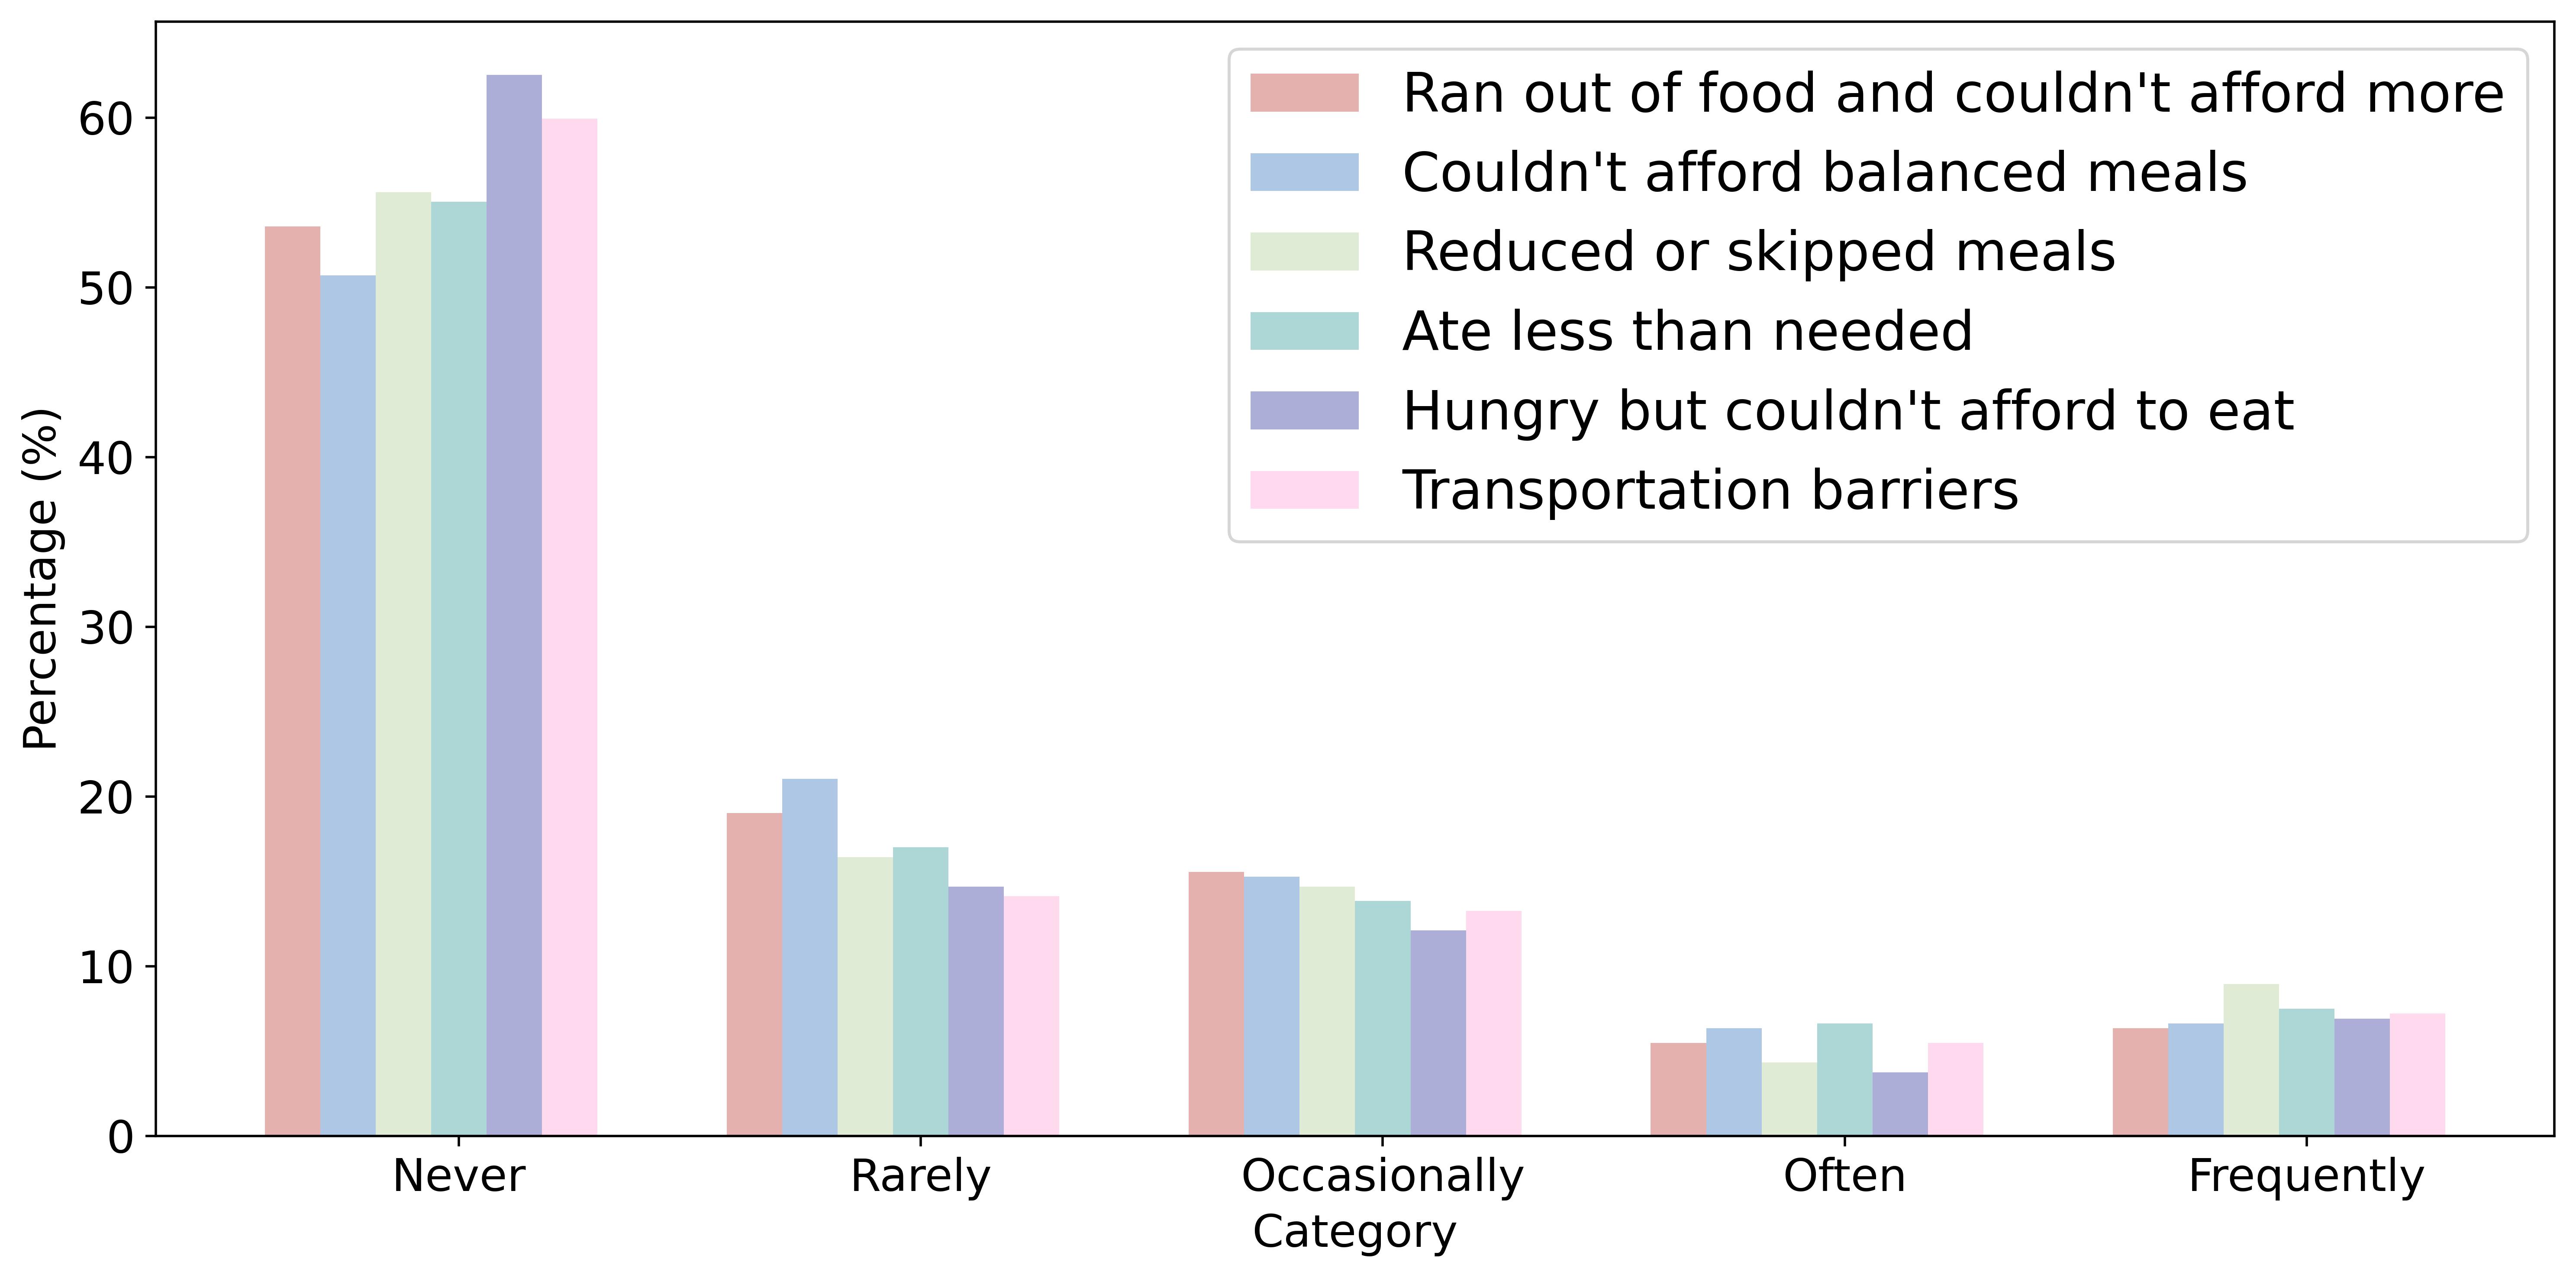
We used the U.S. Department of Agriculture’s six-item short form food security survey module (Blumberg et al., 199925) to ask participants how often they experience food insecurity. Results are shown in Figure 3. Similar to transportation insecurity, we found that 50-60% of survey respondents reported that they “never” experienced any of the six indicators of food insecurity, with 10-20% of participants indicating that they “rarely” or “occasionally” experienced food insecurities, and the remaining 5-10% of participants indicating that they “often” or “frequently” experienced them. These responses do not vary much across statements. The interviews suggested that the Supplemental Nutrition Assistance Program, commonly known as “food stamps,” appeared to have alleviated the food insecurity during the survey period. When the hurricane approached, one interviewee explained, the “food stamps… came early so that was good help.”
Figure 3. Percentage of Respondents Facing Food Insecurity
Grocery Shopping and Medical Trips
Survey questions also asked about the respondents’ frequency of grocery shopping and medical trips in the year prior to Hurricane Idalia. As Figure 4 shows, grocery stores such as Walmart, Publix, and Target were the locations most frequently visited by respondents for grocery shopping, followed by convenience stores and farmers’ markets or local farms. While most respondents appeared to obtain groceries from places with a wide selection of healthy food options (e.g., grocery stores, farmers’ markets, and wholesale clubs), over 35% of participants indicated that they obtain groceries from convenience stores regularly (one or more times each week). Additionally, over half of the participants have never used food banks or food pantries, but over 10% of participants visited them at least once a week.
Figure 4. Typical Frequency of Grocery Trips to Various Types of Stores in the Year Prior to Hurricane Idalia
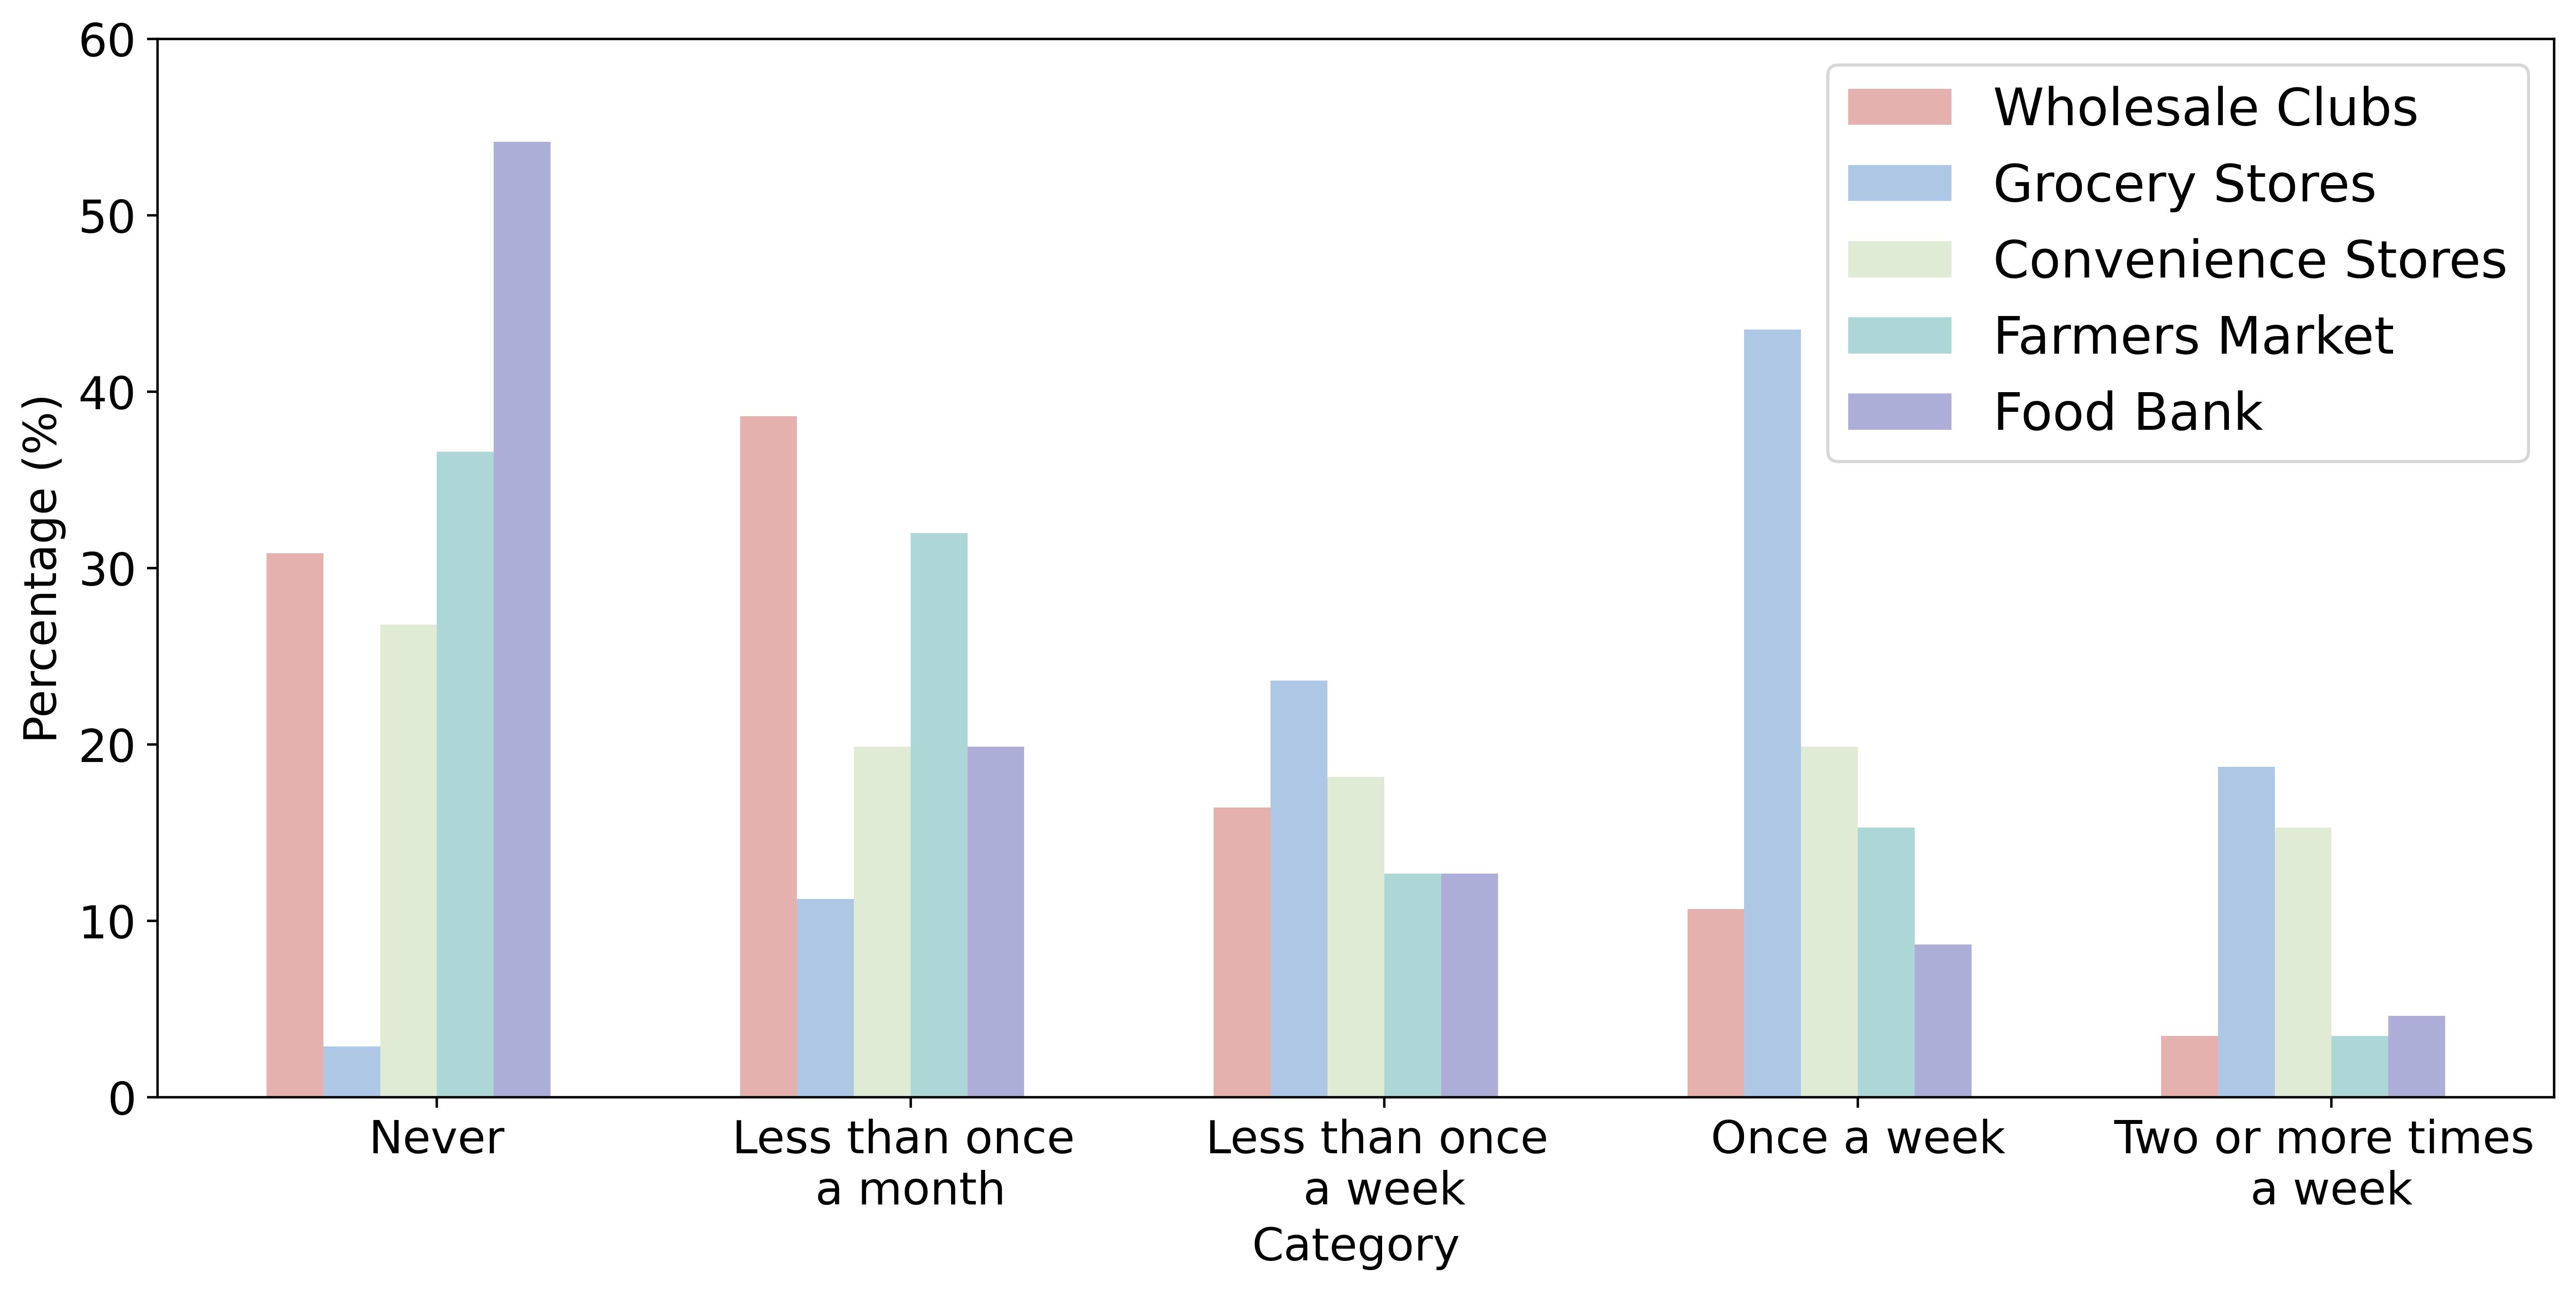
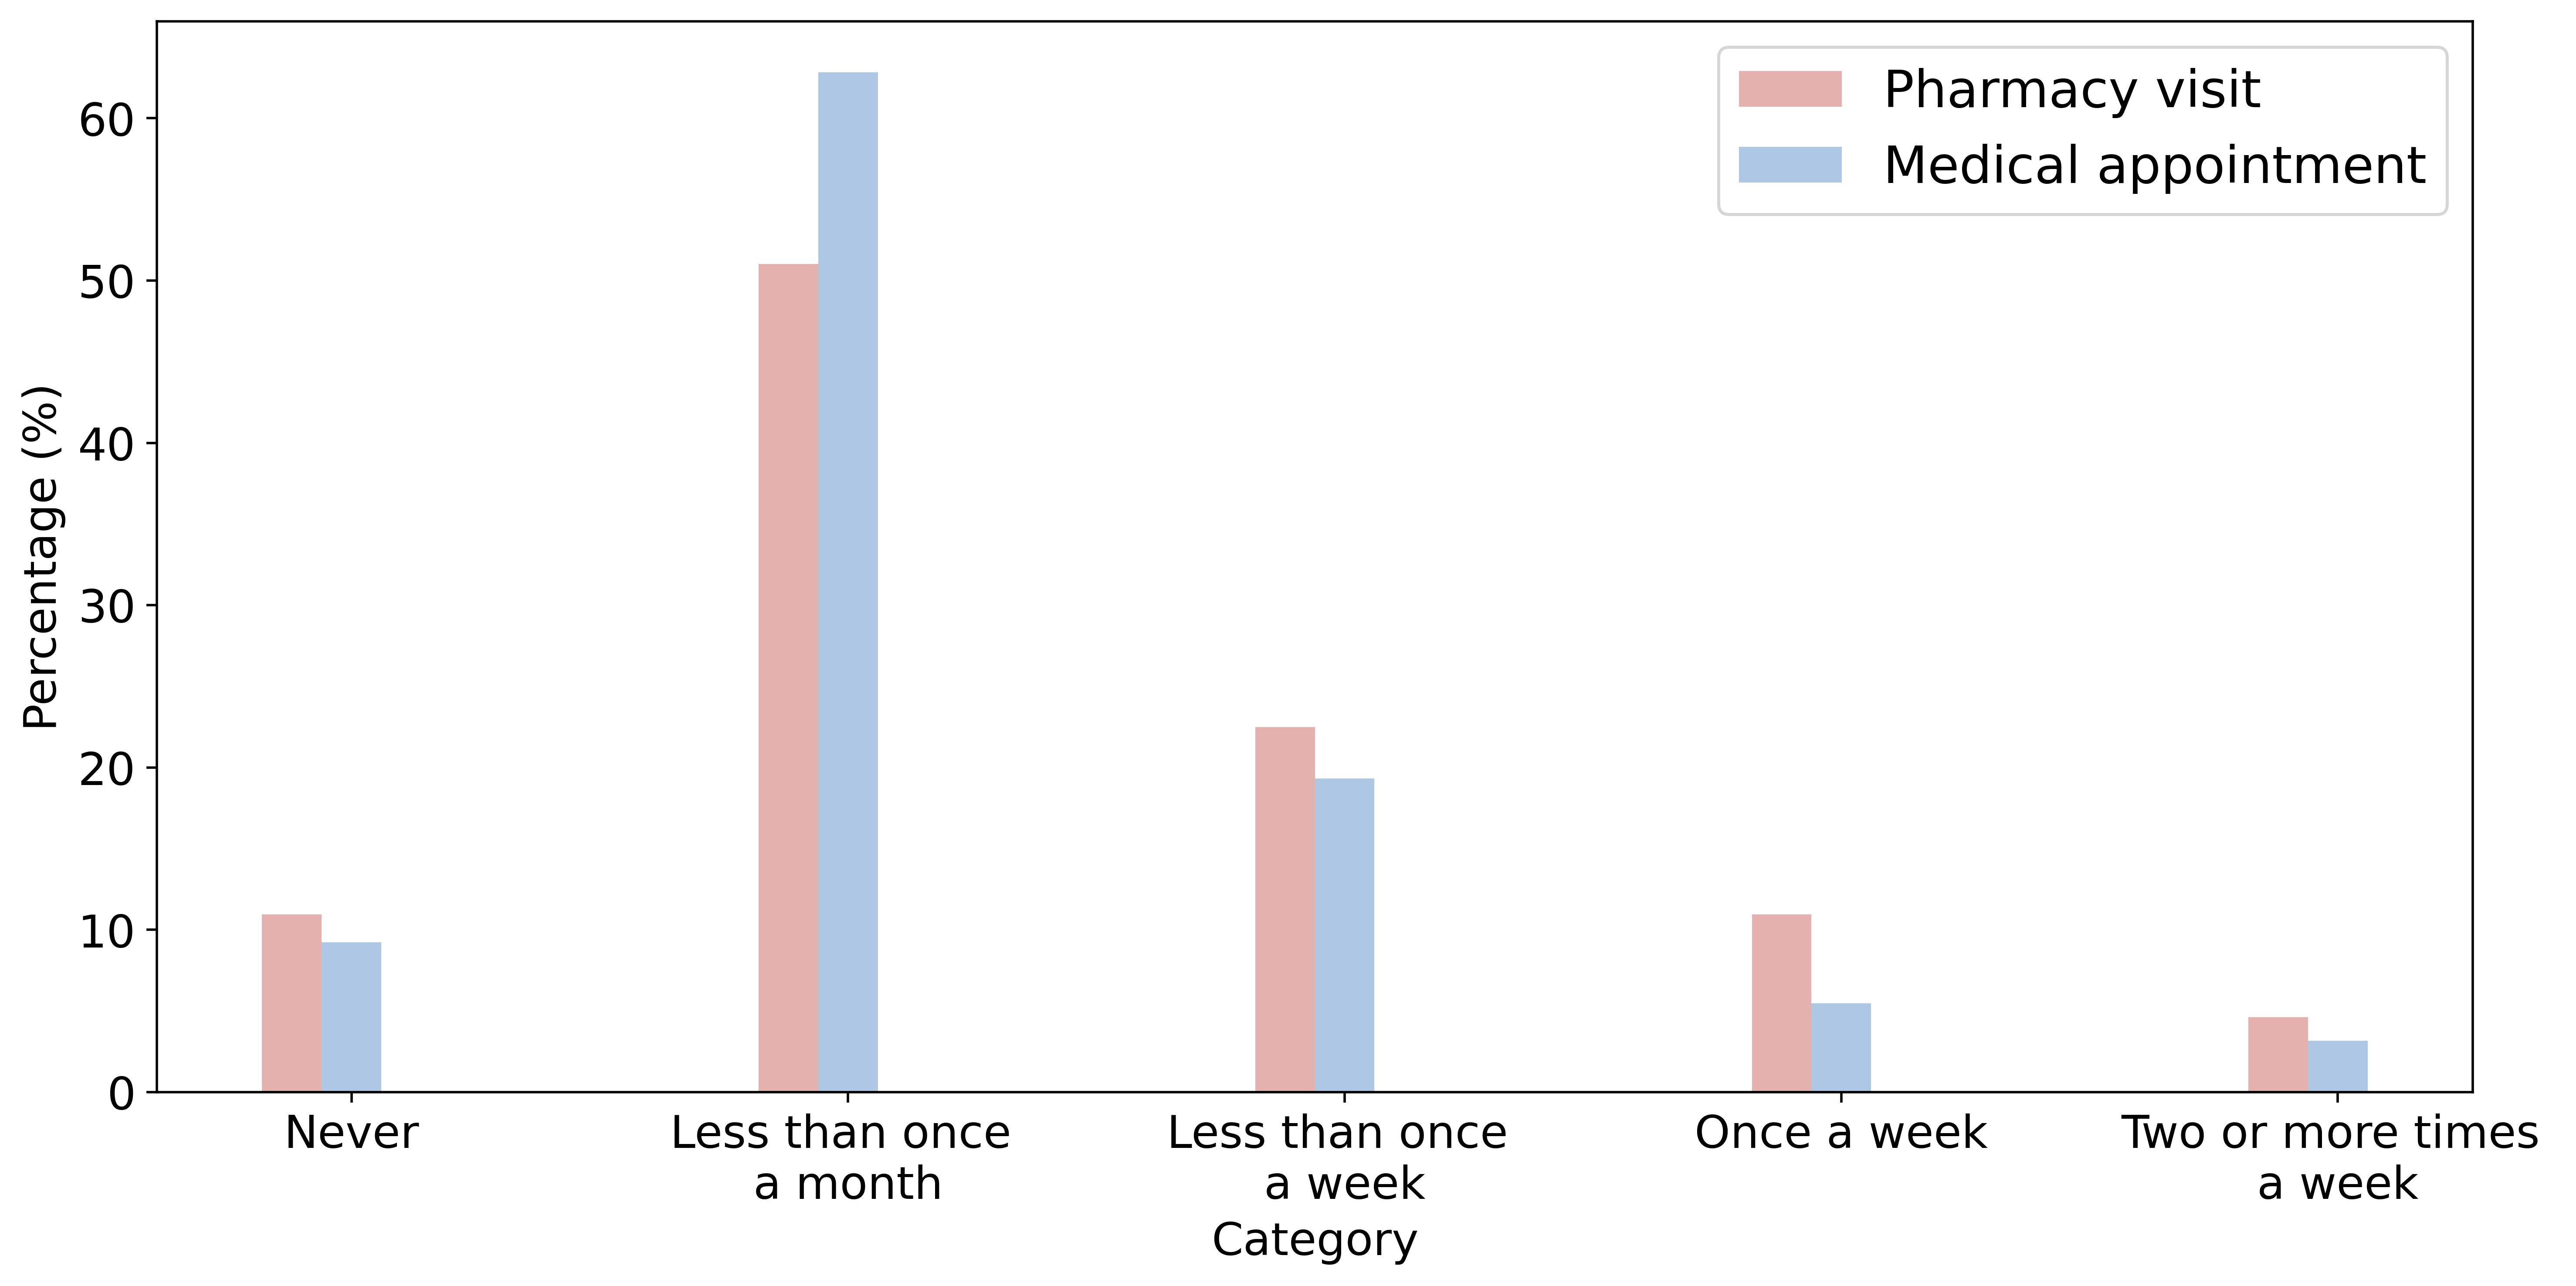
Figure 5 shows the typical frequency of medical appointments or pharmacy visits made by survey respondents in the year prior to Hurricane Idalia. Most respondents (over 60%) reported visiting frequency of “never” or “less than once a month.” However, about 15% of participants had weekly medical appointments and nearly 10% had pharmacy visits at least once a week, indicating extensive medical needs.
Figure 5. Typical Frequency of Medical Appointment or Pharmacy Visits in the Year Prior to Hurricane Idalia
Risk Perceptions
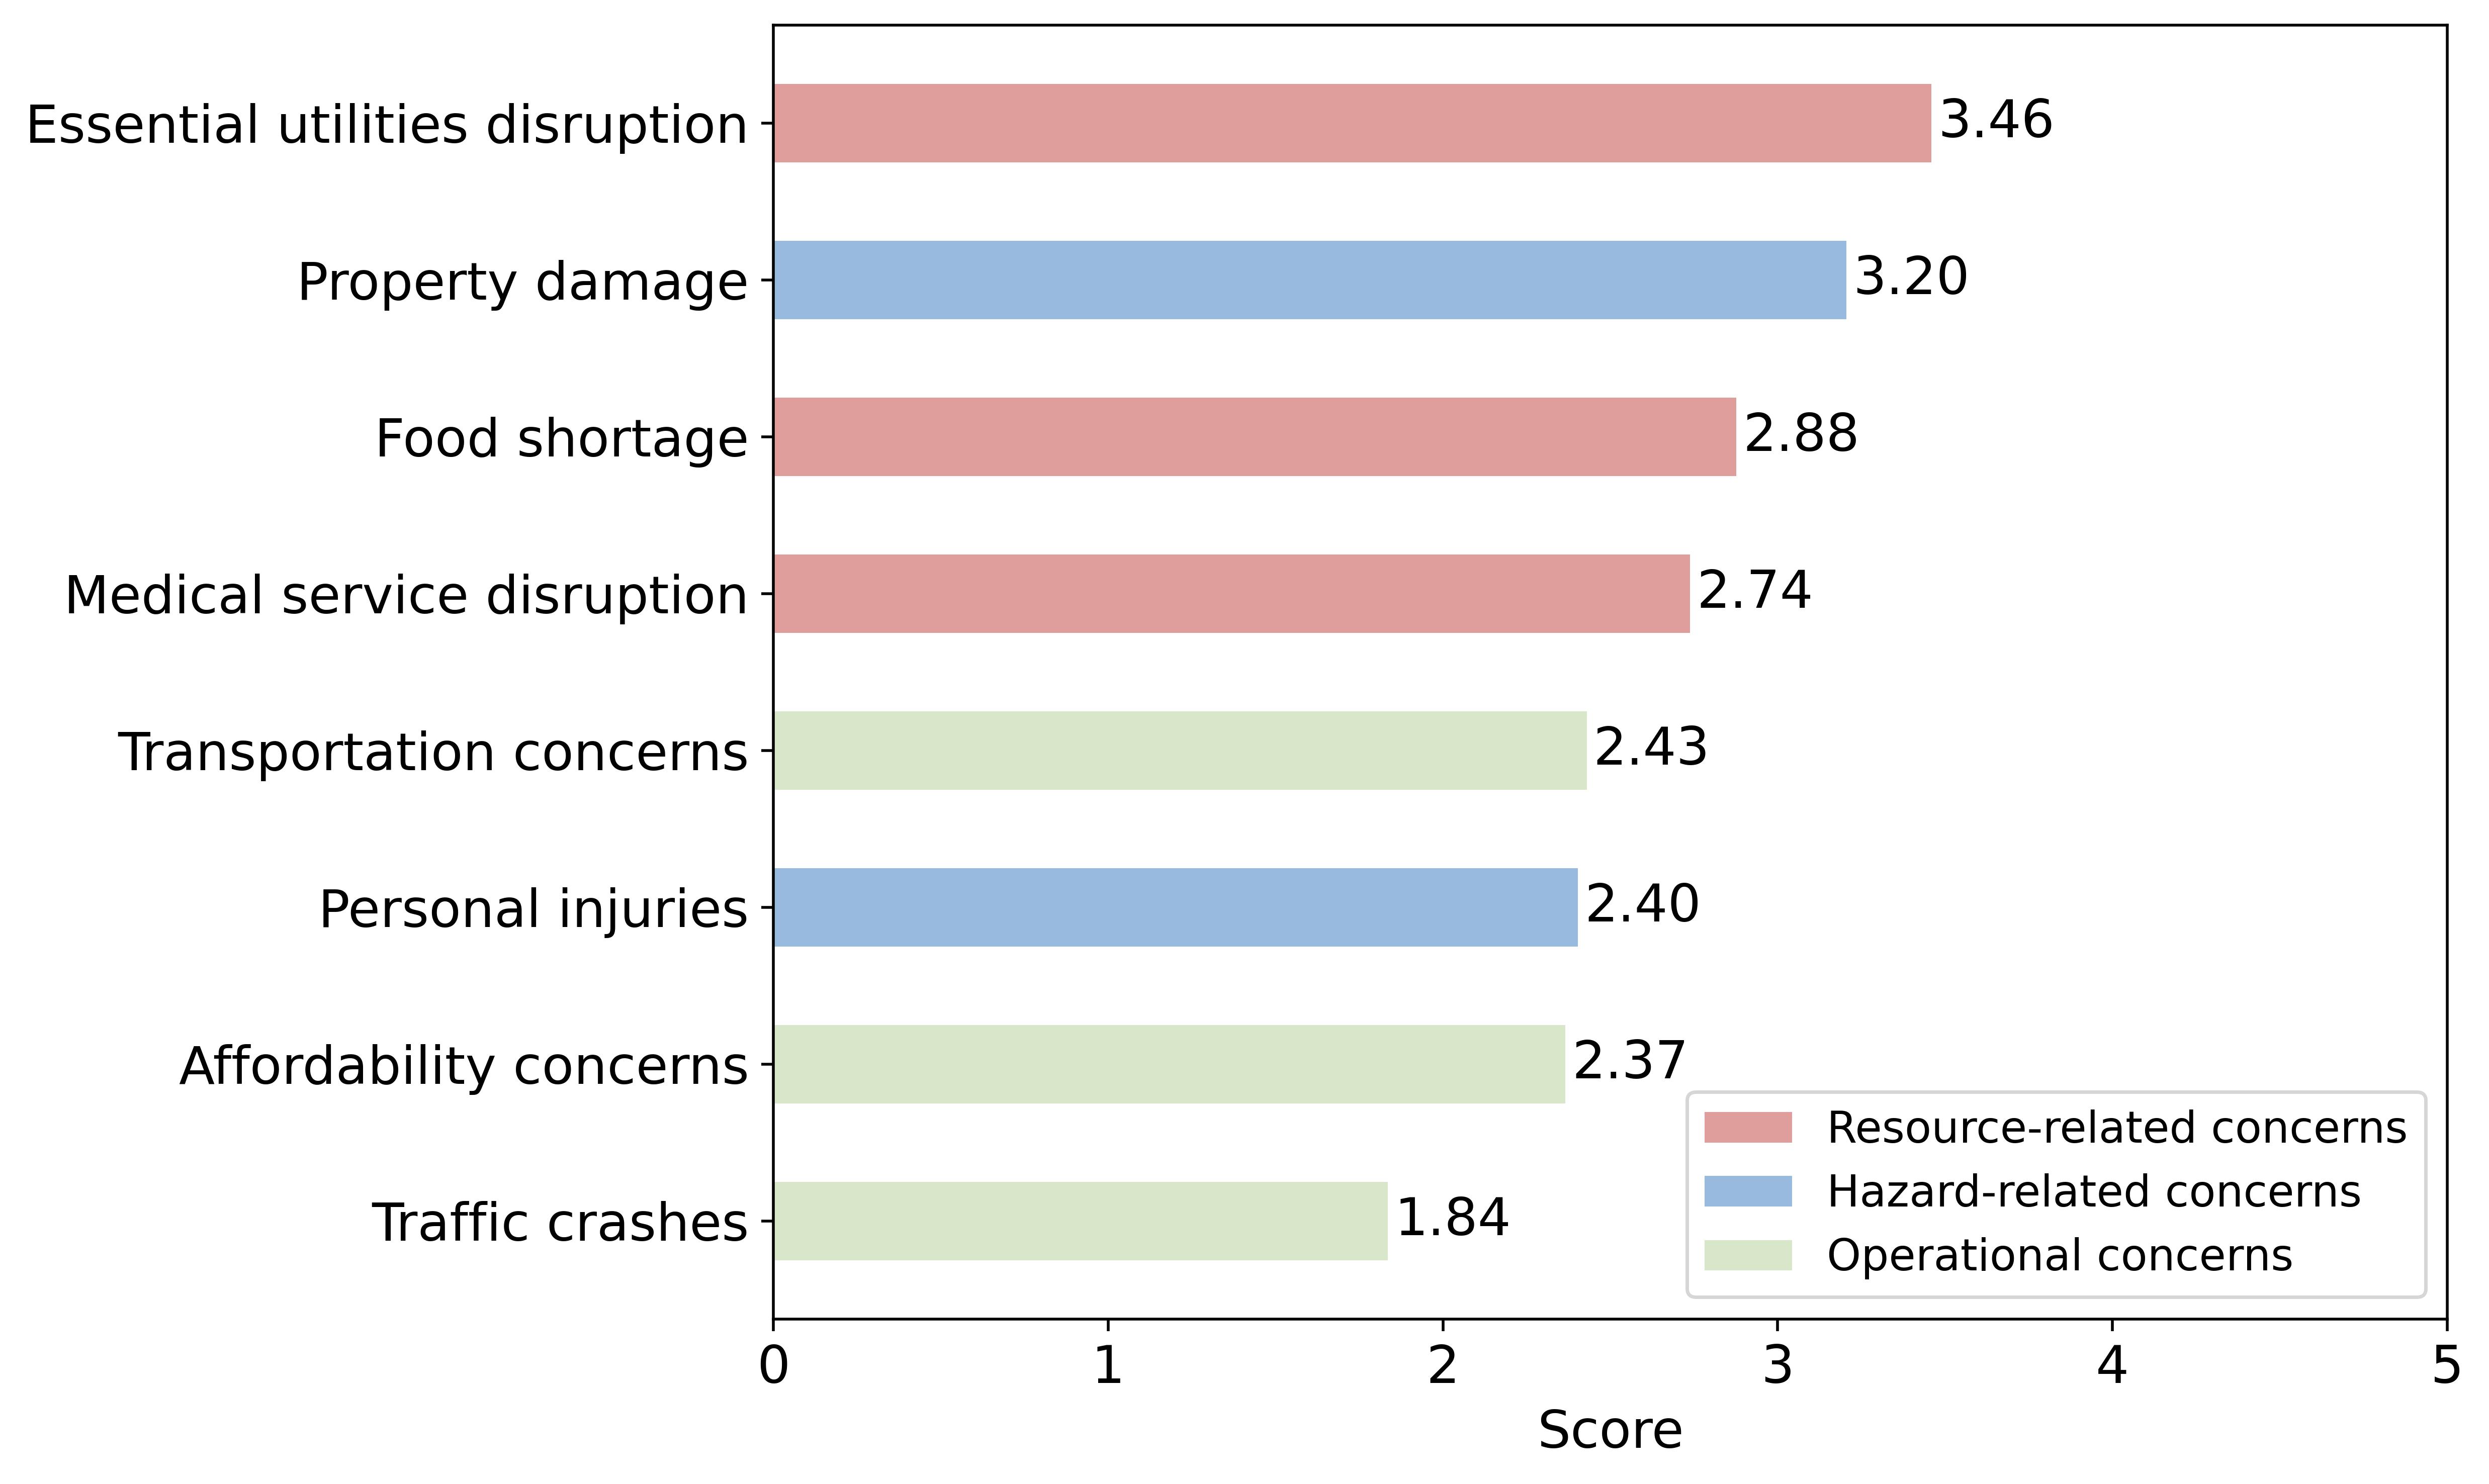
Respondents were asked to report their risk perceptions by rating their concerns about eight potential impacts at two different time periods: in the year before Hurricane Idalia and as the storm was approaching. The eight potential impacts included personal injuries, property damage, medical service disruption, essential utilities (e.g., water and power) disruption, food shortage, affordability concerns, transportation concerns, and traffic crashes. Respondents were asked to rank each potential impact item on a 5-point Likert scale, with 1 representing not concerned at all and 5 representing concerned to a very great extent. After conducting a factor analysis on the collected responses, we obtained three factors which we labeled as (1) resource-related concerns—medical service, essential utilities, and food supply disruptions, (2) hazard-related concerns—personal injuries, property damages, and (3) operational concerns—affordability, transportation, and traffic incidents.
Figure 6 shows that as the hurricane approached, respondents reported moderate levels of concern for resource-related issues and hazard-related issues, but relatively low concern for operational issues. Moreover, MANOVA tests revealed significant differences between the two time periods (i.e., the year prior to the Hurricane and as the storm approaches), within-attribute concerns, and their interactions. These findings suggest that respondents’ concerns shifted as the hurricane approached, with varying degrees of change across different types of concerns. Post hoc tests revealed that hazard-related concerns saw the largest increase, followed by resource-related concerns, and operational concerns.
Figure 6. Respondent Ratings of Specific Areas of Concern
Evacuation Decisions
As shown in Table 1, about a quarter of the respondents (N=76) decided to evacuate during Hurricane Idalia, while the rest decided to stay in their residence. Some of the evacuations were mandated by government authorities, as illustrated by this interviewee’s statement: “I was gonna stay. However, when the police came through and said we had to get out. I got out.” We asked evacuees some follow-up questions to learn more about their evacuation process and decisions. Results showed that the most common method of evacuation among respondents was driving their own personal vehicle, which 61% of evacuees did, or riding in someone else’s vehicle, which 30% of evacuees did. The remaining 9% of evacuees either took a rideshare service, used public transit, drove a rented or borrowed vehicle, or used another option. The most common evacuation destination was the home of a friend or relative, chosen by 57% of evacuees. Additionally, 24% stayed at a hotel or motel, 11% traveled to a second residence, 8% went to a public shelter, and 1% stayed at a park or campground.
Table 1. Transportation Mode and Destination Choices Made by Respondents Who Evacuated
| Modes of Transportation | Personal Vehicle Rode with Someone Else Othera Took Rideshare Service (e.g., Uber, Lyft) Used Paratransit or Other Accessible Transportation Services Used Public Transit Drove Rented or Borrowed Vehicle |
60.53 30.26 3.95 1.32 1.32 1.32 1.32 |
| Destination Choice | Home of Friend/Relative Hotel/Motel Second Residence Public Shelter Park or Campground |
56.58 23.68 10.53 7.89 1.32 |
Baseline Model of Evacuation Decision and Tests of Mediating and Moderating Effects
Following the statistical analysis approach in recent hurricane evacuation literature (i.e., Huang et al. 201626), we used structural equation modeling to develop a baseline model of evacuation decisions by entering sociodemographic variables and risk perception variables and optimizing the model specification with a backward selection approach. In contrast to previous findings (e.g., Huang et al., 201227; Huang et al., 2016), the results showed that respondents’ previous experience with evacuation had the strongest effect on the decision to evacuate, followed by operation-related concerns and household size. Being married was found to be an insignificant predictor. As risk perception and assessment variables were strongly correlated (r = .51, p < .001), the significant effects of hazard-related and resource-related concerns were expected to be mediated by operation-related concerns. In other words, the effect of operation-related concerns reflects the overall effect of risk perceptions. The full baseline model showing these effects can be found in the Model I column of Table 2.
Table 2. Regressions of Evacuation Decisions and Tests of Mediating Effects
| Married | ||||||||||||||||
| Household Size | ||||||||||||||||
| Prior Hurricane Experience | ||||||||||||||||
| Operation Concerns | ||||||||||||||||
| Hazard Concern Increase a | ||||||||||||||||
| Resource Concern Increase a | ||||||||||||||||
| Operation Concern Increase a | ||||||||||||||||
| Transportation Insecurity | ||||||||||||||||
| Food Insecurity | ||||||||||||||||
| Medical Service Insecurity | ||||||||||||||||
| Grocery Habits | ||||||||||||||||
| Medical Habits | ||||||||||||||||
| Self-Efficacy | ||||||||||||||||
| Constant | .47 | .55 | .48 | .48 | .67 | |||||||||||
* p < .05. ** p < .01. *** p < .001.
Next, we included variables of risk perceptions, perceived insecurities, habits, and self-efficacy into the baseline model to examine the respective effect routes. As Table 2 shows, Models I and IV suggest that increased risk perceptions and self-efficacy did not influence respondents’ evacuation decisions. Models II and III further indicate that the effects of perceived insecurities and habits are mediated by experience and risk perceptions. This finding is noteworthy. Given risk perceptions are consistently reported as having the main effect on evacuation decisions, the confirmed mediating effects suggest that transportation insecurity and food and healthcare needs do not directly trigger evacuation decisions. Instead, individuals integrate these concerns with other factors in their overall decision-making process.
The same sets of variables are also entered into a universal general linear model with the control of four predictors extracted from the baseline model to test the moderating effects. The model outputs can be found in Table A3 in the appendix. The results indicate that respondents’ frequency of medical visits would amplify the effects of experience and risk perceptions on evacuation decisions. Moreover, although minor, self-efficacy also has a significant moderating effect between experience and evacuation decisions, with those with higher self-efficacy experiencing a stronger positive influence of previous evacuation experience on evacuation. This finding suggests that transportation needs and concerns can influence how individuals process information and make evacuation decisions.
Qualitative Results
Interviewees who had previously experienced serious hurricanes understood the potential threat and were well-prepared. There was a common sentiment that the news exaggerated the potential impacts of hurricanes, making some interviewees less likely to take necessary protective actions. The respondents lived in rural areas which heavily shaped their experiences throughout the hurricane’s impacts. For example, people who have wells cannot get water when their power is out, and living in heavily wooded areas can make transportation impossible for long periods of time. However, the social ties in the impacted areas may have mitigated some of these negative impacts, with friends, family, and neighbors willing to help each other by providing shelter, transportation, and resources. For example, one interviewee who lived in a trailer that had to be evacuated said: “I’m very grateful [for] my fishing buddy and his family. They let me stay with him because we were stuck there for… I don’t know how many days, almost a week, I think before we could get out.”
Finally, the unequal access to governmental and organizational assistance underscores the need to scrutinize the strategies used by hurricane emergency response teams in determining where and how to distribute resources. Participants who had transportation or food insecurity also noted that they lacked access to resources; whereas interviewees who did not need food assistance said that food was available within walking distance. Namely, in cases when help was most needed, interviewees lacked knowledge of where to find help, as expressed by one interviewee: “I think there might have been nobody came our way. You know what I mean? I didn’t know even where to where to look, honestly.” By contrast, another interviewee who had generators and lived in a stable brick home with plenty of food supply said: “Yeah, FEMA was in the area... The Red Cross was here. There was a lot of church support… There was food trucks. FEMA sent in food trucks, in fact, at the front of our road. Yeah. We’d have a different food truck every day and they provided free meals.”
Conclusions
Implications for Policy and Practice
Overall, respondents’ evacuation decision-making process during Hurricane Idalia largely aligned with findings from previous protective action studies. However, in contrast to previous hurricane studies which found evacuation decision-making predominantly driven by risk-perceptions, this study found that prior experience had the most significant influence on evacuation decisions. This suggests that respondents faced high levels of perceived uncertainty or lacked sufficient information about Hurricane Idalia. Given that the study areas were less frequently impacted by hurricanes, there is a clear need for improved hazard education and enhanced communication channels to share specific, localized hurricane-related information.
While resource security did not directly determine whether individuals evacuated, it played a key role in shaping evacuation behavior through two distinct pathways. First, as Hurricane Idalia approached, concerns about property damage and potential disruptions to life-sustaining resources and services increased significantly. Although these concerns may not prevent evacuation, they can lead to longer preparation times and delayed departures. Second, the amplification effect of medical service needs on the connection between risk perceptions and evacuation decisions highlights the importance of resource security for vulnerable groups during evacuation.
Overall, these findings highlight the need for enhanced access to critical resources, as well as improved information-sharing mechanisms, to better support rural residents in making timely and informed evacuation decisions. Notably, the interview results, which revealed that unequal access to assistance in the areas that need it most, underscore the need for more effective and equitable resource distribution in hurricane relief and recovery efforts.
Limitations
Results from this study are limited by the survey sample, which is not representative of the population in the counties that the study focused on. Despite our best efforts, many organizations that we reached out to were reluctant and eventually declined to help with survey recruitment efforts. Notably, we were unsuccessful in getting help from local transportation providers to engage their customers as study participants, which made us unavailable to recruit the number of transportation-disadvantaged individuals intended.
Future Research Directions
Future efforts should strive to build trust and develop partnerships between universities and organizations in rural areas for successful research collaborations. These partnerships will be critical in ensuring the participation and representation of at-risk populations in the research process, resulting in deeper understanding and more robust findings on the unique needs and barriers faced by rural communities during hurricanes. Additionally, long-term engagement between academic institutions and rural organizations can foster opportunities for co-developing disaster response, mitigation, and recovery strategies that are culturally sensitive and tailored to the local needs, bridging the gap between research and actionable policy recommendations.
References
-
Brennan Ramirez, L. K., Baker, E. A., & Metzler, M. (2008). Promoting health equity; A resource to help communities address social determinants of health. Centers for Disease Control and Prevention. https://stacks.cdc.gov/view/cdc/11130/cdc_11130_DS1.pdf ↩
-
World Health Organization. (2008). Social determinants of health (No. SEA-HE-190). https://www.who.int/publications/i/item/sea-he-190 ↩
-
Wolfe, M. K., McDonald, N. C., & Holmes, G. M. (2020). Transportation barriers to health care in the United States: Findings from the National Health Interview Survey, 1997-2017. American Journal of Public Health, 110(6), 815-822. ↩
-
Rachele, J. N., Learnihan, V., Badland, H. M., Mavoa, S., Turrell, G., & Giles-Corti, B. (2017). Neighbourhood socioeconomic and transport disadvantage: The potential to reduce social inequities in health through transport. Journal of Transport & Health, 7, 256-263. ↩
-
Treuhaft, S., & Karpyn, A. (2010). The grocery gap: Who has access to healthy food and why it matters. PolicyLink. https://www.policylink.org/resources-tools/the-grocery-gap-who-has-access-to-healthy-food-and-why-it-matters ↩
-
Golitaleb, M., Mazaheri, E., Bonyadi, M., & Sahebi, A. (2022). Prevalence of post-traumatic stress disorder after flood: a systematic review and meta-analysis. Frontiers in Psychiatry, 13, Article 890671. ↩
-
Wolshon, B., Urbina, E., Wilmot, C., & Levitan, M. (2005). Review of policies and practices for hurricane evacuation. I: Transportation planning, preparedness, and response. Natural Hazards Review, 6(3), 129-142. ↩
-
Yumagulova, L., Phibbs, S., Kenney, C. M., Yellow Old Woman-Munro, D., Christianson, A. C., McGee, T. K., & Whitehair, R. (2021). The role of disaster volunteering in Indigenous communities. Environmental Hazards, 20(1), 45-62. ↩
-
Rogers, R. W. (1975). A protection motivation theory of fear appeals and attitude change. The Journal of Psychology, 91(1), 93-114. ↩
-
Lindell, M. K., & Perry, R.W. (2003). Communicating environmental risk in multiethnic communities. Sage. ↩
-
Lindell, M. K., & Perry, R. W. (2012). The protective action decision model: Theoretical modifications and additional evidence. Risk Analysis: An International Journal, 32(4), 616-632. ↩
-
Griffin, R. J., Dunwoody, S., & Neuwirth, K. (1999). Proposed model of the relationship of risk information seeking and processing to the development of preventive behaviors. Environmental Research, 80(2), S230-S245. ↩
-
Rosenheim, N. P., Watson, M., Casellas Connors, J., Safayet, M., & Peacock, W. G. (2024). Food access after disasters: A multidimensional view of restoration after Hurricane Harvey. Journal of the American Planning Association, 1-19. ↩
-
U.S. Census Bureau. (2023, September 5). American Community Survey: 5-Year Estimates: Comparison Profiles 5-Year (Vintage 2022) [Census Data API]. http://api.census.gov/data/2022/acs/acs5 ↩
-
Levenson, E. (2023, August 31). In Cedar Key, Hurricane Idalia turned a “haven for artists” into a flooded wreck. CNN. https://www.cnn.com/2023/08/31/us/cedar-key-hurricane-idalia/index.html ↩
-
Lyons, D. (2023, September 5). Nonprofits rush to aid Idalia victims amid inflationary pressures, food insecurity. South Florida Sun Sentinel. https://www.sun-sentinel.com/2023/09/05/nonprofits-rush-to-aid-idalia-victims-amid-inflationary-pressures-food-insecurity/ ↩
-
Thomas, M. (2023, September 20). "There's only certain stuff I can get": Valdosta neighbors cope with hunger after hurricane. WTXL Tallahassee. https://www.wtxl.com/news/local-news/valdosta/theres-only-certain-stuff-i-can-get-valdosta-neighbors-cope-with-hunger-after-hurricane-see-who-is-helping ↩
-
Zhao, X., & Huang, S. (2023-2024). RAPID/Collaborative Research: Households' Immediate Protective Actions and Trade-Off Processes Between Property Security and Life Safety in Response to 2022 Hurricane Ian (2303578) [Grant]. National Science Foundation. https://www.nsf.gov/awardsearch/showAward?AWD_ID=2303578&HistoricalAwards=false ↩
-
Murphy, A. K., Gould-Werth, A., & Griffin, J. (2021). Validating the sixteen-item Transportation Security Index in a nationally representative sample: A confirmatory factor analysis. Survey Practice, 14. ↩
-
Lindell, M. K. (2018). Communicating imminent risk. In H. Rodríguez, W. Donner, & J. E. Trainor (Eds.), Handbook of Disaster Research (2nd ed., pp. 449-477). Springer, Cham. https://link.springer.com/chapter/10.1007/978-3-319-63254-4_22 ↩
-
Nowell, L. S., Norris, J. M., White, D. E., & Moules, N. J. (2017). Thematic analysis: Striving to meet the trustworthiness criteria. International Journal of Qualitative Methods, 16(1), 1609406917733847. ↩
-
Northcutt, N., & McCoy, D. (2004). Interactive qualitative analysis: A systems method for qualitative research. SAGE publications. ↩
-
Saldana, J. (2014). Thinking qualitatively: Methods of mind. SAGE publications. ↩
-
Murphy, A. K., Gould-Werth, A., & Griffin, J. (2024). Using a split-ballot design to validate an abbreviated categorical measurement scale: An illustration using the Transportation Security Index. Survey Practice, 17. ↩
-
Blumberg, S. J., Bialostosky, K., Hamilton, W. L., & Briefel, R. R. (1999). The effectiveness of a short form of the Household Food Security Scale. American Journal of Public Health, 89(8), 1231-1234. ↩
-
Huang, S. K., Lindell, M. K., & Prater, C. S. (2016). Who leaves and who stays? A review and statistical meta-analysis of hurricane evacuation studies. Environment and Behavior, 48(8), 991-1029. ↩
-
Huang, S. K., Lindell, M. K., Prater, C. S., Wu, H. C., & Siebeneck, L. K. (2012). Household evacuation decision making in response to Hurricane Ike. Natural Hazards Review, 13(4), 283-296. ↩
Yan, X., Garces, S., Huang, S. K., Sowell, K., Campbell, C., Jiang, S., Duarte, D., & Zhao, X. (2024). Transportation as a Social Determinant of Health During Hurricane Idalia. (Natural Hazards Center Health and Extreme Weather Report Series, Report 1). Natural Hazards Center, University of Colorado Boulder. https://hazards.colorado.edu/health-and-extreme-weather-research/transportation-as-a-social-determinant-of-health-during-hurricane-idalia
Acknowledgments

