Sheltering Behavior During the December 2021 Tornado in Mayfield, Kentucky
Publication Date: 2023
Executive Summary
Overview
This community-engaged study combined methods from the social sciences and engineering to understand how residents of Mayfield, Kentucky, received, interpreted, and responded to tornado warning systems during the December 2021 tornado, focusing on whether and how people sought shelter. Researchers sought to understand how residents made use of current public sheltering options and how local shelter systems could be improved. Based on dialogue with emergency management officials, and informed by the social science task of this study, engineering researchers developed a statistical tool for optimizing the selection of sites for proposed storm shelters in Mayfield.
Research Questions
We asked three main research questions:
- How did people receive, interpret and respond to warnings, including in their decisions about sheltering?
- What social and/or physical barriers to shelter access existed?
- How can modeling tools optimize decision-making about the siting of shelters?
Research Design
The research had three tasks. In the first task, social scientists conducted a survey of local residents (N=133) using the NOAA Tornado Post–Event Survey, which we modified to include additional questions on sheltering behavior, shelter accessibility, race and ethnicity, and interest in follow-up interviews. Please contact the main author of the report if you would like access to the de-identified survey data. Social scientists also conducted interviews with local community leaders and emergency management officials as well as follow-up focus groups and interviews with survey respondents. In the second task, engineering researchers used input from the social science task and local emergency management officials to develop a statistical tool to inform siting for proposed public shelters. The third task, focused on community engagement, consisted of ongoing collaboration with the county-level emergency manager as well as a community meeting to report and discuss initial results of the study.
Findings
In the first task, the survey found that most residents remained in their homes, while some went to others’ homes or churches. No one reported seeking a public shelter, and interviews with local officials later revealed that no public storm shelters had existed at the time. Focus groups and follow-up interviews revealed differences in attitudes toward sheltering in public shelters. According to our preliminary analysis, these differences vary along racial and ethnic lines, with Latinx/Hispanic residents expressing strong interest in having public shelters, White/non-Hispanic residents feeling ambivalent and skeptical about the safety of such shelters, and Black residents expressing concern about fairness and accessibility in the context of local racial divisions. The third task revealed that determining the sites for new, federally funded storm shelters was a priority. Focusing on this question, the second task developed a flexible tool for optimizing site selection and used this tool to make recommendations to the emergency manager.
Practical Implications
Preliminary findings suggest that there is a need for integrated community-engaged planning of sheltering systems in Graves County. Given the context of racial stratification, it will be crucial to improve communication and build trust with community members as part of the planning process. In particular, we recommend frequent and meaningful outreach to lower-income and racially marginalized groups, whose homes were disproportionately impacted by the December 2021 tornado and who currently bear a disproportionate burden during the recovery process. The county’s federal grant to construct six shelters offers an opportunity to enhance community resilience, but transparency and community engagement in planning and design are essential to developing a system that community members will trust and use.
Regarding shelter siting, the study led to the development of a tornado-specific location selection model that can be used by decision makers in determining the locations of shelters while minimizing the total travel time of all demand points. In this setting, population is used as a weight factor (i.e., higher population means higher weight for a demand point). The location selection model utilized here can easily be applied to different settings (e.g., different geographies) and be adapted to various situations (e.g., cost considerations, demand distributions, and distance constraints). Selected shelter site locations could change according to the demographic inputs of the developed model. For example, as the number of elderly population (demand) changes in the studied area, the results of the model would change in line with the geographic spatial distribution of the respective population segment. Therefore, the decision makers should adjust the model inputs as needed when focused on a specific population group and their priorities, which would lead to different model results accordingly.
Introduction
More than one thousand tornadoes are reported in the United States each year, causing an average of 80 deaths and more than 1,500 injuries (National Weather Service, n.d.[^National]). Although tornadoes have been studied less than hurricanes, they are one of the most hazardous adverse outcomes of convective weather (Karabuk & Manzour, 20191). In addition to the high number of fatalities and injuries they can cause, they also often result in significant economic losses (Changnon, 20092).
On December 10-11, 2021, a large, multi-tornado storm system formed across portions of the U.S. South and Midwest. An EF-4 tornado developed as part of this system and moved across Western Kentucky starting the evening of Friday, December 10 (National Weather Service, 20213). As depicted in Figure 1, the tornado moved northeast from Fulton County, the westernmost county in the state, and then tore through the largely rural Graves County. The most catastrophic damage occurred in Mayfield, the Graves County seat and a town of approximately 10,000 residents. The tornado ripped directly through the downtown area, entirely destroying the historical downtown, including local government buildings, large churches, a candle factory, and many historic buildings operating as low-income rental properties. In Graves County alone, 24 people lost their lives and more than 200 people were injured. Moreover, 1,889 single-family residences, 183 commercial properties, and 103 other structures were either damaged or destroyed. While the community embarks on the long road to recovery, pre-existing disparities are further exacerbated particularly for low-income renters and racialized minorities who struggle to access post-disaster housing, resources, and information (Niemeyer, 20224).
Figure 1. Long Track of Category 4 Tornado through Western Kentucky on December 10-11, 2021
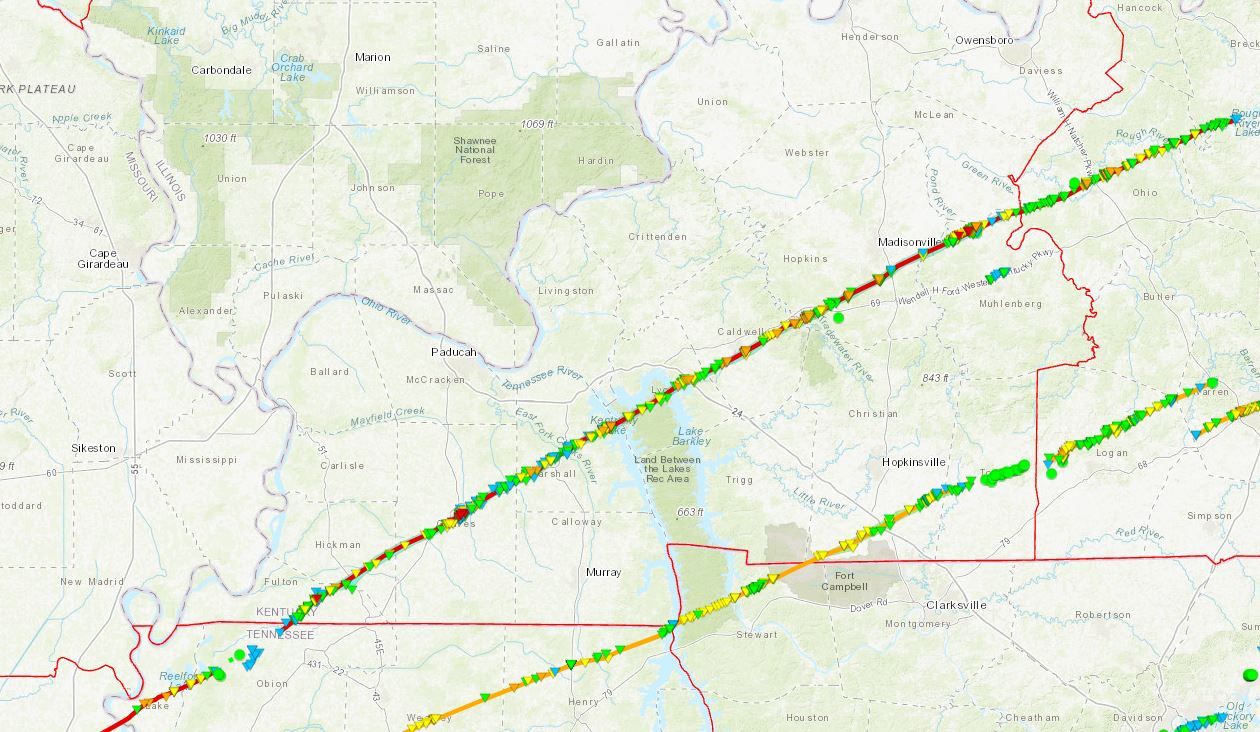
This community-engaged, interdisciplinary study sought to understand how residents of Mayfield received, interpreted, and responded to tornado warning alerts during the December 2021 tornado, focusing on whether and how people sought shelter. In collaboration with local community leaders and emergency management officials, we analyzed how residents used public shelters during the storm. We also report the implications of our findings and develop recommendations for how these local systems could be improved.
Literature Review
Tornado Warnings and Sheltering Decisions
This study contributes to scholarship about the ways that individuals receive, interpret, and respond to National Weather Service communications and warnings, focusing on tornado sheltering decisions. There is a need for systematic research on tornado warnings that examines and integrates these concerns (Ripberger et al., 20195). Previous studies on tornado warning systems have identified problems in warning reception (Hammer & Schmidlin, 20026; Biddle, 20077; Sherman-Morris, 20098; Godfrey et al., 20119; Paul & Stimers, 201210; Jauernic & Van Den Broeke, 201611), forecast interpretation (Balluz et al., 200012; Powell & O’Hair, 200813; Schultz et al., 201014; Mason & Senkbeil, 201515), and response (Schmidlin et al., 200916; Klockow, 201317; Silver & Andrey, 201418; Casteel, 201819; Miran et al., 201820). Building on this previous research, we examine the relationship between National Weather Service warnings and sheltering decisions and explore how to optimize siting sheltering systems.
Several studies have focused on disaster sheltering patterns with a specific focus on tornadoes (Chiu et al., 201321; Gelino & Reed, 202022; Merrell et al., 200523; Schmidlin et al., 2009; Senkbeil et al., 201424). Providing safe and accessible sheltering opportunities is a complex task that is shaped both by the characteristics of the particular extreme event and the affected population (Ash, 201725; Chaney et al., 201526; Ellis et al., 201827; Klockow et al., 201428; Senkbeil et al., 2014). Over the years, research on sheltering during extreme events has continued to evolve in concert with developments in storm prediction capacities and emergency communication strategies (Casteel, 2018; McPeak & Ertas, 201229; Stokes & Senkbeil, 201730). Additionally, improved scenario planning has provided emergency officials with enhanced techniques for managing the uncertainties associated with extreme weather events and the distinct needs of victims (Birkmann et al., 201531; Karabuk & Manzour, 2019; Murray-Tuite et al., 201232).
Most previous tornado warning research has focused on the U.S. Southwest and Plains. There is a gap in understanding the dynamics of sheltering in the Southeast, which has experienced particularly deadly storms (Ellis et al., 2018; Fricker & Elsner, 202033). Moreover, recent studies indicate that climate change may be increasing the intensity of tornado events, thus increasing the need to understand and invest in disaster preparedness throughout the region (Elsner et al., 201934).
Modeling Evacuation and Sheltering
Providing safe and accessible evacuations and shelter in the context of mass emergencies is a complex task that requires logistical planning. The need to research and improve emergency logistics systems has received significant attention recently, especially in the aftermath of several major hurricanes where problems with evacuation cost people their lives and put others in harm’s way (Huang et al., 201635; Lindell et al., 201936; Litman, 200637; Thompson et al., 201738; Wolshon, 200139).
Spatial optimization models utilizing geographical information systems (GIS) have been widely used to improve emergency logistics procedures and planning, including emergency shelter planning (Marcelin et al., 201640). The p-median models are one of the most common modeling tools and have been applied in large-scale scenarios with some alterations (Farhan & Murray, 200841; Horner & Mascarenhas, 200742; Kocatepe et al., 201843; Kwan et al., 200344). The p-median models are capable of selecting optimal shelter locations (Alisan et al., 201745; Alisan et al., 201846; Arentze et al., 201047; Daskin et al., 199748; Murray & Gottsegen, 199749) by mathematically searching for the minimum total cost to assign populations available shelters in the affected region (Alisan et al., 2017). The p in the name of the p-median model stands for the number of locations to be selected among many (p or more) alternatives. This model aims to select p facilities among the alternatives that optimize an objective function (e.g., minimizing travel time), and, according to a comprehensive literature review (i.e., Alisan et al., 2017), has not been applied in a tornado emergency management context.
In the context of spatial optimization, scenarios can be created deterministically or probabilistically to aid emergency officials in making decisions about evacuation and sheltering. Deterministic scenario creation is usually less complex than the probabilistic counterpart and consists of predetermined instances and variables. Probabilistic scenarios creation has the potential to incorporate uncertainties about the hurricanes (including its landfall location and strength), while also incorporating variable uncertainty about the needs of the affected population. However, there are limited models that have studied this with a focus on tornadoes. The underlying dynamics of evacuation and sheltering are even more complicated when they involve tornadoes and must be incorporated in the scenario analysis.
How Social Vulnerability Shapes Shelter Access and Use
Social scientists have also developed critical analyses of disasters, stressing that these events need to be understood as socially constructed rather than simply as natural (Oliver-Smith, 199650; Smith, 200651). Extreme storm events should therefore be examined as the combination of destructive geophysical forces with the socially produced condition of vulnerability within a population (Cutter et al., 200852; Johnson & Olshansky, 201753; Pelling, 200354; Wisner et al., 201255). Social scientists have particularly emphasized the need to address disasters through the lens of social equity, carefully examining how disaster vulnerability intersects with chronic conditions of social inequality (Holmes et al., 202156; Pyles, 201757; Rogge, 200458; Soliman & Rogge, 200259; Zakour & Harrell, 200460). Applying these insights to the study of sheltering, researchers need to examine how the organization of built infrastructure and social relations produces uneven patterns of emergency shelter access and use.
Combining these insights with quantitative assessments of emergency management, interdisciplinary research can help to identify the geophysical and sociopolitical conditions relevant to understanding the vulnerabilities that produce a given disaster. This can inform interventions to ameliorate those conditions and increase resilience in future extreme weather events.
Research Questions
This study sought to understand and model social and physical factors that shaped sheltering behavior during the 2021 tornado in Mayfield, Kentucky, and its environs. We asked:
How did people receive, interpret, and respond to warnings, including in their decisions about sheltering? What social (e.g., community boundaries) and physical (e.g., proximity) criteria were most relevant to their sheltering decisions? How did people perceive the availability and safety of shelter options? At what social scale (e.g., individually, as families, as neighbors) did people make decisions about sheltering?
What social and/or physical barriers to shelter access existed? How did proximity, transportation infrastructure, and communications facilitate and/or limit access to shelters? How did community affiliation (e.g., racial, familial, religious) and associated settlement clustering facilitate and/or limit access?
How can modeling tools optimize decision-making about the siting of shelters? How can siting best account for the social landscape (e.g., decision-making processes, community boundaries, settlement clusters)? How can siting best account for the physical landscape (e.g., transportation infrastructure, siting of emergency services)?
Research Design
This study involved three tasks. In Task 1, we used social science methods—including surveys and ethnographic fieldwork—to study how individuals receive, interpret, and respond to tornado warnings, including their sheltering behavior. In Task 2, we used engineering methods to examine how physical factors affect optimal shelter size and location. In Task 3, our interdisciplinary team of engineers and social scientists worked with local emergency management officials to produce an integrated analysis of social and physical factors to optimize shelter systems in Graves County. After explaining the rationale for our study site selection, we explain each of these tasks in more detail below.
Study Site Description
We decided to conduct this study in Mayfield, Kentucky, because of its similarities with a site where we previously studied tornado disasters—Beauregard, Alabama, which was struck by an extremely devastating tornado in 2019 (Holmes et al., 2021). The Beauregard study used ethnographic methods to understand the tornado’s unusually high fatality rates, with the aim of generating hypotheses that explain why tornado fatalities are higher in the Southeast United States than other parts of the country. Beauregard and Mayfield share two important features: First, they are both racially diverse communities. Second, they both experienced an unusually high number of fatalities relative to population size during an extreme tornado event. These similarities allowed us to evaluate whether racial dynamics suggested by our fieldwork in Beauregard were present in the Mayfield case as well.
Mayfield and Beauregard differ, however, in terms of their type of local government and degree of rurality (including population size and density of development). Mayfield, as stated above, is a small town with a population of approximately 10,000 residents within a small footprint of 7 square miles. Beauregard is a rural unincorporated community (i.e., not governed by a local municipal corporation) with a population of 17,485 spread across 193 square miles. This variation enabled us to explore how social differences in accessing warning and sheltering systems may vary with degrees of rurality.
Task 1: Social Assessment of Warning Reception and Interpretation and Sheltering Behavior
Task 1 was conducted in two phases. Phase 1 was a four-day field visit to Mayfield—from March 11 to March 14, 2022— during which we established contact with local emergency management officials and community leaders; visited sites along the tornado path and surrounding areas to understand the physical characteristics of the built environment, housing stock, and community assets; and conducted a survey of residents in a tornado-affected neighborhood. We returned to Mayfield from April 20 to 26, 2022, for Phase 2 to complete participant observation, in-depth interviews, and focus groups. We also took photographs to document the physical characteristics of the area and sheltering locations. Each phase is summarized in Table 1 below.
Table 1. Task 1 Research Phases and Activities
| Phase | Dates | Activity |
| 1 | March 11-14, 2022 | Preliminary meetings with officials and leaders, Site visits to impacted areas, Administration of household surveys |
| 2 | April 20-26, 2022 | Site visits to impacted areas, Interviews with residents, Focus groups with residents |
Phase 1: Post-Tornado Event Survey
During Phase 1 we conducted the National Oceanic and Atmospheric Administration (NOAA; n.d.61) Tornado Post–Event Survey. We used the survey to gain a broad overview of the range and prevalence of tornado response behavior. Researchers canvassed door-to-door using the RAPID Mobile Reconnaissance Application, or RApp, a field data collection tool from the NHERI RAPID Facility.
Our survey included all the measures from the NOAA questionnaire plus additional questions we had added about race/ethnicity, kind of shelter used, perceived shelter access, and respondent willingness to do a follow-up interview. If respondents agreed to an interview, we took their contact information separately from the survey data. To effectively survey and interview Spanish speakers, our team included one faculty member with basic Spanish and one student fieldworker fluent in Spanish.
Due to time limitations and the topical focus of the study, we chose a sampling approach that ensured a racially diverse sample rather than statistical representativeness. We purposively selected one census block group in Mayfield that had high degree of racial diversity: Of the approximately 1,200 residents in that census block group, approximately one-half identified their race or ethnicity as White non-Hispanic, one-third as Hispanic, and 10% as Black, according to the 2020 Census.
Our team distributed the survey door-to-door to every house on the block—approximately 500 households—during daylight hours on Saturday, March 12, 2022, and Sunday, March 13, 2022, three months after the tornado. We collected 133 completed surveys (response rate of approximately 27%). We spoke to any adult representative in the household who agreed to take the survey individually or in pairs. Most surveys were completed on an iPad by the administrators. Only a small number of respondents opted to complete the survey on the iPad themselves. Of the respondents, 51% self-identified as male and 48% as female, with one respondent not answering the question. Racially, 69% of the respondents self-identified as White, 21% as Hispanic/Latino, five percent as Black, and five percent as Other.
Phase 2: Field Observations, Interviews, and Focus Groups
During Phase 2, we familiarized ourselves with Mayfield in several ways: driving and walking around different neighborhoods and public buildings to observe structural damage caused by the tornado, sharing meals with residents at local restaurants or their homes, hosting a meal at our AirBnB lodging, spending time at the Emergency Operations Center and the Mayor’s office, and attending church services. Our aim with these activities was to get to know a range of local residents and better understand everyday life in Mayfield. While these activities were initiated in diverse and organic ways (e.g., one researcher had a relative in Mayfield, a friendly neighbor invited us to join an outdoor barbeque, and church services were publicly accessible), they were valuable to eventually recruiting interviewees from a wide range of backgrounds. We also interviewed 11 community leaders, including emergency management officials, local government representatives, and church leaders. Initially, we used internet searches of local government websites and news media to individuals whom we wanted to target for an interview. Later, we also used recommendations from interviewees to identify other possible participants and, at the invitation of the mayor, made an announcement at a local city council meeting. Interviews were audio recorded and lasted an average of approximately one hour.
Lastly, we conducted two focus groups and eight in-depth interviews with residents affected by the tornado. We used the contact list from our Phase 1 survey to recruit residents. We chose to organize the focus groups based on race/ethnicity because our conversations with residents during the Phase 1 survey suggested that White and Latinx/Hispanic residents had disparate disaster outcomes. We conducted one focus group with all Hispanic residents (N = 7 women) and one with all non-Hispanic White residents (N = 3 men, 2 women). We attempted to organize a focus group with Black residents, but we were unable to recruit participants (in part because there were fewer Black survey respondents). Instead, we completed interviews with seven Black residents individually or in pairs. Two interviews with Black residents (one with one woman and one with a married man and woman couple) were conducted after Sunday morning service at a local church. Four interviews with Black residents were conducted at their homes (one interview with one woman, one interview with a woman and man couple, and one interview with one man and his wife, who is White). We also completed an individual interview with a Hispanic woman at her home.
Table 2. Demographic Characteristics of Residents Who Participated in Focus Groups or Interviews
| Characteristic | Women | Men | Total |
| Hispanic/Latinx | 8 | 0 | 8 |
| Black | 4 | 3 | 7 |
| White | 3 | 3 | 6 |
| Total | 15 | 6 | 21 |
Focus groups were video recorded and lasted an average of two hours. The main topics we asked residents to discuss included their actions prior to the tornado impact, how they received and interpreted warnings, their decision-making process on taking shelter, what happened during the tornado, how they have recovered, and opportunities to improve preparedness and response measures.
Task 1 Data Analysis
Data analysis for Task 1 is currently underway and the findings in this report represent preliminary analysis. Preliminary analysis consists of basic frequencies from survey results. In addition, we conducted an initial review and discussion of key findings from interview and focus group transcripts. We presented these initial findings to community members as part of Task 3,and are using community members’ responses to refine our analysis. We are also using NVivo to code for themes relevant to the research questions. For the initial round of coding, we are using codes for each sub-question. Additional codes will be developed as coding continues, with iterative process of code refining, merging, etc. as coding and discussion among researchers proceed.
Task 2: Modeling of Optimal Shelter Siting
Modeling Methodology
As discussed in the literature review, p-median models search for the minimum total cost to assign the demand to p shelters. For our study, we used a p-median model that identifies the optimal shelters—which we defined as those that minimize travel cost (travel time between population block group centroids and shelter locations). This methodology employs spatial distributions of different population segments to represent the demand patterns. Although the states maintain shelter registries, it is almost impossible to know the exact shelter demand given many factors driving evacuation decisions. Moreover, demand estimation is even more challenging for people with access and functional needs. Older adults are likely to be in that category during an emergency situation because their health conditions may easily deteriorate. A p-median model was used along with the various population segments to select which shelter(s) can be identified as tornado shelters by minimizing the travel time for each setting (i.e., spatial distribution of each population segment).
Task 2 Data Analysis
The data analysis process for Task 2 involved the following steps. First, we created alternative scenarios based on the demographic characteristics of the population (i.e., total population, population 65 years and over, population under 5 years, and non-white population). Then, we varied the number of shelter locations between one and six, depending on the alternative assumptions about how the population is dispersed. At one extreme—the most equidistant population distribution case (i.e., in which the population is clustered at a single point)—the six shelters in consideration could be located at the same location. At the other extreme—in the most scattered population distribution case—the six shelters would be located at different places.
We did not set a limit on shelter capacity in this study. As such, shelters were assumed to be capable of serving all the assigned population. However, in all evacuation cases, the demands were assumed to actualize with a proportion of the total assigned demand. Therefore, the results reflect an assumed pattern depending on the actual population distribution. The employed model returns the optimum locations that would minimize the total travel time. Thus, even if the demand assignments will not be satisfied fully, the selected locations would still respond to the demand pattern in each case by reducing the travel time for all. The overall assumptions of this task can be found in Appendix A.
Task 3: Community-Engaged Integrated Analysis and Recommendations
Early in the study, researchers established a collaborative relationship with the Graves County emergency manager, who introduced researchers to local leaders, offered space for conducting interviews and focus groups, and expressed interest in using research findings to inform shelter planning processes. Prior to the tornado, there were no designated storm shelters in Graves County. Following the tornado, the emergency manager worked with local officials to designate some public school buildings as storm shelters, but these had not been constructed for this purpose. The emergency manager successfully applied for a federal grant to construct six storm shelters, and she sought advice from the researchers on how the findings from this study could inform the site selection for these new shelters. Via Zoom meetings and email, researchers discussed relevant implications of their findings for the new shelters, while also tailoring the statistical analysis in Task 2 to incorporate local criteria and constraints for site selection.
The purpose of Task 3 was to share our results with the local community and apply our findings in ways that maximized local benefit. We used the contact list from the Task 1 survey to plan a local, in-person gathering for reporting key findings back to the community from October 6, 2022 – October 9, 2022. The community event was held at the Graves County Public Library on a Saturday, October 8, 2022. The meeting was video-recorded and also served as an opportunity to gather community perspectives on our results. Participation, however, was low; limited to the emergency manager, her family, a police officer, and a community taskforce leader. Therefore, the meeting primarily served as an opportunity to advance ongoing dialogue about local shelter planning processes.
Ethical Considerations, Researcher Positionality, Reciprocity, and Other Considerations
Tasks 1 and 3 involved human subjects research. The Florida State University Institutional Review Board determined all procedures in these tasks to be exempt on March 7, 2022. Recognizing that our participants have undergone a tragedy, we included consideration of trauma in the informed consent and data collection processes. To avoid overburdening the community, we confirmed that other Natural Hazards Center Quick Response research had not yet been conducted in this area. No compensation was given to survey respondents due to budgetary constraints. To encourage participation in focus groups by low-income participants, we provided each participant with $20. While some participants declined compensation, others said that it was greatly appreciated in the context of post-tornado financial distress.
Findings
Tornado Warning Reception, Interpretation, and Response
Our first research question concerned how people received, interpreted, and responded to warnings, including how people made decisions about sheltering. To answer these questions, we analyzed some key frequencies, focusing on results related to sheltering decisions. By and large, respondents expressed that they receive notifications of tornado watches when weather conditions in an area indicate an increased risk for severe weather that may be capable of producing a tornado (69.7%) and that they receive warnings when a tornado has been sighted or indicated by weather radar and residents are instructed to take shelter immediately (85%). Some respondents stated that they felt was doing a good job communicating the risks.
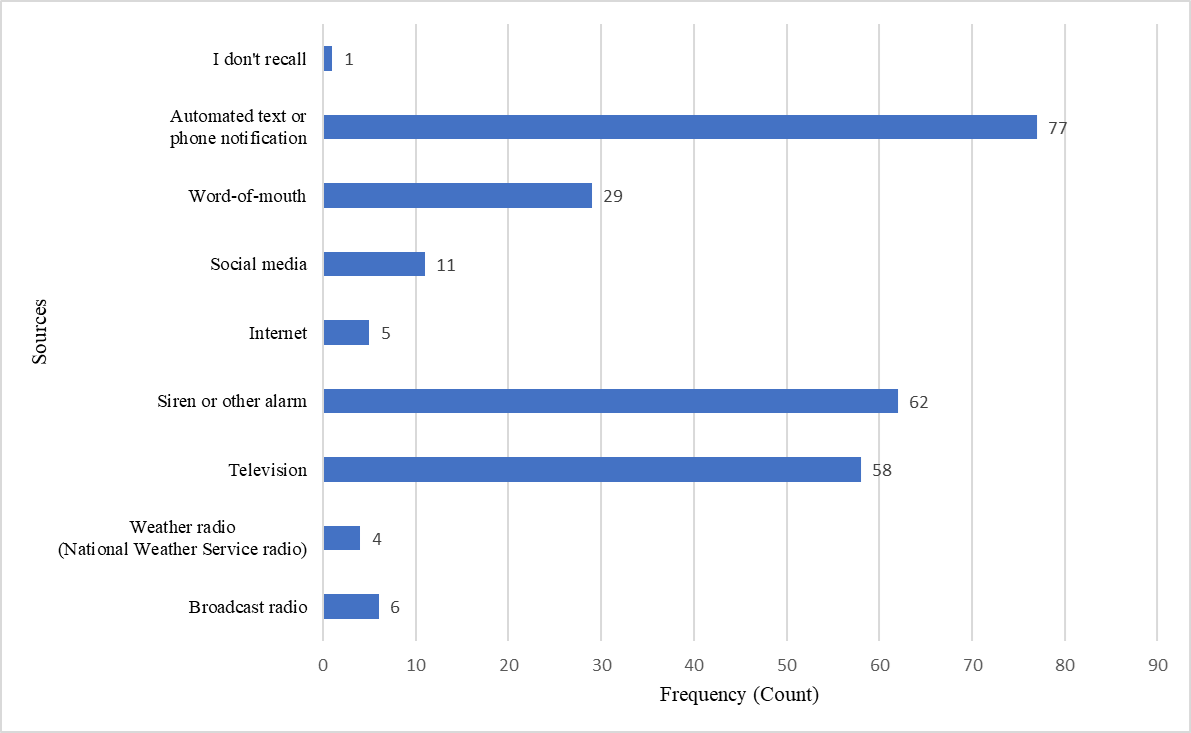
Respondents received notifications of watches and warnings in multiple ways, especially via TV, mobile phone, and siren (Figures 2 and 3). A notable exception was that Spanish speakers expressed that they did not receive any warnings in Spanish and recommended that future emergency notifications be translated into Spanish. It was later confirmed with the local emergency manager that warnings were not disseminated in Spanish, and she had been making plans to implement Spanish-language warnings in the future. Common responses to the tornado watch involved having the local TV news/weather on (N=37), checking weather app on the phone (23), and calling friends and family to warn them (N=27).
Figure 2. How Respondents Received Tornado Watch Notifications
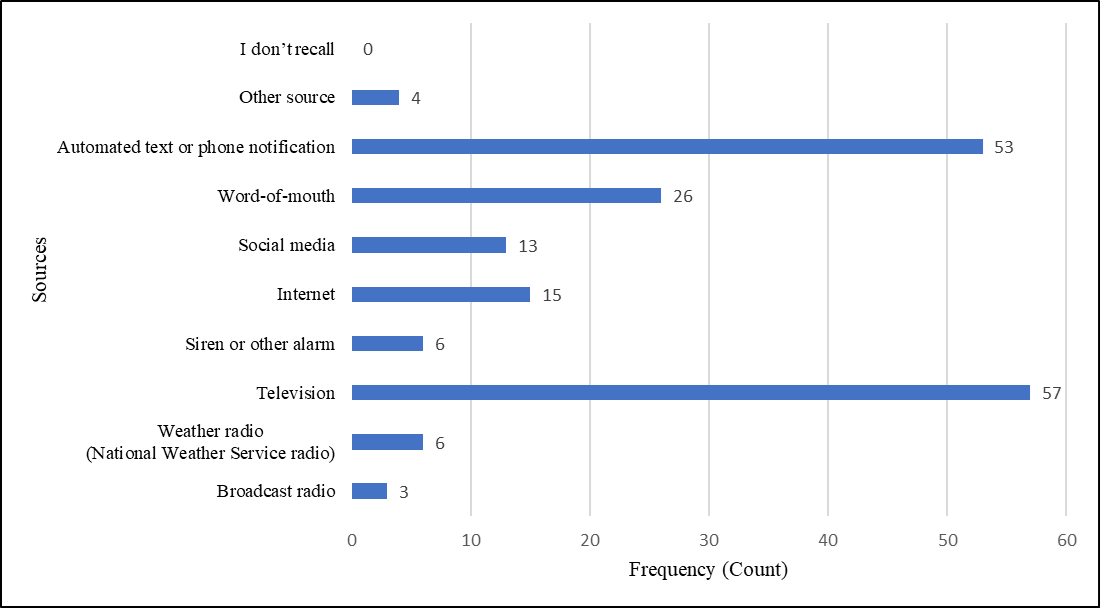
Figure 3. How Respondents Received Tornado Warning Notifications
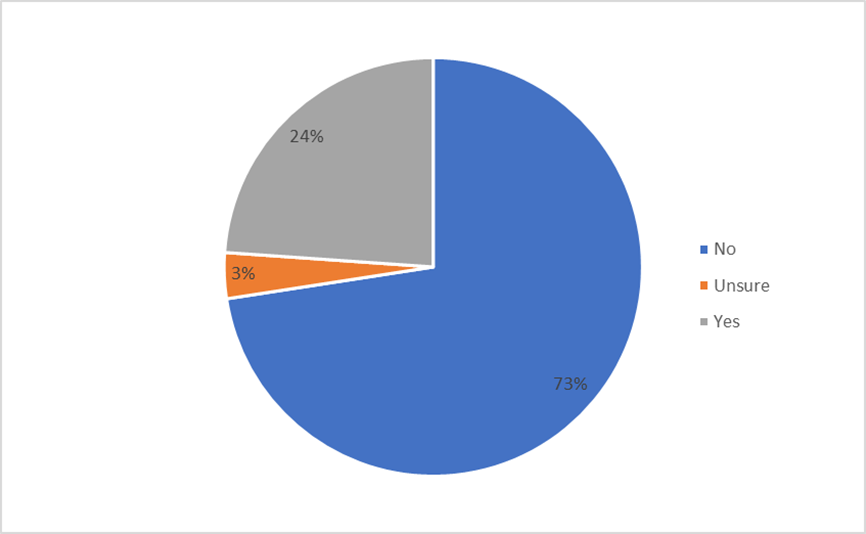
Respondents varied widely in how safe they felt upon receiving the tornado warning and whether they felt confident that they could protect themselves, with 33% feeling very confident, 29% moderately/somewhat confident and 29% not at all confident (Figure 4). Additionally, most respondents did not seek additional information or express a need for additional information about to take to stay safe (72.6%) (Figure 5).
Figure 4. Respondent Confidence in Taking Action to Protect Onself Upon Receiving a Tornado Warning
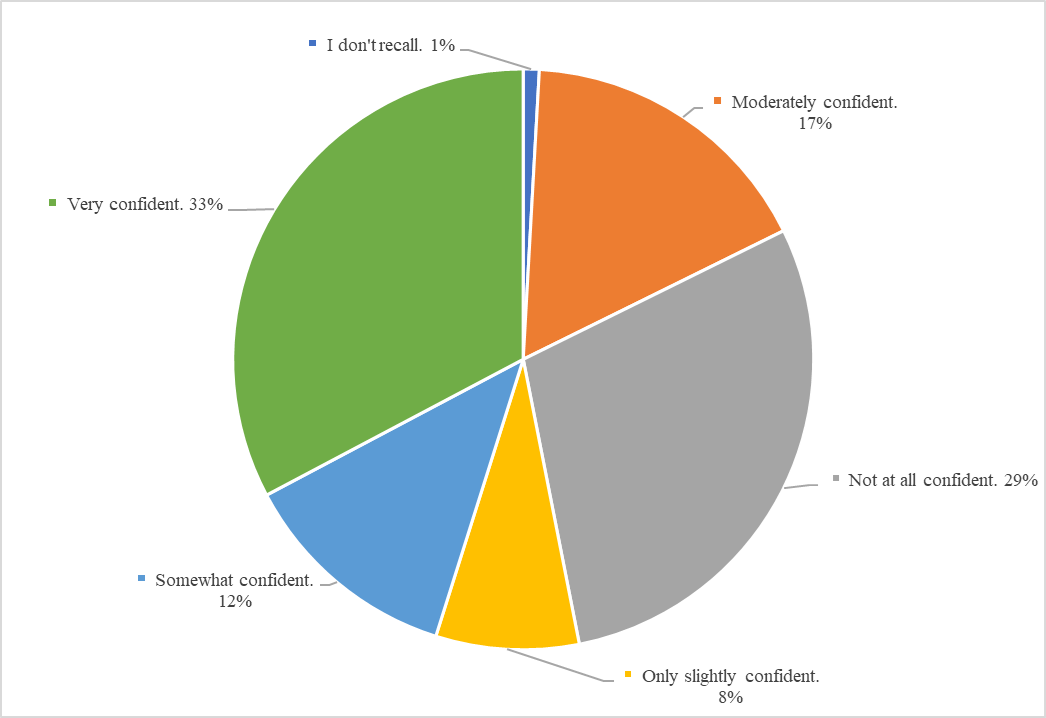
Figure 5. Respondent Need for Additional Information About Safety Actions to Take Upon Receiving a Tornado Warning
Barriers to Shelter Access
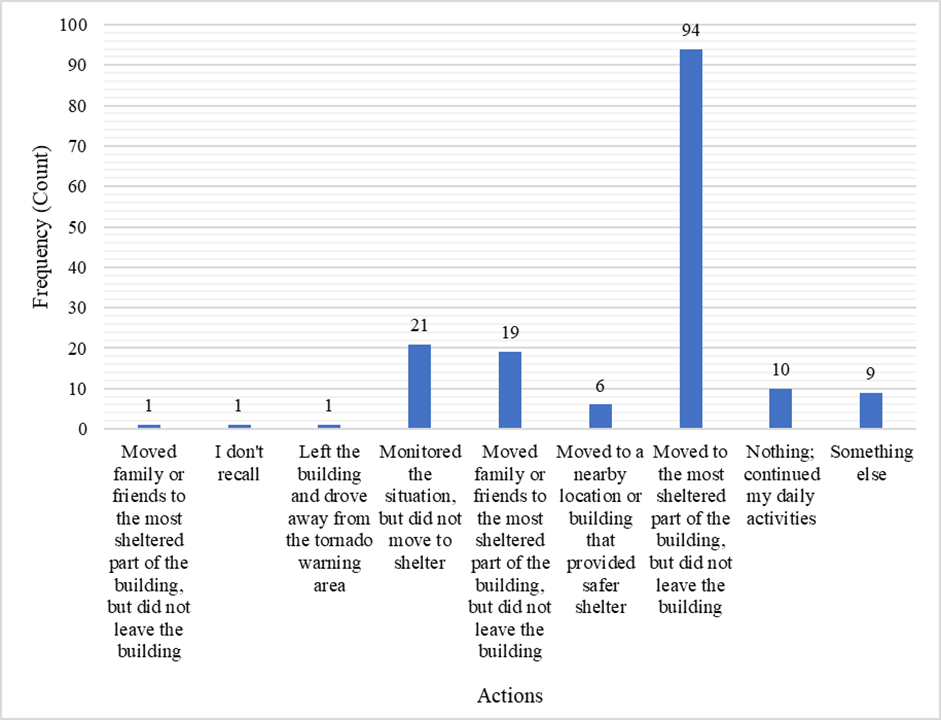
Our second research question concerned the social and/or physical barriers to shelter access that existed during the tornado event. Notably, the additional survey questions added by researchers regarding how residents used public storm shelters proved to be irrelevant because, as it turned out, there were no public shelters available in December 2021. Thus, the main answer to this question was mostly answered by the fact that all respondents had no access to any public shelter option and had to find shelter through their own personal networks and resources. In seeking shelter, most respondents stayed in their own homes, going to the parts of the house they deemed safest (N=94). Some respondents reported monitoring the situation (N=21) or moving family or friends to a sheltered part of the building but not leaving (N = 19) (Figure 6).
Figure 6. Actions Respondents Took Upon Receiving a Tornado Warning
Most respondents reported they did not have basements in their homes. Due to the lack of basements, many respondents described sheltering in hallways or bathrooms. These sheltering decisions were not part of the multiple choice options on the survey; instead, respondents reported them conversationally to the interviewers conducting the survey. Many respondents also reported in conversations with the interviewers that they followed guidance for in-home sheltering provided by emergency weather broadcasts on local TV. Their feelings of safety were mixed, with 14.3% feeling very safe, 44.4% moderately/somewhat safe, and 30.8% feeling not safe at all.
As we conducted the survey in Mayfield, we talked with residents who reported going to the homes of neighbors or friends, and, in one case, respondents went to the basement of a nearby church. Interviews with local church leaders revealed that a few churches with basement space had offered shelter during the December 2021 tornado, and several leaders discussed plans for offering shelter in future tornadoes.
During Phase 2 focus groups, we sought to understand whether residents would be likely to use shelters if they were available. Responses varied widely. Participants in the Hispanic/Latinx focus group expressed a strong desire for public sheltering options, describing how, if they were available, they would organize their families and neighbors to go there during future storms. By contrast, participants in the White, non-Hispanic group were unsure whether they would use a public shelter, with some pointing out that many of the major public buildings in town had been destroyed in the December 2021 tornado and questioning whether any building could protect someone from such powerful tornado.
Individual and small group interviews with some Black residents likewise showed mixed feelings about using public shelters, but for different reasons. For example, one woman expressed concern about using existing churches or schools for sheltering, saying she was not sure she would be let into a church or school to which her family did not belong. This fit with broader concerns expressed by Black residents about racial discrimination and the potential for differential treatment during tornadoes. For example, another long-time resident indicated that lack of representation in decision-making roles and positions of authority may negatively affect how Black communities learn about services, programs, and avenues to pursue resources. Along similar lines, some Black residents felt that considerable resources had been spent in tornado recovery, but that the Black community had been excluded from the distribution of those resources.
Shelter Siting Model Results
Our third research question concerned how modeling tools can optimize decision-making about the siting of shelters and the optimal siting and design for shelters. We answered this question by applying an engineering optimization model to the case study of Graves County, Kentucky. In this section, we present the modeling results for the p-median formulation that was used to determine the optimum locations for possible shelters for different demand settings (i.e., population distribution). Note that the results presented in this section consider siting of 6 (p=6) shelters. The models used for the demand settings are named as follows:
- Model 1 for total population
- Model 2 for the population of adults age 65 and over
- Model 3 for the population children under age 5
- Model 4 for non-white population
Model 1 Results: Total Population
The results of the Model 1 are provided in Figure 7 and Table 3. Figure 7 visualizes the optimum six locations (given a location is dedicated to the Fairgrounds, as was requested by the community). Considering that those points may or may not be feasible locations for siting a shelter, 1.5-mile buffer zones around those points are also defined. Moreover, in Table 1, the expected demand weights (i.e., population coverage) and the closest main roadways are highlighted. For example, the demand (i.e., the number of people living) at Location 73 is 3,275 people, and the closest connection is State Road 94 W whereas the demand weight of Location 781 is 4,899 people, and the closest connection is State Road 45 S.
Figure 7. Results of Model 1
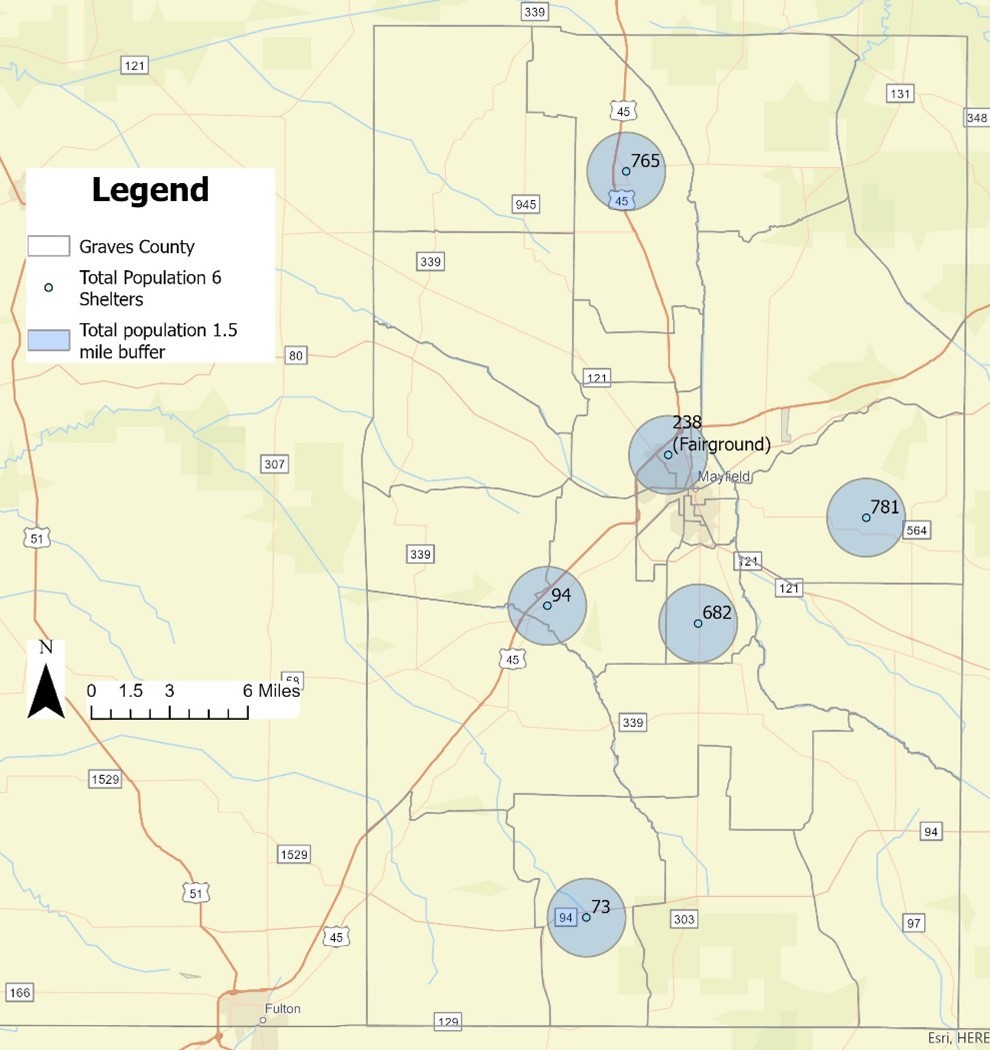
Table 3. Shelter Demand Coverage and Closeness to Roadways for Model 1
| Shelter Location Number | Total Population Coverage Estimates | Nearest Major Road |
| 238 (Fairgrounds) | 9,948 | Interstate 69 |
| 682 | 10,159 | State Road 303 |
| 765 | 6,517 | State Road 45 N |
| 94 | 4,899 | State Road 45 S |
| 73 | 3,275 | State Road 94 W |
| 781 | 2,327 | State Road 464 |
Model 2 Results: Adults Over Age 65
Findings of Model 2 are depicted in Figure 8 and Table 4. Table 4 shows the expected demand weights and the closest main roadways for this setting. Accordingly, similar to the results in Model 1, Location 682 has the highest population coverage (demand assignment) serving the elderly population in the south of the county. The other common shelter location is Location 781, serving the eastern part of the county.
Figure 8. Results of Model 2
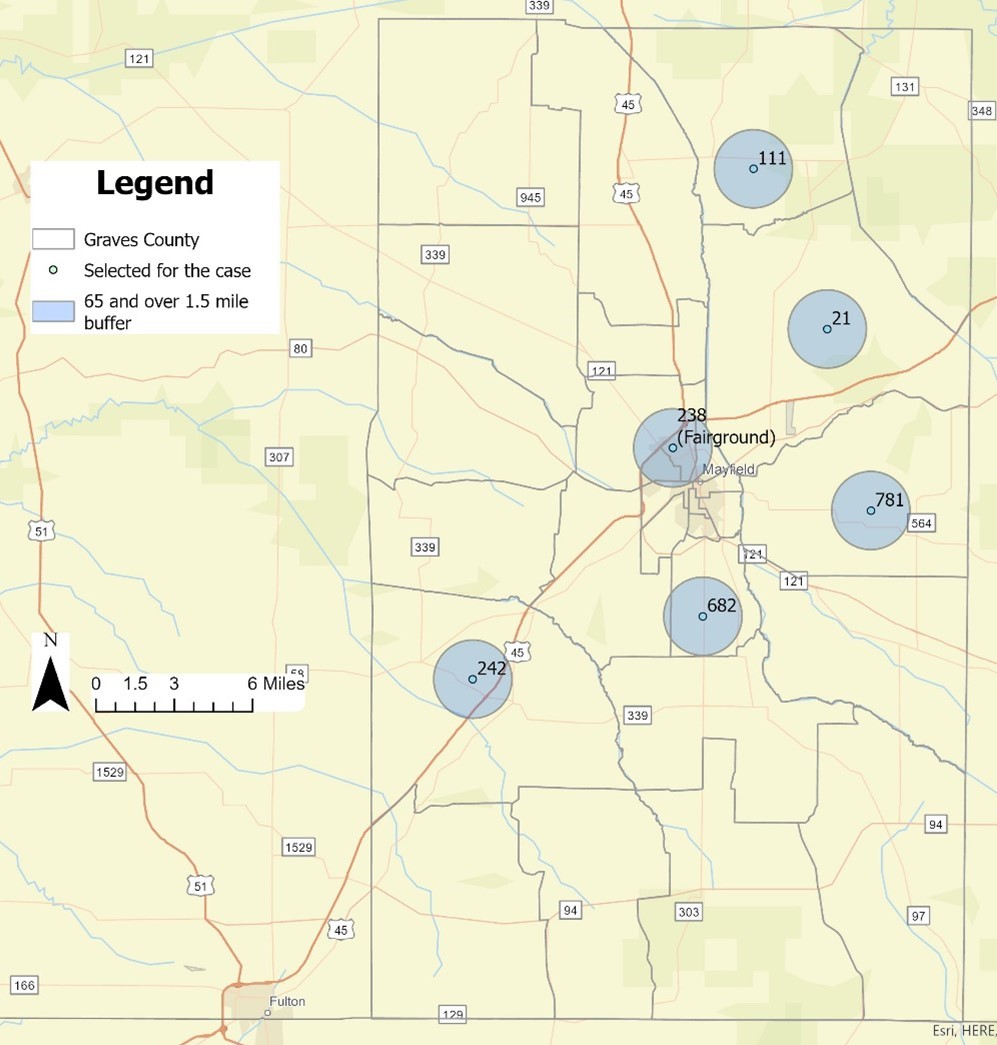
Table 4. Shelter Demand Coverage and Closeness to Roadways for Model 2
| Shelter Location Number | Adults Over Age 65 Population Coverage Estimates | Nearest Major Road |
| 238 (Fairgrounds) | 1,589 | Interstate 69 |
| 682 | 2,518 | State Road 303 |
| 111 | 946 | State Road 849 |
| 242 | 848 | State Road 339 W |
| 21 | 492 | Trace Creek Church Road (1374) |
| 781 | 455 | State Road 464 |
Model 3 Results: Children Under Age 5
The results of Model 3 are depicted in Figure 9 and Table 5. Table 5 shows the expected demand weights and the closest main roadways. According to the results, all five selected locations in Model 3 are different than in Model 1 and Model 2. This variance is due to the difference in the spatial distribution of the under 5 population. Again, the model will respond to the changes in the demographic inputs based on the population segment selected.
Figure 9. Results of Model 3
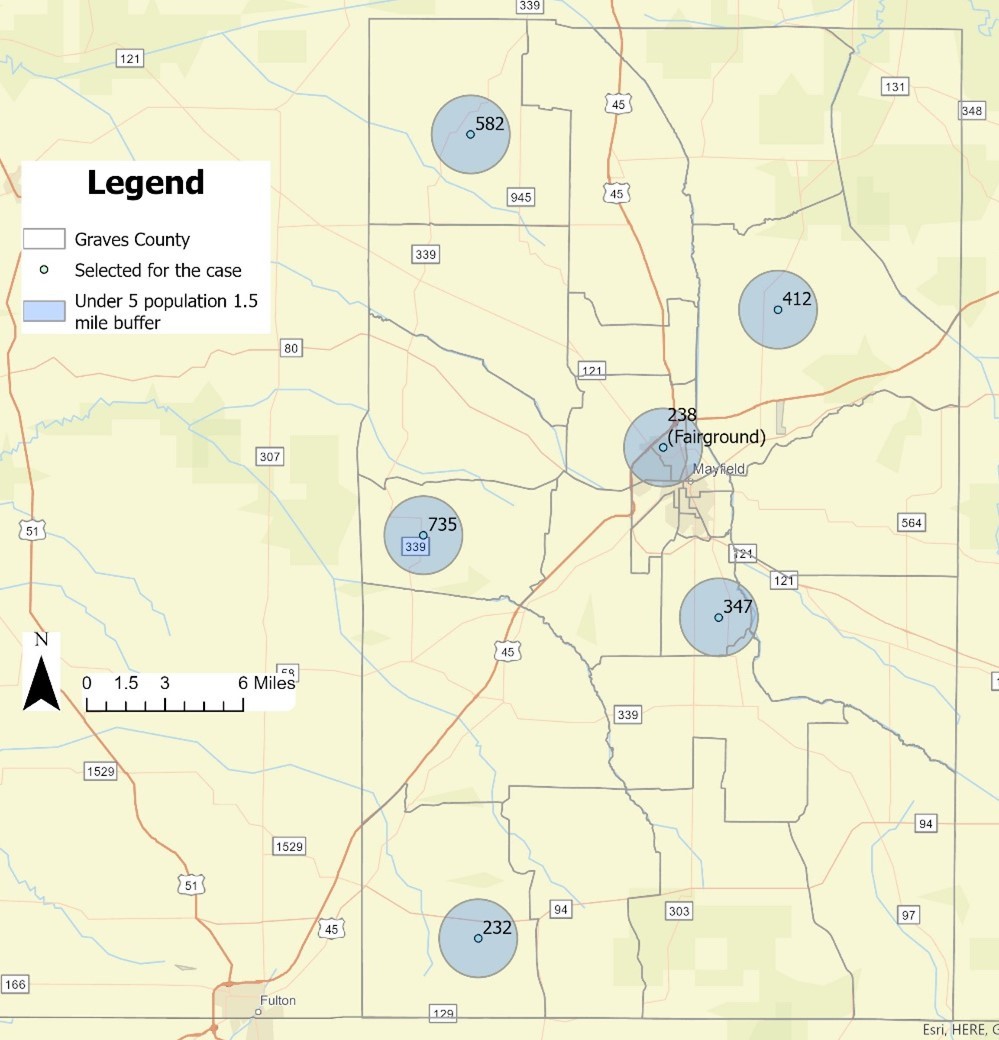
Table 5. Shelter Demand Coverage and Closeness to Roadways for Model 3
| Shelter Location Number | Children Under Age 5 Population Coverage Estimates | Nearest Major Road |
| 238 (Fairgrounds) | 656 | Interstate 69 |
| 347 | 557 | State Road 97 |
| 735 | 374 | State Road 339 S |
| 412 | 311 | State Road 131 |
| 232 | 217 | State Road 94 W |
| 582 | 142 | State Road 339 N |
Model 4 Results: Non-White Population
Finally, the results of Model 4 are depicted in Figure 10 and Table 6. Table 6 shows the expected demand weights and the closest main roadways. Model 4 results are mostly similar to those of Model 1 since the total population distribution is similar to the distribution of non-white population.
Figure 10. Results of Model 4
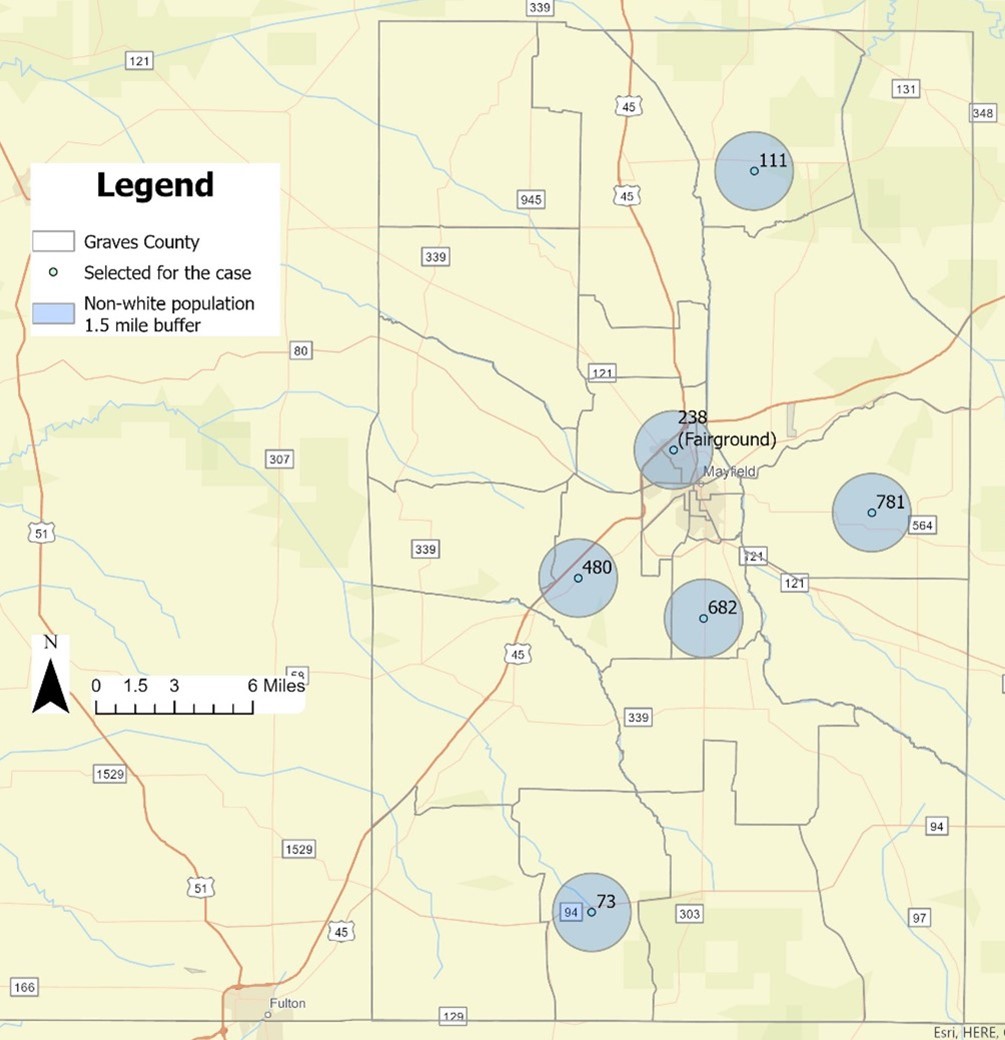
Table 6. Shelter Demand Coverage and Closeness to Roadways for Model 4
| Shelter Location Number | Non-White Population Coverage Estimates | Nearest Major Road |
| 238 (Fairgrounds) | 1,092 | Interstate 69 |
| 682 | 1,107 | State Road 303 |
| 480 | 807 | State Road 45 S |
| 111 | 544 | State Road 849 |
| 73 | 302 | State Road 94 W |
| 781 | 249 | State Road 464 |
Travel Times for Each Model
Our analysis also included results for the expected travel times to each shelter location. For each model and location number, we estimated the maximum, minimum, and average travel times from origins (i.e., home) to the nearest shelter. In this analysis, each block group is assigned to a shelter site. The minimum travel time is equal to the minimum travel time to the assigned shelter among indicated block groups. The maximum travel time is equal to the maximum travel time to the assigned shelter among all indicated block groups. The average travel time is the average of all the travel times to the assigned shelter among the indicated block groups.
Appendix B provides the full results from the model. In summary, it shows that as the number of shelter locations is increased, the travel times tend to decrease for all distributions. For example, for Model 1, if we only have one shelter location (p=1), the maximum travel time is 26.8 minutes, the minimum travel time is 3.9 minutes, and the average travel time is 12.7 minutes. If we have six locations (p=6), the maximum travel time decreases to 13.2 minutes, the minimum travel time decreases to 0.1 minutes, and the average travel time decreases to 6.4 minutes. However, note that this situation is valid when the shelter capacities are not considered. If we impose capacity restraints, each location would be limited in service potential and each block group may not be served by the closest shelter location. Nevertheless, in an actual evacuation case, the evacuation demand is likely to be the entire population since some people will prefer shelter-in-place and others will travel out of the affected area. Thus, the model results should be used as guidance for shelter planning.
Conclusions
Preliminary findings suggest that there is a need for integrated community-engaged planning of sheltering systems in Graves County. In the context of racial stratification, communication and trust building will be crucial to the successful development of this system. In particular, we recommend frequent and meaningful outreach to lower-income and racially marginalized groups, whose homes were disproportionately impacted by the December 2021 tornado and who currently bear a disproportionate burden during the recovery process. The county’s federal grant to construct six shelters offers an opportunity to enhance community resilience, but transparency and community engagement in planning and design will be crucial to developing a system that community members will trust and use.
Regarding shelter siting, this study could guide decision makers in selecting the locations of shelters while minimizing the total travel time. The model can easily be applied to different settings (e.g., different geographies) and be adapted to various situations (e.g., cost considerations, demand distributions, and distance constraints). The salient point is that the selected locations vary according to the demographic inputs. Therefore, the decision makers should use a community-engaged process to define their priorities, and the model would respond accordingly.
Limitations
Limitations for Tasks 1 and 3 arose mostly because the research team was not locally based and there were challenges connecting with participants and constraints on how much time could be spent working in the community. Due to the small team, the dissemination of the survey was limited to a small portion of the community. The team tried to ensure repeated connections with interview participants to notify of our visits and to spread the word through their networks. However, engagement for the report back section was limited due to limited time and ability to advertise the session. Thus, a strategic decision was made to focus on collaborating with the local emergency manager as the primary research partner.
The major limitation of Task 2 is the lack of demand data (i.e., the exact number of people who would seek public sheltering from each block group). Since exact demand figures are not available, surrogate population distributions were used in modeling. This limitation is also parallel with the capacity considerations. The capacities of the shelters would change the solutions; however, none of the feasible capacities could cover the demand distributions used in the model (e.g., the total population). Therefore, rather than exact demand figures, these population distributions are used assuming that similar ratios of people from each demand origin would require sheltering.
Future Research Directions
In future work, for overcoming Task 2 limitations, demand estimation models (e.g., regression) or stochastic modeling could be employed. Thus, capacity consideration could also be imposed during modeling. For Tasks 1 and 3, comparative work can be extended to other impacted communities with a focus on connecting with more local partners to support data collection and outreach. Our research team plans to next conduct follow-up work in Beauregard, Alabama, to further compare racial dynamics of disaster preparation and response across these two sites. In Mayfield, we have provided recommendations and modeling data to local emergency management officials and plan to continue conversation about sheltering systems there. We anticipate that this ongoing work will also lead to scholarly publications on racial dynamics of tornado preparation, response, and recovery.
References
-
Karabuk, S., & Manzour, H. (2019). A multi-stage stochastic program for evacuation management under tornado track uncertainty. Transportation research part E: logistics and transportation review, 124, 128-151. https://doi.org/10.1016/j.tre.2019.02.005 ↩
-
Changnon, S. A. (2009). Tornado losses in the United States. Natural Hazards Review, 10(4), 145–150. https://doi.org/10.1061/(ASCE)1527-6988(2009)10:4(145) ↩
-
National Weather Service. (2021, December 14). The violent tornado outbreak of December 10-11, 2021. National Oceanic and Atmospheric Administration. https://www.weather.gov/pah/December-10th-11th-2021-Tornado ↩
-
Niemeyer, L. (2022). Displaced Kentuckians still searching for housing after tornadoes. WKU Public Radio: https://www.wkyufm.org/regional/2022-02-16/displaced-kentuckians-still-searching-for-housing-after-tornadoes. Accessed May 27, 2023. ↩
-
Ripberger, J. T., Krocak, M. J., Wehde, W. W., Allan, J. N., Silva, C., & Jenkins-Smith, H. (2019). Measuring tornado warning reception, comprehension, and response in the United States. Weather, Climate, and Society, 11(4), 863–880. https://doi.org/10.1175/WCAS-D-19-0015.1 ↩
-
Hammer, B. & Schmidlin, T. W. (2002). Response to warnings during the 3 May 1999 Oklahoma City tornado: Reasons and relative injury rates. Weather and Forecasting, 17(3), 577–581. https://doi.org/10.1175/1520-0434(2002)0172.0.CO;2 ↩
-
Biddle, M. D. (2007). Warning reception, response, and risk behavior in the 3 May 1999 Oklahoma City long-track violent tornado [Doctoral dissertation, University of Oklahoma]. ProQuest Dissertations Publishing. ↩
-
Sherman-Morris, K. (2009). Tornado warning dissemination and response at a university campus. Natural Hazards (Dordrecht), 52(3), 623–638. https://doi.org/10.1007/s11069-009-9405-0 ↩
-
Godfrey, C. M., Wolf, P., Goldsbury, M. K., Caudill, J. A., & Wedig, D. P. (2011). An evaluation of convective warming utilization by the general public. 39th Conference on Broadcast Meteorology. Oklahoma City, OK, American Meteorological Society, 1.3, https://ams.confex.com/ams/39BROADCAST/webprogram/Paper189100.html ↩
-
Paul, B. K. & Stimers, M. (2012). Exploring probable reasons for record fatalities: The case of 2011 Joplin, Missouri tornado. Natural Hazards (Dordrecht), 64(2), 1511–1526. https://doi.org/10.1007/s11069-012-0313-3 ↩
-
Jauernic, S. T. & Van Den Broeke, M. S. (2015). Perceptions of tornadoes, tornado risk, and tornado safety actions and their effects on warning response among Nebraska undergraduates. Natural Hazards (Dordrecht), 80(1), 329–350. https://doi.org/10.1007/s11069-015-1970-9 ↩
-
Balluz, L., Schieve, L., Holmes, T., Kiezak, S., & Malilay, J. (2000). Predictors for people’s response to a tornado warning: Arkansas, 1 March 1997. Disasters, 24(1), 71–77. https://doi.org/10.1111/1467-7717.00132 ↩
-
Powell, S. W. & O’Hair, H. D. (2008). Communicating weather information to the public: People’s reactions and understandings of weather information and terminology. Third Symposium on Policy and Socio-Economic Research, New Orleans, LA, American Meteorological Society. https://ams.confex.com/ams/88Annual/webprogram/Paper132939.html ↩
-
Schultz, D. M., Gruntfest, E. C., Hayden, M. H., Benight, C. C., Drobot, S., & Barnes, L. R. (2010). Decision making by Austin, Texas, residents in hypothetical tornado scenarios. Weather, Climate, and Society, 2(3), 249–254. https://doi.org/10.1175/2010WCAS1067.1 ↩
-
Mason, J. B. & Senkbeil, J. C. (2015). A tornado watch scale to improve public response. Weather, Climate, and Society, 7(2), 146–158. https://doi.org/10.1175/WCAS-D-14-00035.1 ↩
-
Schmidlin, T. W., Hammer, B. O., Ono, Y., & King, P. S. (2009). Tornado shelter-seeking behavior and tornado shelter options among mobile home residents in the United States. Natural Hazards (Dordrecht), 48(2), 191–201. https://doi.org/10.1007/s11069-008-9257-z ↩
-
Klockow, K. E. (2013). Spatializing tornado warning lead-time: Risk perception and response in a spatio-temporal framework [Doctoral dissertation, University of Oklahoma]. ProQuest Dissertations Publishing. ↩
-
Silver, A. & Andrey, J. (2014). The Influence of previous disaster experience and sociodemographics on protective behaviors during two successive tornado events. Weather, Climate, and Society, 6(1), 91–103. https://doi.org/10.1175/WCAS-D-13-00026.1 ↩
-
Casteel, M. A. (2018). An empirical investigation of impact based tornado warnings on shelter in place decisions. International Journal of Disaster Risk Reduction, 30, 25-33. https://doi.org/10.1016/j.ijdrr.2018.01.036 ↩
-
Miran, S. M., Ling, C., & Rothfusz, L. (2018). Factors influencing people’s decision-making during three consecutive tornado events. International Journal of Disaster Risk Reduction, 28, 150-157. https://doi.org/10.1016/j.ijdrr.2018.02.034 ↩
-
Chiu, C. H., Schnall, A. H., Mertzlufft, C. E., Noe, R. S., Wolkin, A. F., Spears, J., Casey-Lockyer, M., & Vagi, S. J. (2013). Mortality from a tornado outbreak, Alabama, April 27, 2011. American Journal of Public Health, 103(8), e52-e58. ↩
-
Gelino, B. W., & Reed, D. D. (2020). Temporal discounting of tornado shelter-seeking intentions amidst standard and impact-based weather alerts: A crowdsourced experiment. Journal of Experimental Psychology: Applied, 26(1), 16. ↩
-
Merrell, D., Simmons, K. M., & Sutter, D. (2005). The determinants of tornado casualties and the benefits of tornado shelters. Land Economics, 81(1), 87-99. ↩
-
Senkbeil, J. C., Scott, D. A., Guinazu-Walker, P., & Rockman, M. S. (2014). Ethnic and racial differences in tornado hazard perception, preparedness, and shelter lead time in Tuscaloosa. The Professional Geographer, 66(4), 610–620. https://doi.org/10.1080/00330124.2013.826562 ↩
-
Ash, K. D. (2017). A qualitative study of mobile home resident perspectives on tornadoes and tornado protective actions in South Carolina, USA. GeoJournal, 82(3), 533-552. ↩
-
Chaney, P. L., Weaver, G. S., & Youngblood, S. A. (2015). Previous experience and tornado preparedness in DeKalb County, Alabama. Papers in Applied Geography, 1(2), 128-133. ↩
-
Ellis, K. N., Mason, L. R., Gassert, K. N., Elsner, J. B., & Fricker, T. (2018). Public perception of climatological tornado risk in Tennessee, USA. International Journal of Biometeorology, 62(9), 1557-1566. doi:10.1007/s00484-018-1547-x ↩
-
Klockow, K. E., Peppler, R. A., & McPherson, R. A. (2014). Tornado folk science in Alabama and Mississippi in the 27 April 2011 tornado outbreak. GeoJournal, 79(6), 791-804. ↩
-
McPeak, B. G., & Ertas, A. (2012). The good, the bad, and the ugly facts of tornado survival. Natural Hazards, 60(3), 915-935. ↩
-
Stokes, C., & Senkbeil, J. C. (2017). Facebook and Twitter, communication and shelter, and the 2011 Tuscaloosa tornado. Disasters, 41(1), 194-208. https://doi.org/10.1111/disa.12192 ↩
-
Birkmann, J., Cutter, S. L., Rothman, D. S., Welle, T., Garschagen, M., van Ruijven, B., O’Neill, B., Preston, B. L., Kienberger, S., Cardona, O. D., Siagian, T., Hidayati, D., Setiyadi, N., Binder, C. R., Hughes, B., & Pulwarty, R. (2015). Scenarios for vulnerability: Opportunities and constraints in the context of climate change and disaster risk. Climatic Change, 133(1), 53-68. doi:10.1007/s10584-013-0913-2 ↩
-
Murray-Tuite, P., Yin, W., Ukkusuri, S. V., & Gladwin, H. (2012). Changes in evacuation decisions between Hurricanes Ivan and Katrina. Transportation Research Record, 2312(1), 98-107. https://doi.org/10.3141/2312-10 ↩
-
Fricker, T., & Elsner, J. B. (2020). Unusually devastating tornadoes in the United States: 1995–2016. Annals of the American Association of Geographers, 110(3), 724-738. ↩
-
Elsner, J. B., Fricker, T., & Schroder, Z. (2019). Increasingly powerful tornadoes in the United States. Geophysical Research Letters, 46(1), 392-398. https://doi.org/10.1029/2018GL080819 ↩
-
Huang, S.-K., Lindell, M. K., & Prater, C. S. (2016). Who leaves and who stays? A review and statistical meta-analysis of hurricane evacuation studies. Environment and Behavior, 48(8), 991–1029. https://doi.org/10.1177/0013916515578485 ↩
-
Lindell, M. K., Murray-Tuite, P., Wolshon, B., & Baker, E. J. (2019). Large-scale evacuation: The analysis, modeling, and management of emergency relocation from hazardous areas: CRC Press. ↩
-
Litman, T. (2006). Lessons from Katrina and Rita: What major disasters can teach transportation planners.Journal of Transportation Engineering, 132(1), 11–18. https://doi.org/10.1061/(ASCE)0733-947X(2006)132:1(11) ↩
-
Thompson, R. R., Garfin, D. R., & Silver, R. C. (2017). Evacuation from natural disasters: A systematic review of the literature. Risk Analysis, 37(4), 812-839. https://doi.org/10.1111/risa.12654 ↩
-
Wolshon, B. (2001). “One-way-out”: contraflow freeway operation for hurricane evacuation. Natural Hazards Review, 2(3), 105-112. https://doi.org/10.1061/(ASCE)1527-6988(2001)2:3(105) ↩
-
Marcelin, J. M., Horner, M. W., Ozguven, E. E., & Kocatepe, A. (2016). How does accessibility to post-disaster relief compare between the aging and the general population? A spatial network optimization analysis of hurricane relief facility locations. International journal of disaster risk reduction, 15, 61-72. https://doi.org/10.1016/j.ijdrr.2015.12.006 ↩
-
Farhan, B., & Murray, A. T. (2008). Siting park-and-ride facilities using a multi-objective spatial optimization model. Computers & Operations Research, 35(2), 445-456. https://doi.org/10.1016/j.cor.2006.03.009 ↩
-
Horner, M. W., & Mascarenhas, A. K. (2007). Analyzing location-based accessibility to dental services: An Ohio case study. Journal of Public Health Dentistry, 67(2), 113-118. https://doi.org/10.1111/j.1752-7325.2007.00027.x ↩
-
Kocatepe, A., Ozguven, E. E., Horner, M., & Ozel, H. (2018). Pet- and special needs-friendly shelter planning in South Florida: A spatial capacitated p-median-based approach. International Journal of Disaster Risk Reduction, 31, 1207–1222. https://doi.org/10.1016/j.ijdrr.2017.12.006 ↩
-
Kwan, M.-P., Janelle, D. G., & Goodchild, M. F. (2003). Accessibility in space and time: A theme in spatially integrated social science.Journal of Geographical Systems, 5(1), 1–3. https://doi.org/10.1007/s101090300100 ↩
-
Alisan, O., Kocatepe, A., Tuydes-Yaman, H., Ozguven, E. E., & Ozel, H. (2017). Benefits of managing the capacity of special needs shelters with cross-county collaboration: Case study in Florida. Transportation Research Record: Journal of the Transportation Research Board, 2604(1), 131–143. https://doi.org/10.3141/2604-16 ↩
-
Alisan, O., Tuydes-Yaman, H., Kocatepe, A., & Ozguven, E. E. (2018). Developing performance measures to evaluate impact of cross-county collaboration for populations with access and functional needs. International Journal of Disaster Risk Reduction, 31, 873–885. https://doi.org/10.1016/j.ijdrr.2018.08.007 ↩
-
Arentze, T.A, Borgers, A.W.J., Ma, L., & Timmermans, H.J.P. (2010). An agent-based heuristic method for generating land-use plans in urban planning. Environment and Planning B, 37(3), 463-482. https://doi.org/10.1068/b35050 ↩
-
Daskin, M. S., Hesse, S. M., & Revelle, C. S. (1997). α-Reliable p-minimax regret: A new model for strategic facility location modeling. Location Science, 5(4), 227-246. doi:https://doi.org/10.1016/S0966-8349(98)00036-9 ↩
-
Murray, A. T., & Gottsegen, J. M. (1997). The influence of data aggregation on the stability of p-median location model solutions. Geographical Analysis, 29(3), 200-213. https://doi.org/10.1111/j.1538-4632.1997.tb00957.x ↩
-
Oliver-Smith, A. (1996). Anthropological research on hazards and disasters. Annual Review of Anthropology, 25(1), 303-328. ↩
-
Smith, N. (2006). There’s no such thing as a natural disaster. Retrieved from http://blogs.ubc.ca/naturalhazards/files/2016/03/Smith-There%E2%80%99s-No-Such-Thing-as-a-Natural-Disaster.pdf ↩
-
Cutter, S. L., Barnes, L., Berry, M., Burton, C., Evans, E., Tate, E., & Webb, J. (2008). A place-based model for understanding community resilience to natural disasters. Global Environmental Change, 18(4), 598-606. ↩
-
Johnson, L. A., & Olshansky, R. B. (2017). After great disasters: An in-depth analysis of how six countries managed community recovery: Lincoln Institute of Land Policy Cambridge. ↩
-
Pelling, M. (2003). The vulnerability of cities: Natural disasters and social resilience: Earthscan. ↩
-
Wisner, B., Gaillard, J., & Kelman, I. (2012). Framing disaster: Theories and stories seeking to understand hazards, vulnerability, and risk. In B. Wisner, J. Gaillard, & I. Kelman (Eds.), The Routledge handbook of hazards and disaster risk reduction (pp. 47-62): Routledge. ↩
-
Holmes, T. J., Mathias, J., McCreary, T., & Elsner, J. B. (2021). What's the problem with disaster? Anthropology, social work, and the qualitative slot. Qualitative Social Work, 20(6), 1496-1516. ↩
-
Pyles, L. (2017). Decolonising disaster social work: Environmental justice and community participation. British Journal of Social Work, 47(3), 630-647. ↩
-
Rogge, M. E. (2004). The future is now: Social work, disaster management, and traumatic stress in the 21st century. Journal of Social Service Research, 30(2), 1-6. ↩
-
Soliman, H. H., & Rogge, M. E. (2002). Ethical considerations in disaster services: A social work perspective. Electronic Journal of Social Work ISSN, 1537, 422X. ↩
-
Zakour, M. J., & Harrell, E. B. (2004). Access to disaster services: Social work interventions for vulnerable populations. Journal of Social Service Research, 30(2), 27-54. ↩
-
National Oceanic and Atmospheric Administration. (n.d.). NOAA Tornado Post-Event Survey Special Call: Tornado Ready Quick Response Research. Natural Hazards Center. University of Colorado Boulder. Retrieved March 29, 2023, from https://hazards.colorado.edu/uploads/basicpage/NOAA%20Tornado%20Post-Event%20Survey_NHC.pdf ↩
Mathias, J., Skipalis, B., Valappanandi, S., Holmes, T., LaFontant, D., Ozguven, E., Alisan, O., Kaya, M., McCreary, T., Roxas, E., & Bush, A. (2023). Sheltering Behavior During the December 2021 Tornado in Mayfield, Kentucky. (Natural Hazards Center Weather Ready Research Report Series, Report 10). Natural Hazards Center, University of Colorado Boulder. https://hazards.colorado.edu/weather-ready-research/sheltering-behavior-during-the-december-2021-tornado-in-mayfield-kentucky