The 2021 Marshall Fire
Rapid Integrated Damage Assessment
Publication Date: 2022
Abstract
Wildfires during a global pandemic create challenges for post-event damage assessment and long-term recovery. The Marshall Fire in Boulder County, Colorado, impacted more than 1,000 homes and burned more than 6,000 acres of land. This study integrates the Centers for Disease Control and Prevention social vulnerability index, qualitative interviews, and analysis of pre- and post-event 360-degree Google Street View imagery to assess social and environmental impacts of the wildfire. The study identified relatively low levels of socioeconomic vulnerability in areas impacted by the Marshall Fire. Socioeconomic status, however, is only one dimensions of social vulnerability. On other dimensions of—specifically, household composition and disability, minority status and language, and household type and transportation—residents in the study area were more vulnerable. Underinsurance of homes against wildfire hazard was also identified as a key issue in affected areas, and many of the buildings that were affected by the fire had high risk and exposure levels. Recovery planning incentives could be implemented to encourage building back in a way that protects human, built, and natural environments from wildfire risk. Planning incentives should include long-term climate change adaptation in addition to mitigation. Mitigation strategies could include grass fire breaks, fire-resistant building and landscaping materials, and yard hydrants. Adaptation strategies could include adjustment of building codes; land use planning that comprehensively considers building density and location in the wildland-urban interface in relation to wildfire risk; and relocation of buildings and structures outside of high-risk zones. The broader impacts of this project include advancing integration of diverse damage assessment data types for recovery planning, education, and training.
Introduction
Wildfire risk results from complex interactions between climate, weather, drought, wind, and vegetation, along with factors such as land use, human activities, and development (Ager et al., 20211). Long-term changes associated with climate and the impact of wildfires on vegetation contribute to uncertainty (Chileen et al., 20202). The frequency, intensity, and duration of these events is likely to increase due to climate change.
Damage reports from diverse sources, using different channels for submitting and collecting data, require additional ground truthing, validation, and integration to improve planning and decision support for response and recovery. Given that the direct costs in damage from a single wildfire incident can exceed tens of millions of dollars (Thomas et al., 20173), the damage assessment process is critical to giving insurers, assessors, planners, and decision makers a clear perspective of losses so that the recovery process may begin.
There is an unprecedented need to develop methods using currently available technologies and diverse data to support response and recovery operations during disaster events. Also, in damage and needs assessment, there is a need to better incorporate narratives of survivors (Brocato, 20214) and to include geographically and culturally relevant ways of coping after wildfire disasters (Montesanti et al., 20215). Recent wildfires near Boulder, Colorado, have presented opportunities to test 360-degree imagery collection for damage assessment. Paired with additional geospatial data on land use and qualitative interviews, this study seeks to build an understanding of the environmental and social impacts of the disaster event.
Literature Review
On Thursday, December 30, 2021, at 12:14 p.m., the Boulder County Emergency Operations Center activated to respond to multiple wildland fires in Boulder County, the largest of which would become known as the Marshall Fire (Boulder Office of Emergency Management [OEM], 20216). This study focuses on the areas affected by the Marshall Fire, which was reported just after 11:00 a.m. and forced more than 30,000 people to evacuate (OEM, 20227). The Marshall Fire burned more than 6,000 acres of land and destroyed over 1,000 homes worth more than $513 million (Colorado Division of Homeland Security and Emergency Management, n.d.8). Of the homes destroyed, 550 were in Louisville, 378 were in Superior, and 156 were in unincorporated Boulder County. An additional 149 homes were partially damaged in the fire. Seven commercial buildings were also destroyed, and 30 others were damaged. Two people were reported missing in the fire's aftermath. The fire was declared contained on January 4, 2022.
Wildfires do not historically happen during the winter, particularly in areas like Boulder County, where the ground is normally moist from snow. However, from July 1 through December 29, 2021, Denver recorded its lowest amount of precipitation, with snowfall at record lows (National Weather Service, n.d.9). Generally, Colorado is experiencing warmer temperatures, having warmed by about 2°F over the past 30 years (Colorado State Forest Service, n.d.10). Warmer and drier periods over the past two decades have resulted in some of the largest wildfires to have ever occurred in the state. According to the Global Climate Models developed by National Oceanic and Atmospheric Administration, NASA, and the National Center for Atmospheric Research, temperatures in Colorado may increase by as much as 6.5°F by 2050 (as cited in Colorado State Forest Service, n.d.).
Wildfires like the Marshall Fire, fueled by drought and spread by high wind conditions, increasingly affect regions across the United States, especially in the western parts of the country (Bermel, 202111; Thomas et al., 2017). Patterns of climate change in the western United States has led to increased risk of extreme rainfall following wildfire events, which can result in debris flows damaging infrastructure, houses, and roads such as in the Grizzly Creek Fire and subsequent flooding in Glenwood Canyon in July 2021 in Colorado (Touma et al., 202212). California and other states in the Pacific Northwest are also prone to these types of compound hazard events.
After disasters, there is a need to rapidly collect, consolidate, analyze, and disseminate damage assessment data to support relief and recovery efforts. This data can then be used to support early and long-term recovery planning (Berke & Goldshalk, 200913; Berke et al., 201214). As important as damage assessment is, there are key gaps in existing capabilities for how it can be done. First, damage assessment data collection is not always done in a way that aligns with long-term recovery goals, such as building back stronger, improving specific policies and actions, and coordination and participation in recovery (Kim & Olshansky, 201515). Secondly, governments and organizations active during disasters do not always include and engage vulnerable, at-risk populations in the recovery process and address persistent equity concerns (Kim et al., in press16; Wyte-Lake et al. 201917). Third, recovery planning does not always consider the trade-offs of green infrastructure and nature-based solutions. For example, while green infrastructure solutions such as adding vegetation adjacent to roadways may minimize flood risk, the same strategy may also inadvertently increase wildfire risk.
Several studies have tested emerging and existing technologies for damage assessment for wildfires. Spatial modeling and simulation studies have explored the connections between land use, social vulnerability, and exposure to wildfire (Govil et al., 202018; Palaiologou, et al. 201919; Paveglio et al., 201620; Paveglio et al., 201821; Rashkovetsky et al., 202122; Wigtil et al. 201623). These methods often use imagery of critical infrastructure and buildings from satellites integrated with crowdsourced social media data and formal damage reports. Following Hurricane Laura, which struck Lake Charles, Louisiana in October 2020, Kijewski-Correa et al. (202124) collected, processed, combined, and visualized 360-degree images of damaged infrastructure in an interactive database to support decision-making and recovery planning. Drones have also been used to collect post-disaster damage imagery for severe weather, earthquakes, volcanoes, and other hazard events (Kim & Davidson, 201525). These technologies limit human exposure to hazards while still providing useful data to emergency managers and those conducting response and recovery operations. Wildfire imagery has been used to promote concern over climate change (Duan et al., 202126). Yu and Atkinson (202227) found that individuals who interacted with 360-degree videos feel a stronger sense of spatial presence, which can have a crucial effect on wildfire risk perception. Negative emotions experienced by individuals interacting with 360-degree images of wildfire can motivate individuals to seek additional information regarding wildfire.
Wildfires and other disasters during a global pandemic create additional challenges in innovating post-event damage assessment and addressing existing weaknesses in long-term recovery (Kim & Olshansky, 2015). The COVID-19 pandemic created additional risks for in-person, physical inspection and damage assessment activities. Safe, non-invasive procedures with limited travel and exposure to potentially infected people with increased social distancing during rapid data collection and damage assessment activities are essential for keeping people safe from both types of natural hazards.
Research Design
This project combines 360 imagery collection, geospatial analysis, and qualitative interviews in its methodological approach. Together, these comprise a non-invasive data collection approach and analytical method to assess damage from the Marshall Fire to support planning for disaster recovery. This mixed methodological choice was informed by studies showing that visual imagery supports increased awareness and improved community engagement in wildfire risk reduction (Crow et al., 201728). Comparing pre- and post-event imagery, paired with qualitative insights about survivors’ experiences of the event, conveys a more holistic perspective of the impact of a disaster such as the Marshall Fire.
To begin, the team conducted virtual qualitative interviews with affected residents, community leaders, and those working in recovery in Louisville, Superior, and unincorporated Boulder County. From these interviews, the research team determined where to best focus 360-degree imagery collection on the ground, selecting for areas that were accessible to researchers and also sustained significant damage as a result of the Marshall Fire. Research team member Mike Vorce then visited Boulder County and collected georeferenced 360-degree imagery and conducted in-person, follow up interviews with other survivors. The 360-degree imagery was integrated it with land use, population statistics, census data, and other geospatial data from damage assessments conducted by local, state, and federal agencies. In addition, we incorporated the Centers for Disease Control and Prevention (CDC, 201829) Social Vulnerability Index (SVI) to identify at-risk populations in affected areas. We chose this index because it covers several measures of vulnerability and is one of the indices accepted by FEMA for use in collection of vulnerability assessment data. We considered overall social vulnerability at the census tract level, which aggregates measures of all four themes (socioeconomic status, household composition and disability, minority status and language, and housing and transportation). We also looked at vulnerability measures for each of the four themes individually. We compiled and analyzed a record of the damage to both structures and the natural environment to understand what happened and what can reduce risks and support recovery planning.
Research Questions
The purpose of this project is to collect and compile perishable data to support disaster recovery and mitigation from the December 2021 Marshall Fire. Additionally, this project demonstrates new technologies for rapid, field-based damage assessment, and will support development of decision support and planning tools for recovery.
The three main research questions address the following:
- How do patterns of fire damage correlate with socioeconomic indicators (i.e., housing type, tenure, affordability, insured/uninsured) and other factors associated with vulnerability?
- What opportunities exist for wildfire risk mitigation through land use planning, site control, and design, which researchers can document and monitor through mapping, data visualization, and spatial analytics?
- To what extent can longer term recovery planning and climate adaptation strategies emerge from the analysis of damage locations and clusters with opportunities for collective actions to reduce risk?
Data, Methods, and Procedures
To address research questions 1 and 2, the project team conducted desktop research covering the differential impacts of wildfire risk on socially vulnerable populations, as defined by the CDC (2018) SVI, focusing on socioeconomic status; household composition and disability; minority status and language; and housing and transportation (Flanagan et al., 201130). Our team gathered additional geographic information systems (GIS) data on land use, demographics, and critical infrastructure such as transportation networks, emergency services. In addition, data on wildfire risk, wildfire exposure, and housing density from Scott et al. (2020a31) and Scott et al. (2020b32) was analyzed to determine vulnerabilities that existed before the Marshall Fire. We first rendered this data as gradient raster data; we then used the raster layers for fire exposure and conditional fire risk to generate color-coded contour plots.
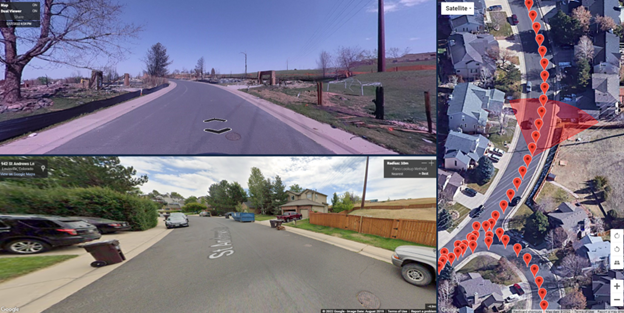
To augment the analysis of existing geospatial data on wildfire risk, the research team collected 360-degree imagery in areas most heavily damaged by the wildfires, areas with high SVI index scores, and other areas where collective planning and risk mitigation strategies may achieve the most impact. Team member Mike Vorce deployed a 360-degree camera on a vehicle that was driven through the study area, allowing for rapid collection of imagery. The imagery captured was also geolocated during the collection process, allowing for accurate locations to be related to images once uploaded and visualized onto GIS platforms. Most of the United States uses the Google Street View (GSV) platform, providing a comprehensive set of “pre-event” 360-degree imagery available for baseline comparison. Figure 1 shows an example of the interactive data portal through which the 360-degree imagery can be explored. The equipment used for the 360-degree image collection consisted of a Lab Pano Pilot One EE Edition 360-degree camera, a vehicle mount, a setup for doing walking collections, and a smartphone to control the camera. The imagery gathering period for this project took place from May 8-13, 2022.
Figure 1. Imagery of Damage from the 2021 Marshall Fire
Before this current study, the research team had experience gathering 360-degree images to compare pre- and post-event imagery for damage assessment. One gathering of imagery followed a tornado in Monroe, Louisiana in 2020 (Site Tour 360, 2020a33, 2020b34), another after flooding and landslides in Kauai, Hawaii in 2018 (Site Tour 360, 201835), and one gathering session following Hurricane Dorian in the Bahamas in 2019 (Site Tour 360, 201936). These images were used for research on recovery needs and were also shared with local emergency managers and organizations working in recovery. They also served as training data sets for machine learning research projects involving using artificial intelligence to classify damage to buildings and roads.
To address research question 3, researchers conducted in-person and virtual interviews with recovery experts in emergency management and community resilience in Colorado to contextualize the quantitative data with qualitative insights of the recovery progress on the ground.
Study Site Description
The location for this study is the area affected by the 2021 Marshall Fire, particularly Louisville, Superior, and unincorporated areas of Boulder County. The population of Boulder County is approximately 330,758, according to the 2020 Census (U.S. Census Bureau, 202037). Figures 2 depicts a map of buildings that were damaged or destroyed in the study area.
Figure 2. Buildings Damaged or Destroyed during the 2021 Marshall Fire
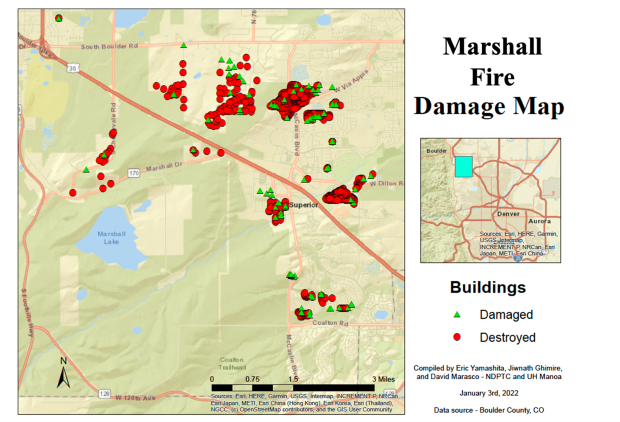
Note. Data from Marshall Fire Recovery, by Boulder County, n.d.
Figure 3 shows the number of buildings damaged or destroyed by the wildfire in each jurisdiction in the study area.
Figure 3. Buildings Damaged or Destroyed by the 2021 Marshall Fire
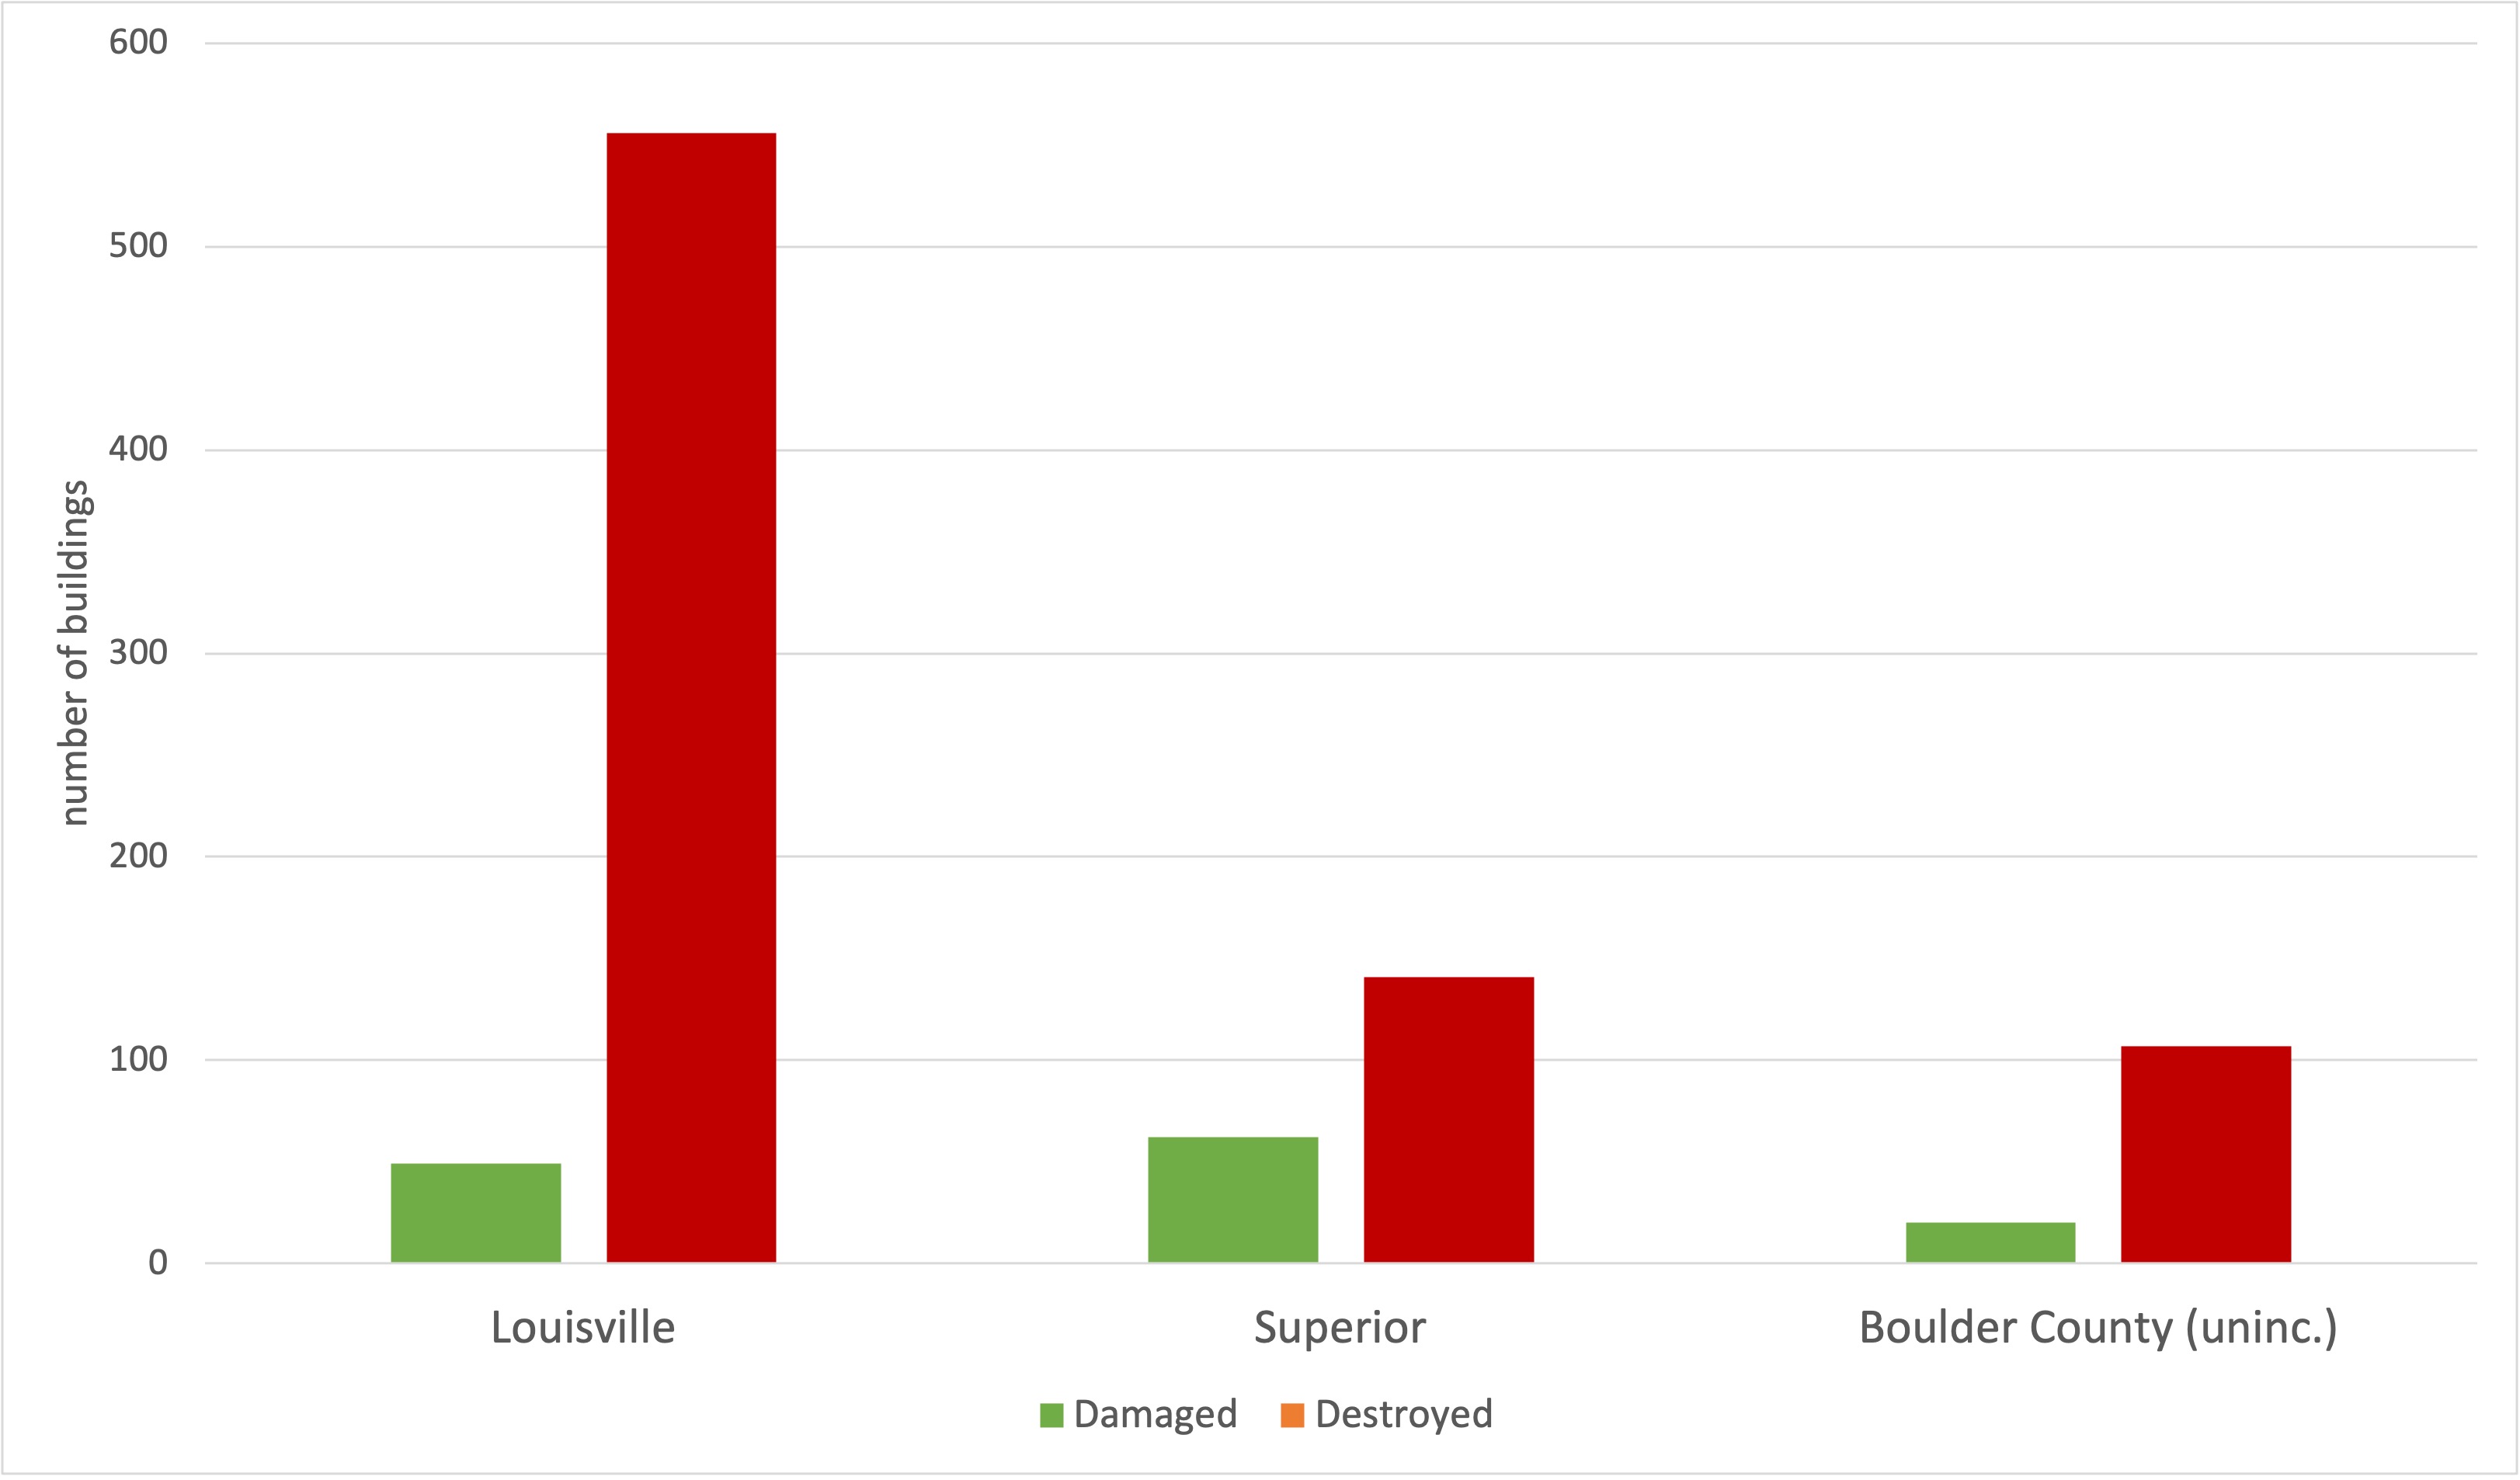
Note. Data from Marshall Fire Recovery, by Boulder County, n.d.
Sampling and Participants
We conducted a total of 10 interviews. We selected interviewees using a purposive sample to include four affected residents, three community leaders, and three disaster managers working in recovery in Louisville, Superior, and unincorporated Boulder County. The intent of these interviews was to understand challenges and opportunities in ongoing recovery efforts; perceptions of the relationship between development patterns and exposure to wildfire risk; the extent of material and non-material losses experienced because of the wildfire; and the likelihood of gaining access to damaged sites for image gathering. We used formal channels (e.g., a designated email form established by Boulder County Office of Emergency Management) to reach emergency managers and recovery managers working in Boulder to avoid overburdening the workforce and community leadership actively engaged in recovery and healing. The research team also relied upon our connections to Boulder through the Natural Hazards Center and the wider National Disaster Preparedness Training Center (NDPTC) network to identify potential interviewees.
Data Analysis
We analyzed the data using standard geospatial analytics to identify patterns, clusters, and spatial autocorrelation. We geocoded addresses of damaged and destroyed homes and added to the map as a point vector layer. A vector polygon Marshall Fire Boundary layer, created by Boulder County, was obtained through ArcGIS Online. We obtained SVI data (2018) from the CDC and examined it at the census tract level for overall social vulnerability, as well as socioeconomic factors; household composition and disability; minority status and language; and household type and transportation, with darker colors indicating higher vulnerability percentile ranking scores when comparing all census tracts within the state of Colorado.
Using ArcGIS Online and the data and images gathered for the study, we constructed a StoryMap to aggregate the study’s major findings (National Disaster Preparedness Training Center [NDPTC], 2022d38). The StoryMap and images gathered for this project will be shared with study participants and integrated into existing NDPTC partnerships with tribal and rural communities working on disaster recovery and community resilience (NDPTC, 2022d). The study findings will further assist in understanding populations vulnerable to wildfires (Blanke & McGrady, 201139; Wyte-Lake et al., 2019), as well as technologies that can aid damage assessment and recovery (Easthope & Mort, 201440).
Ethical Considerations, Researcher Positionality, Reciprocity, and Other Considerations
A human subjects approval protocol (#2022-00290) was submitted to and approved by the Institutional Review Board of the University of Hawaii.
Human Subjects
All procedures that involved human participants were done in accordance with the ethical standards of the institutional and National Commission for the Protection of Human Subjects of Biomedical and Behavioral Research. The research team aims to adhere to the ethical principles outlined in the Belmont Report: respect for persons, beneficence, and justice. All research team members received training on human subject protection and information security. The research design, survey instruments, interview guidelines, consent documents, and data governance plan were submitted to the University of Hawaii Office of Research Compliance for review and approval according to ethical standards of human studies.
Financial Support
This study was supported by the Natural Hazards Center Quick Response Research Award Program. Faculty and staff affiliated with the NDPTC and Pacific Urban Resilience Lab at the University of Hawaii at Manoa carried out the study.
Privacy and Confidentiality
All data will be kept confidential in an encrypted form on a password-protected computer. Other agencies with legal permission, including the Human Studies Program at the University of Hawaii, have the right to review research records. The results of this study will be used in reports and publications and can be shared with participating organizations and individuals upon request. Data collected does not contain any personally identifiable information.
Engagement with Local Partners and Coordination with Other Researchers
The research team engaged with local partners and researchers to coordinate data gathering and sharing, training, and capacity building to use and implement the technologies and systems for capturing, interpreting, and documenting damage and recovery.
Sharing Results
The dissemination plan includes sharing results with participants and NDPTC partners near the close of the study. The research team will share results at meetings and conferences, integrate into publications and journal articles, and use study findings in training courses and curricula for university students, continuing education, and training for emergency managers, urban planners, and recovery practitioners.
Ethical Reflexivity
The research team actively engaged in ethical reflexivity throughout the course of the project, taking into consideration our role in the research process to ensure that the project continues to pose less than minimal risk (i.e., no known physical, emotional, psychological, reputational, or economic risk) to those who participate in it.
Conflicts of Interest
The authors declare that they have no conflicts of interest.
Findings
Social Vulnerability and Patterns of Fire Damage
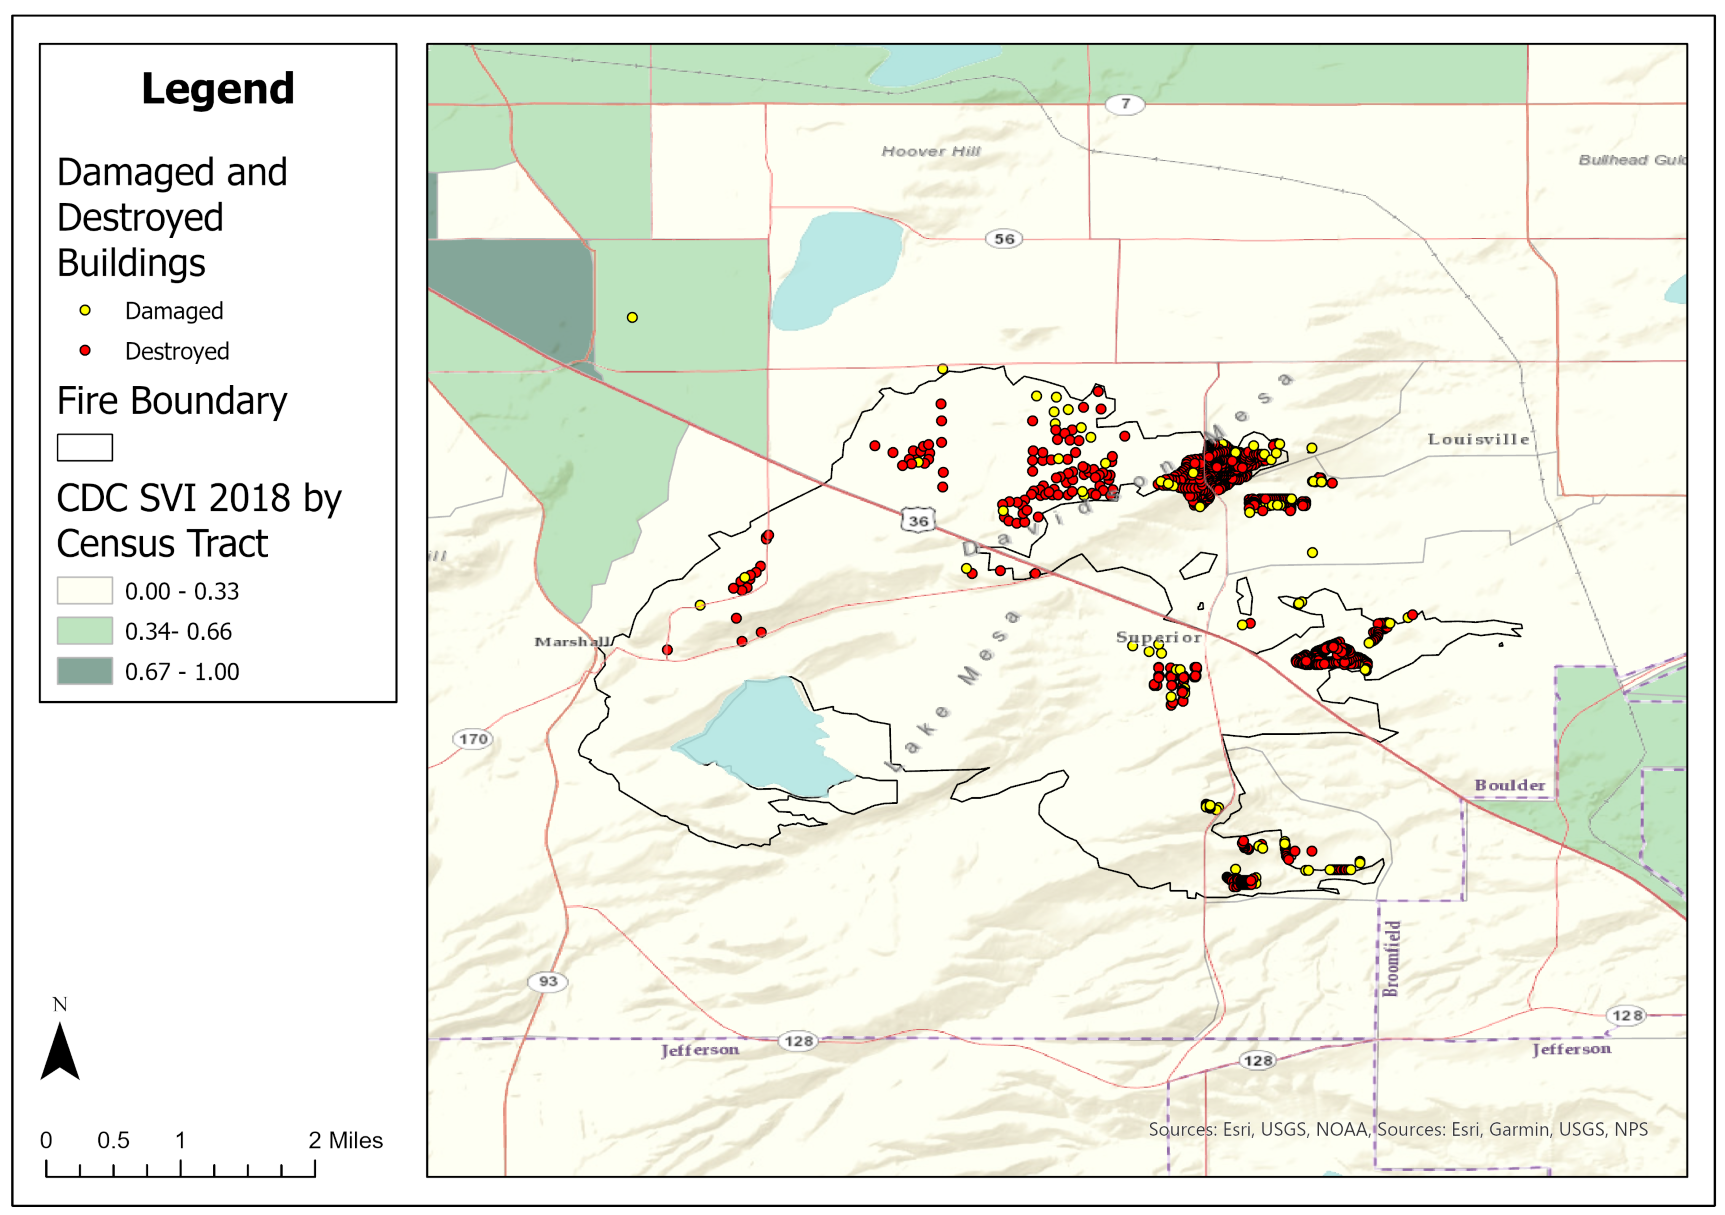
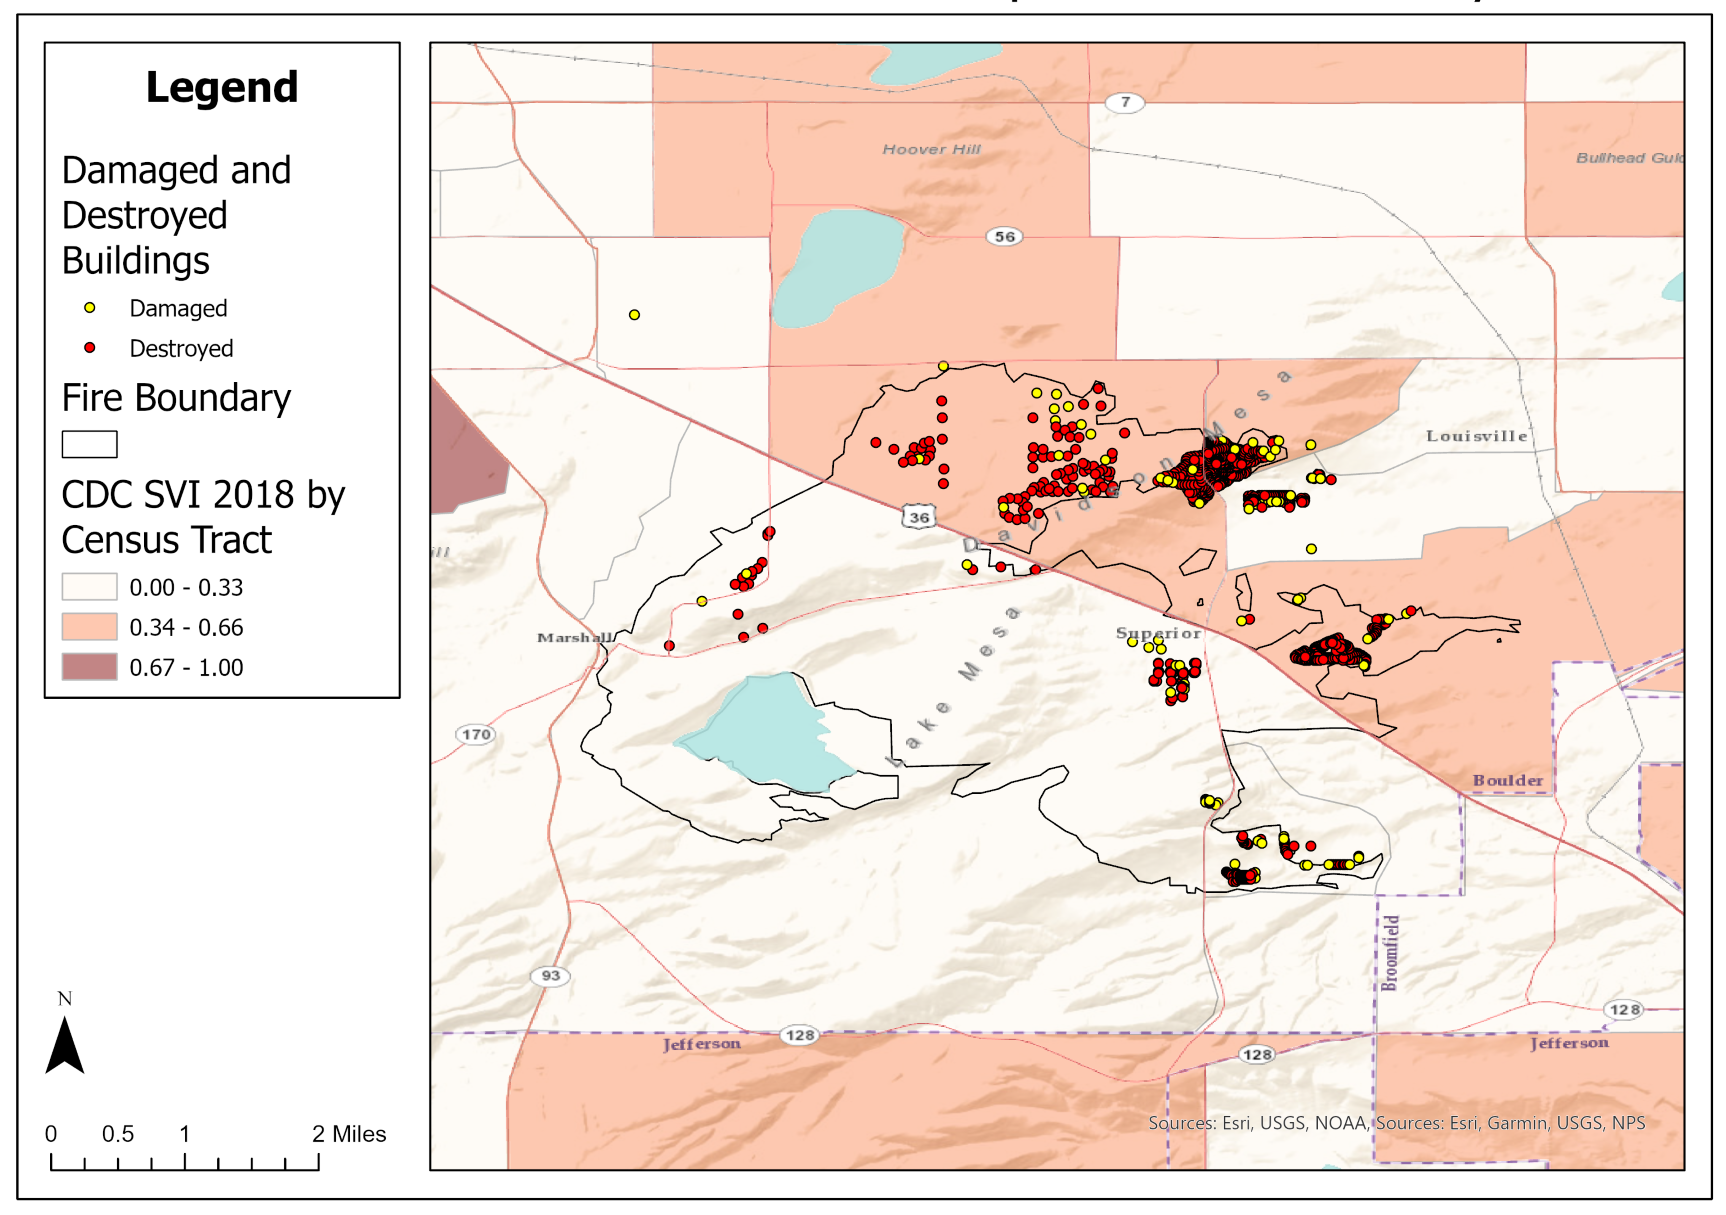
The SVI provides specific socially and spatially relevant information to help public health officials and local planners better prepare communities to respond to emergency events such as severe weather, wildfire, floods, disease outbreaks, or chemical exposure (Flanagan et al., 2011; CDC, 2018). The SVI indicates the relative vulnerability of every U.S. Census tract or block, ranking jurisdictions based on 15 social factors, including unemployment, minority status, and disability, and further groups them into four related themes. As depicted in Figure 4, overall social vulnerability is relatively low in the areas impacted by the Marshall Fire .
Figure 4. Overall Social Vulnerability in the Study Area

Note. Yellow and red dots represent buildings damaged and destroyed, respectively, by the Marshall Fire. Data from CDC/ATSDR Social Vulnerability Index 2018 Database Colorado, by Centers for Disease Control and Prevention, Agency for Toxic Substances and Disease Registry, Geospatial Research, Analysis, and Services Program, 2018; Marshall Fire Recovery, by Boulder County, n.d.
Figure 5 shows that measures of social vulnerability related to socioeconomic status specifically are also relatively low.
Figure 5. Socioeconomic Vulnerability in the Study Area
Note. Yellow and red dots represent buildings damaged and destroyed, respectively, by the Marshall Fire. Data from CDC/ATSDR Social Vulnerability Index 2018 Database Colorado, by Centers for Disease Control and Prevention, Agency for Toxic Substances and Disease Registry, Geospatial Research, Analysis, and Services Program, 2018; Marshall Fire Recovery, by Boulder County, n.d.
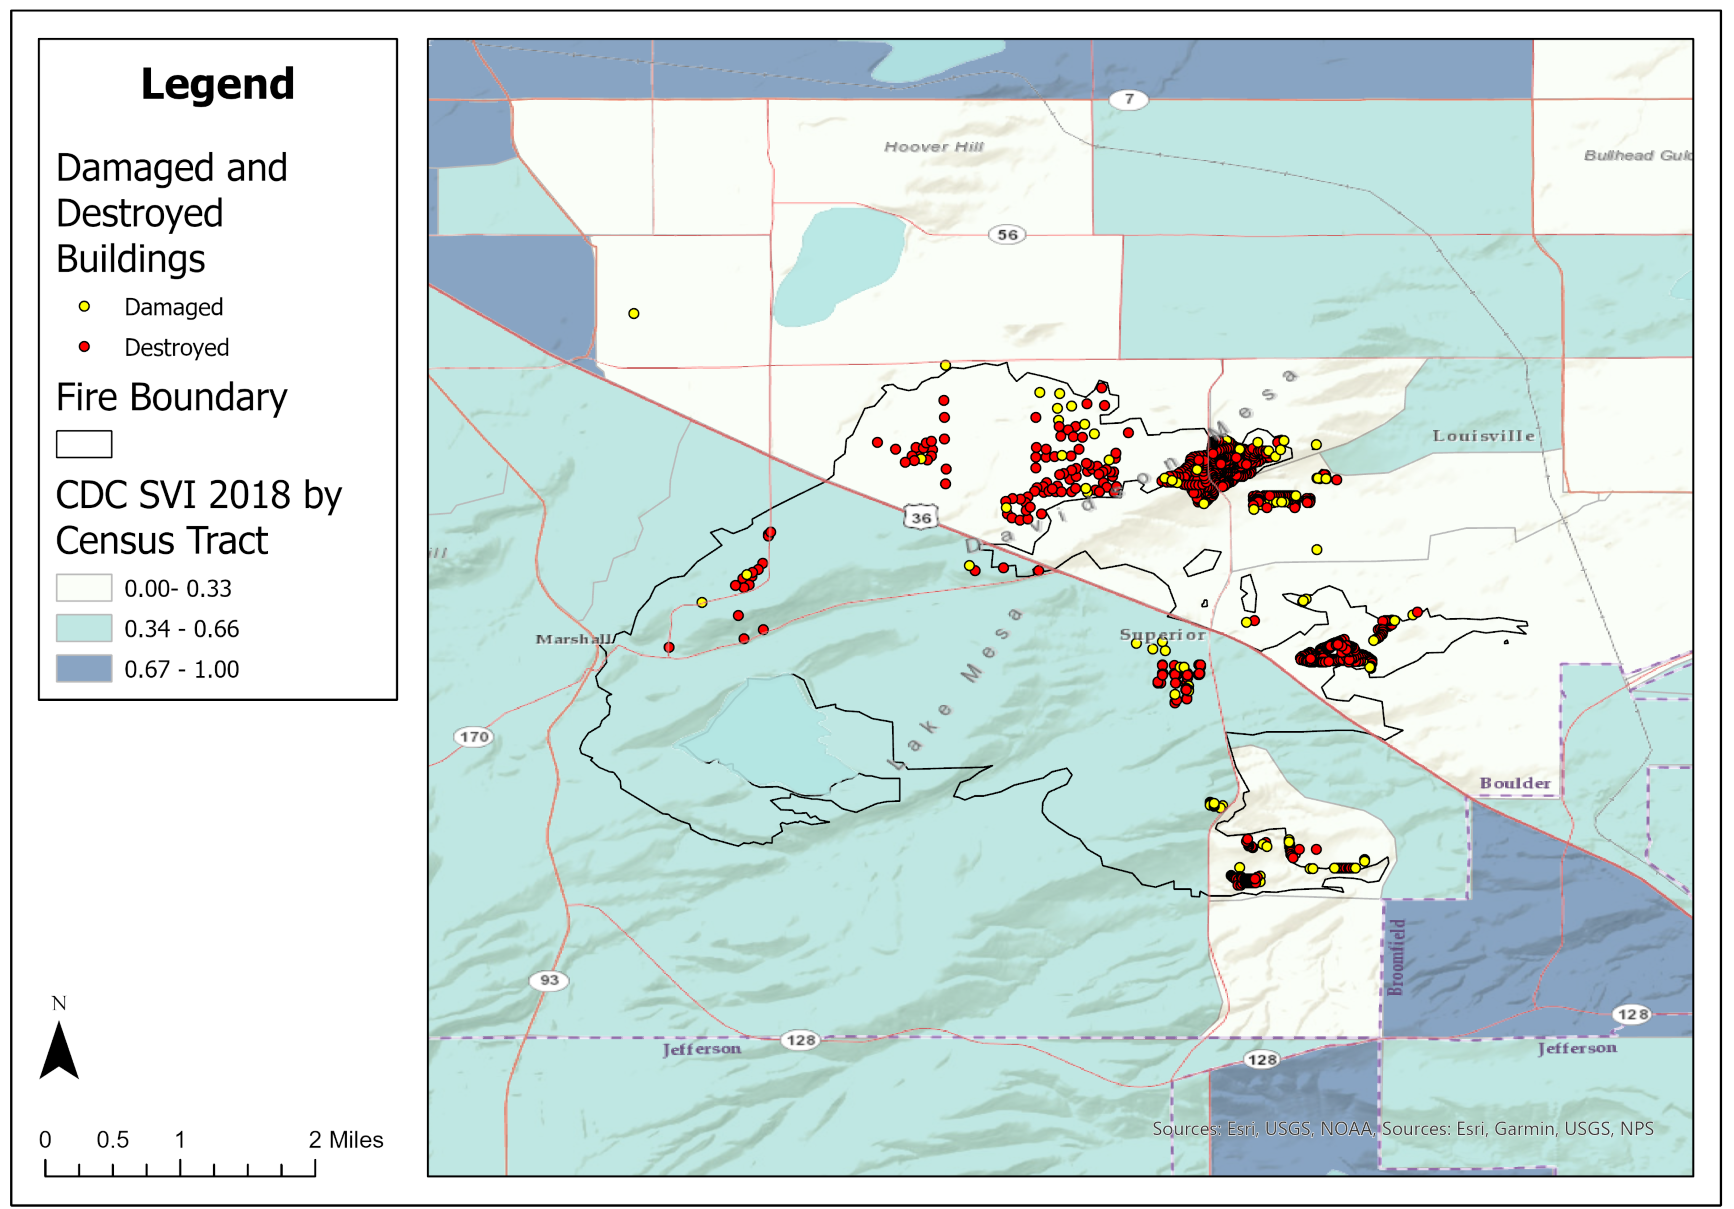
However, upon taking a deeper look, we found vulnerability along the other dimensions of CDC SVI index to be higher in the study area. Figure 6 depicts, for example higher social vulnerability related to household composition and disability for the northernmost regions of the Marshall Fire.
Figure 6. Household Composition and Disability Vulnerability in the Study Area
Note. Yellow and red dots represent buildings damaged and destroyed, respectively, by the Marshall Fire. Data from CDC/ATSDR Social Vulnerability Index 2018 Database Colorado, by Centers for Disease Control and Prevention, Agency for Toxic Substances and Disease Registry, Geospatial Research, Analysis, and Services Program, 2018; Marshall Fire Recovery, by Boulder County, n.d.
Figure 7, on the other hand, shows how social vulnerability related to minority status and language is higher in the southwest areas impacted by the fire.
Figure 7. Minority Status and Language Vulnerability in the Study Area
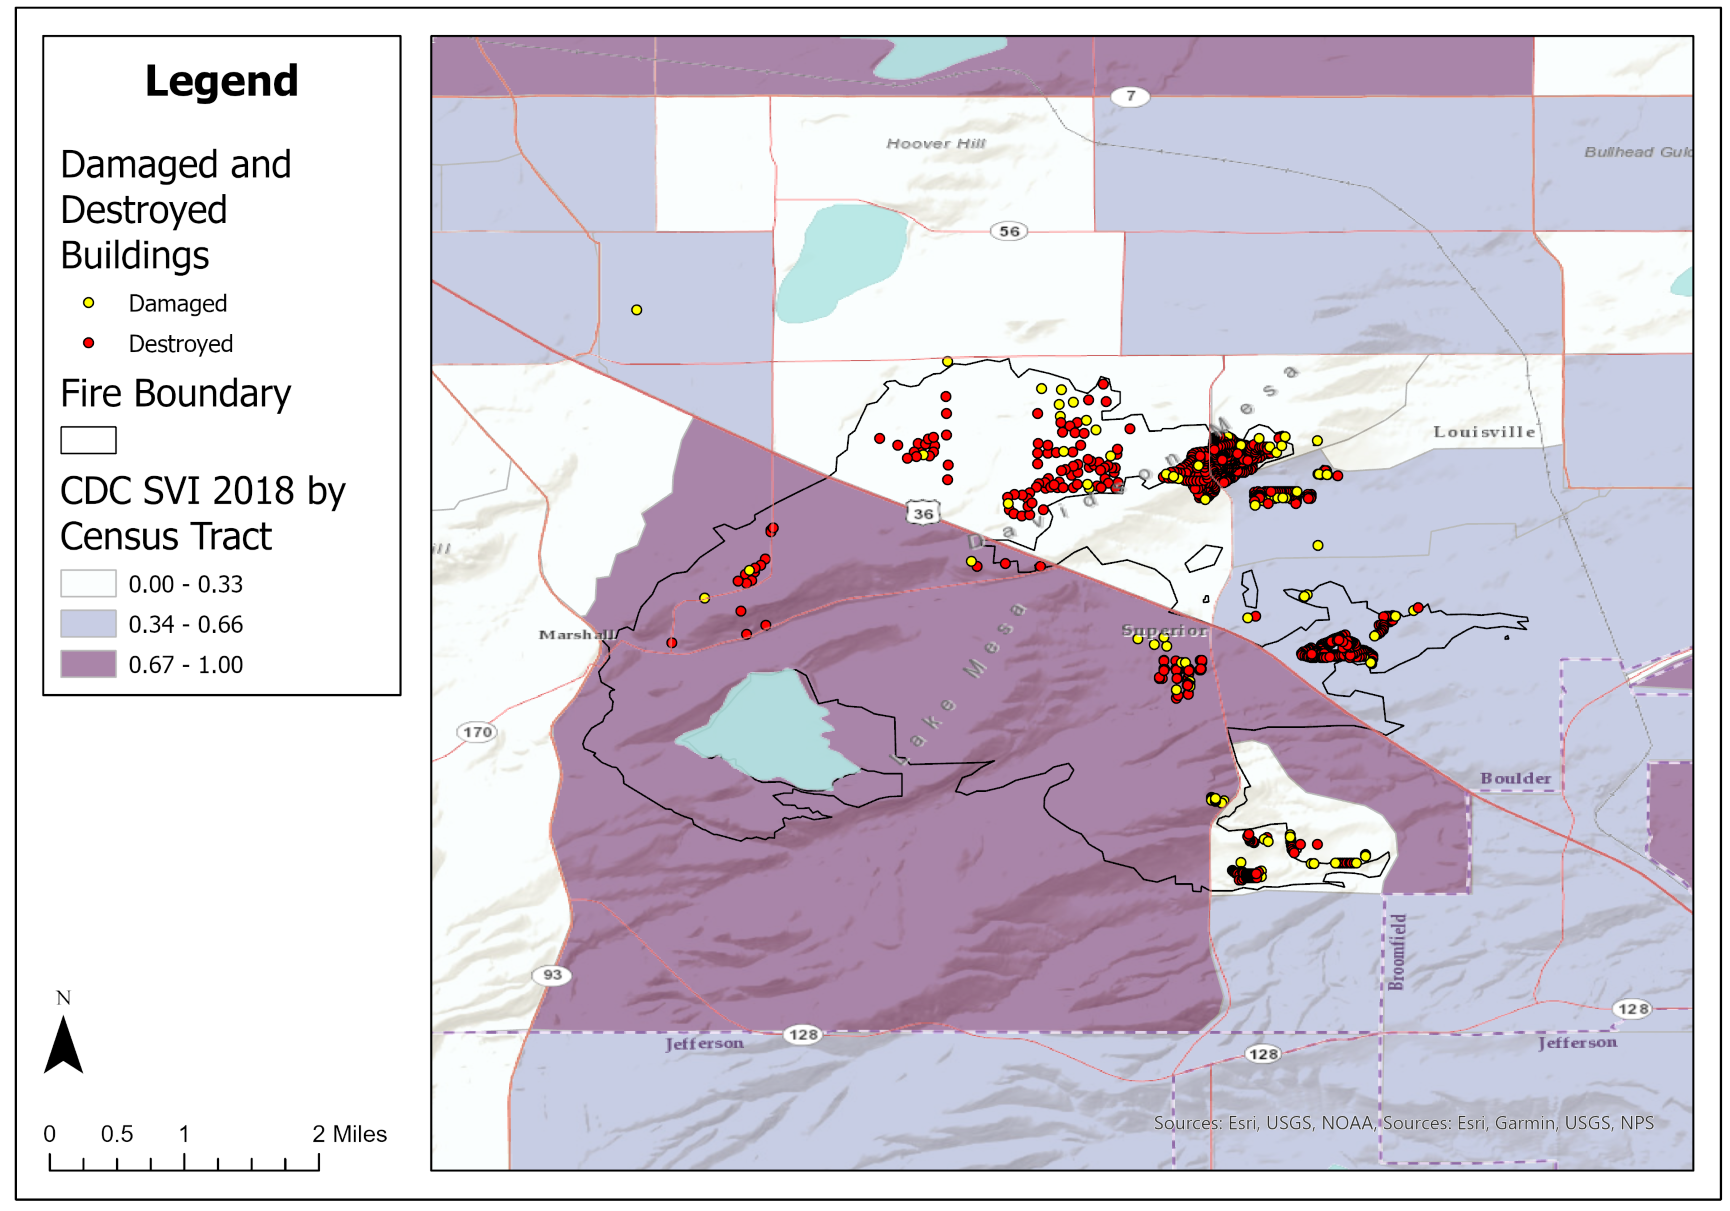
Note. Yellow and red dots represent buildings damaged and destroyed, respectively, by the Marshall Fire. Data from CDC/ATSDR Social Vulnerability Index 2018 Database Colorado, by Centers for Disease Control and Prevention, Agency for Toxic Substances and Disease Registry, Geospatial Research, Analysis, and Services Program, 2018; Marshall Fire Recovery, by Boulder County, n.d.
Figure 8 displays how social vulnerability related to household type and transportation measures are also higher in the southwest areas impacted by the fire. One resident of the town of Superior who is involved with the community-led Gratitude Project said, “This [was] an urban fire. It damaged homes—physical damage, financial damage, community damage.” She emphasized that whether a resident’s home was damaged or not, those living in Superior have likely experienced trauma and anxiety from the wildfires related to pre-existing social vulnerabilities and impacts of the damage on mental health and well-being.
Figure 8. Household Type and Transportation Vulnerability in the Study Area
Note. Yellow and red dots represent buildings damaged and destroyed, respectively, by the Marshall Fire. Data from CDC/ATSDR Social Vulnerability Index 2018 Database Colorado, by Centers for Disease Control and Prevention, Agency for Toxic Substances and Disease Registry, Geospatial Research, Analysis, and Services Program, 2018; Marshall Fire Recovery, by Boulder County, n.d.
Interviewees and ancillary research revealed underinsurance of homes against wildfire hazard to be a key issue in affected areas. Despite relatively lower social vulnerability in Boulder County, which can be an enabling environment for financial readiness against disasters, community leaders assisting residents with recovery reported that many homes were underinsured, and even people with insurance were struggling to navigate the process of filing claims for insurance payouts. One community leader in Boulder County summarized the types of losses experienced by residents:
Loss of life, loss of pets, neighborhoods, neighbors, well-being, sudden loss of worldly possessions—much of which cannot be replaced—and a percentage of which will not be recouped through insurance, donations, or services. Loss of time; many rebuilders have full-time jobs, schools, and families, and are faced with moving, furnishing, and navigating the world of rebuilding.
The Colorado Department of Regulatory Agencies Division of Insurance (DOI) captured this insurance disparity. The DOI estimates $1,022,353,367 in total incurred claims, of which between $39 million and $179 million represents the estimated total amount of underinsurance in Boulder County (Colorado Division of Regulatory Agencies Division of Insurance, 202241). Residents of Boulder County identified 1,084 total losses. The Small Business Administration approved $91.2 million in disaster loans for homeowners impacted by the Marshall Fire (DOI, 2022).
Wildfire Risk Mitigation through Land Use Planning, Site Control, and Design
Land use planning played a critical role in Boulder County’s wildfire risk. One way to assess wildfire damage risk to wildfires is to look at the likelihood and degree to which a building will be damaged if a fire breaks out nearby (Scott, Brough, et al., 2020; Scott, Gilbertson-Day, et al., 2020). Figure 9 shows a contour map estimating approximate conditional fire risk to homes in and around the Marshall Fire path. “Conditional Risk to Potential Structures” (CRPS) is a measure used to represent the risk of damage from a fire that a home would face were it in a given location, based on estimated wildfire intensity (Scott, Gilbertson-Day, et al., 2020). CRPS integrates wildfire intensity with generalized consequences to a home but does not account for the probability of wildfire. Many of the buildings that were affected by the fire had risk levels between 40 and 60 on a scale of 1 to 100. This conditional risk level is generally elevated compared to that of nearby Denver County, a highly developed region that has an average conditional risk for homes (Scott, Gilbertson-Day, et al., 2020; City of Denver, n.d.42). Few buildings were in areas with extremely low conditional risk levels.
Figure 9. Conditional Fire Risk Contours in the Study Area
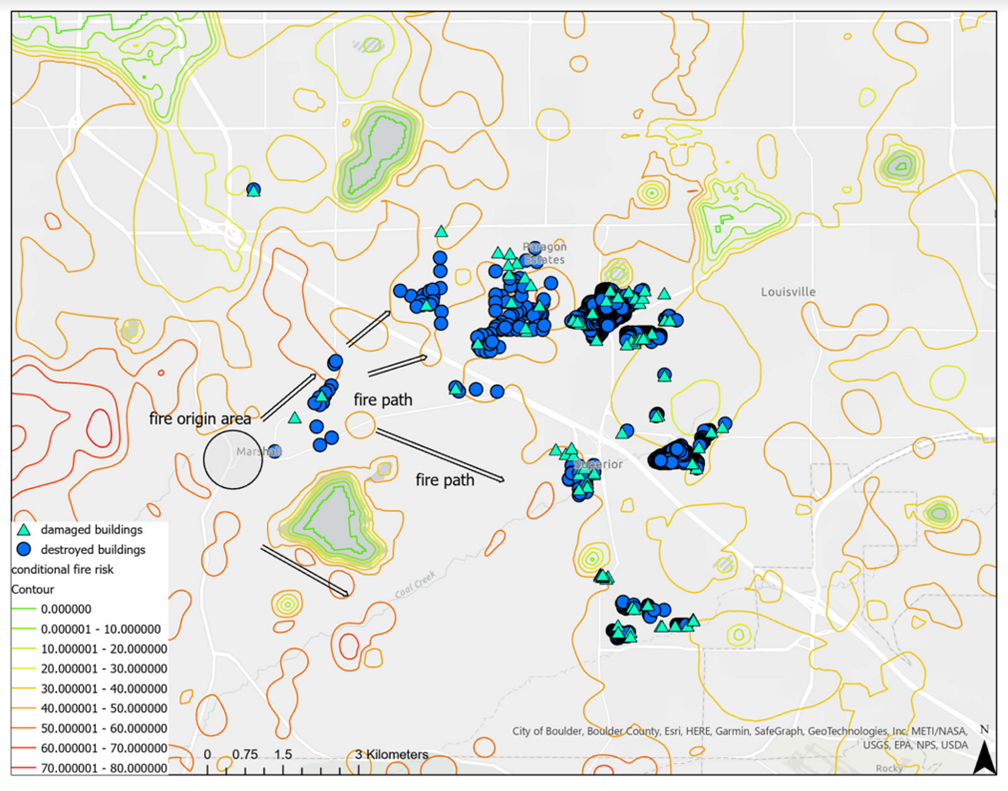
Note. Teal triangles and blue dots represent buildings damaged and destroyed, respectively, by the Marshall Fire. Data from Wildfire Risk to Communities: Methods for geospatial datasets for populated areas in the United States, by J. H. Scott, J. W. Gilbertson-Day, C. Moran, G. K. Dillon, K. C. Short, and K. C. Volger, 2020, Forest Service Research Data Archive; Marshall Fire Recovery, by Boulder County, n.d.
Exposure levels—defined as a home’s proximity to flammable vegetation and other buildings (Scott, Gilbertson-Day, et al., 2020)—also factor into fire risk evaluations. Figure 10 shows that the area in which the Marshall Fire originated has a very high exposure score (0.9+ on a scale of 0 to 1), as does most of the fire’s subsequent path. The map shows damaged and destroyed buildings in the study area overlaid with exposure, a measure from Scott, Brough, et al. (2020) that delineates where homes would be directly exposed to wildfire from adjacent wildland vegetation, indirectly exposed to wildfire from indirect sources such as embers and home-to-home ignition, or not exposed to wildfire due to distance from direct and indirect ignition sources. As expected, many of the damaged and destroyed buildings fall into areas with high housing density; however, given that vegetation was a major source of fuel for the fire, many of the damaged structures were also located into areas with low housing density.
Figure 10. Exposure Level Contours in the Study Area
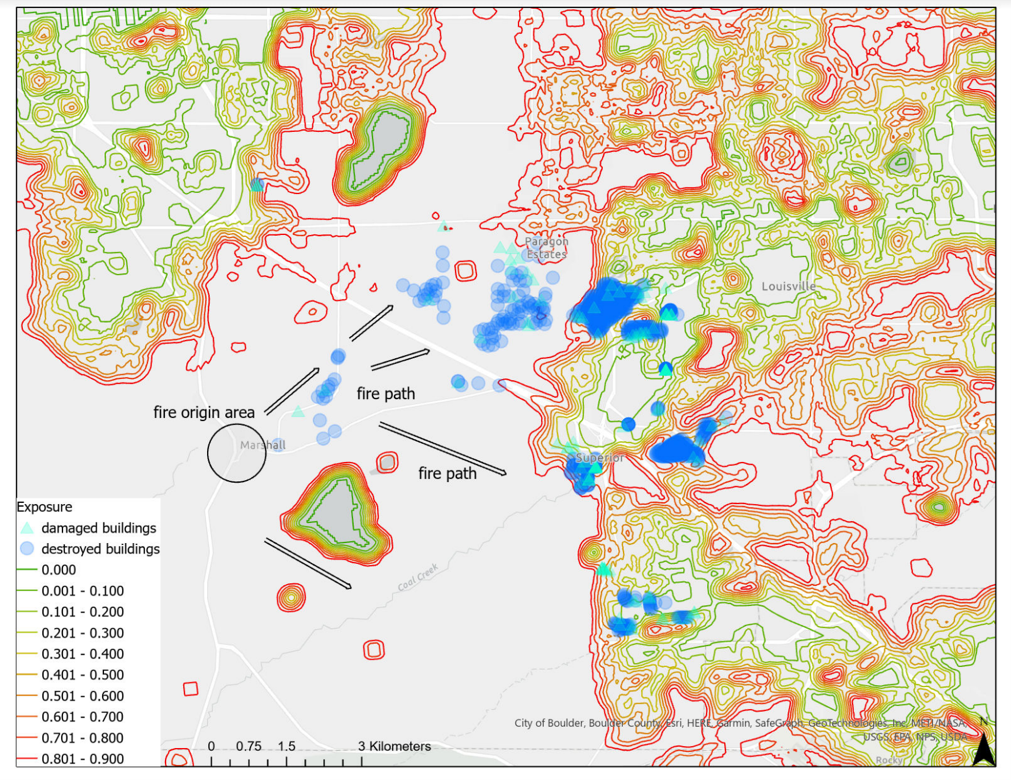
Note. Teal triangles and blue dots represent buildings damaged and destroyed, respectively, by the Marshall Fire. Data from Wildfire Risk to Communities: Methods for geospatial datasets for populated areas in the United States, by J. H. Scott, J. W. Gilbertson-Day, C. Moran, G. K. Dillon, K. C. Short, and K. C. Volger, 2020, Forest Service Research Data Archive; Marshall Fire Recovery, by Boulder County, n.d.
The fire eventually burned down entire neighborhoods after spreading across a landscape that had an abundance of fire fuel, including housing stock and grassland. One local business owner reported, “One of my customers had two houses up across from the Costco, and they lost them both in 20 minutes. That’s how long it took to burn all the way down.” This is consistent with the land use analysis results showing that there was no shortage of fuel for the wildfire to burn through. Notably, many homes with low to moderate exposure levels burned to the ground. This might be attributable to the fact that they were in neighborhoods adjacent to high-exposure zones that directly abutted the path of the Marshall Fire. This suggests that after one or more high-exposure homes in dense neighborhoods caught on fire, the flames rapidly spread to other nearby units. This potentially means that the role of building density in determining exposure levels might need to be revisited in future disaster recovery planning efforts.
Long-Term Recovery Planning
The policy framework guiding Colorado’s recovery efforts is the Disaster Preparedness and Recovery Resources Senate Bill (SB22-206), passed in May 202243. The bill was introduced in April 2022, after the Marshall Fire. Although the bill was not a direct response to the Marshall Fire response and recovery, it is anticipatory policy action that supports rebuilding after future wildfires, which are likely to occur in the state and region again. The bill created a Disaster Resilience Recovery Program in the Division of Local Government, a sustainable rebuilding program in the Colorado Energy Office, and an Office of Climate Preparedness in the Governor’s Office. It funds $35 million in grant programs and allocates $15 million on wildfire fighting aviation resources and a statewide dispatch center.
Several long-term recovery planning efforts are underway in Boulder County following the Marshall Fire. Each affected town has its own localized recovery initiative, though community leadership and is coordinated across these jurisdictions. The Department of Local Affairs is responsible for administering approximately $14 million available from Community Development Block Grant Disaster Recovery (CDBG-DR) (Programs and Mitigation) and annual CDBG (Housing and Business) funding for expenses related to housing, public infrastructure, economic development, and planning in relation to Marshall Fire recovery. The Division of Local Government is responsible for coordinating regional managers of Disaster Assistance Centers, who play an advisory role to local governments for recovery planning and gaining access to grants. The Division also houses the Colorado Resiliency Office, which leads the state’s Long Term Recovery Working Group (LTRWG). The Division of Housing assists in identifying rental resources; managing the CDBG and CDBG-DR grants; and advising the LTRWG on housing issues and programs. Approximately 70% of recovery funding is set to be allocated to low- and moderate-income households, defined as 80% of the area median income. Within Boulder County, approximately one in five homeowners meet this criterion. About 15% of CDBG-DR funding is for mitigation, with 80% of these funds being spent in zip code 80027, where approximately 87% of damages were sustained.
In addition to existing state-led efforts, residents involved with local recovery flagged several other factors that need to be addressed in long-term recovery planning. First, local governments and leadership need to educate residents about what their wildfire insurance options are, especially those that are underinsured or not insured. Homeowners with insurance must understand what their policies cover, and those without insurance should be given information about what policies exist and should be encouraged to acquire wildfire insurance for their homes. Second, public education about wildfire risk in the Wildland-Urban Interface must be widespread. One resident admitted, “I realized that grass fires are as dangerous as forest fires…so that’s a wake-up call.” Many residents were not aware that their homes were prone to wildfire risk simply because they were located close to other homes or next to grassland areas. One resident remarked,
It’s gonna be ten years before this town is back to normal again…[Y]ou have [hundreds of] homes that all have to go through the permitting processes…and the permitting process was already behind [before the fire].
Property owners who are seeking to rebuild need to determine which permitting process is most suitable for them. Those who wish to rebuild in the same location and footprint generally can apply for building permits immediately, and in Colorado, the permitting process requires that property owners rebuild with additional wildfire resiliency measures (Boulder County, n.d.44). However, if a property owner wishes to make any changes to their pre-existing structure, a review process must be implemented to assess any modifications. The timeline for these processes can introduce additional uncertainty in the recovery process.
Discussion
Our findings addressing research question 1 related to the correlation between land use and wildfire exposure were as expected: where there are more houses and vegetation, there tended to be more fuel. While the study area scored relatively low on the social vulnerability index, the study area was considered slightly more vulnerable in specific categories such as household composition, disability, minority status and language, and household type and transportation. Against the backdrop of the study area having relatively low overall social vulnerability, addressing the issue of underinsurance and advocating for property owners to seek insurance policies, especially those living in wildfire-prone areas, will be critical for wildfire preparedness measures henceforth.
Regarding research question 2, opportunities to publicize existing geospatial data about wildfire risk and exposure abound, to educate people about their own wildfire risk. The exposure data from Scott, Brough, et al. (2022) and Scott, Gilbertson-Day, et al., (2022) used in this study pre-dated the Marshall Fire. In other words, wildfire-prone areas were documented and known. One clear risk factor identified by this study is that houses in low to moderate exposure areas burned, meaning that a house might only need to be adjacent to a high-exposure area to be seriously affected by wildfire. The geospatial methodology for calculating a community’s exposure to wildfire risk, presented by Scott, Gilbertson-Day, et al. (2020), takes into consideration the adjacency of buildings to wildland vegetation as well as other buildings. Emergency managers and disaster recovery planners would benefit from better leveraging this existing data to plan for where wildfires are likely to cause the most impact (i.e., areas with dense development as well as wildland vegetation).
Regarding research question 3, which addresses long-term recovery planning and climate change adaptation strategies, a number of planning incentives might be put in place to encourage building back in a way that protects human, built, and natural environments from wildfire risk. Incentives should include long-term climate change adaptation in addition to climate change mitigation. Mitigation strategies may include grass fire breaks, fire resistant building and landscaping materials, and yard hydrants. Adaptation strategies may include adjustment of building codes, land use planning that comprehensively considers wildfire risk, and relocation of buildings and structures outside of high-risk zones. Expedited permitting processes may also allow homeowners to build back faster and return to Boulder County if the disaster caused them to relocate.
Our research team also gleaned lessons learned from the methodological approach to answering the above research questions. This study combined social vulnerability data, 360-degree and GSV imagery, and qualitative interview data to conduct an integrated damage assessment of the 2021 Marshall Fire. We call for more case studies of this methodology, generated and improved upon with a few considerations in mind. From a technological standpoint, improvement of spatial resolution, accuracy, precision, and reliability metrics to assess level of error and confidence in 360-degree imagery would greatly help researchers develop better methodologies and analyses. In future extensions of this work, machine learning methods paired with 360-degree imagery can automate the damage assessment process. Integrated data sources can and should also be made interoperable with geospatial decision support platforms (e.g., the Federal Emergency Management Agency Resilience Analysis and Planning Tool and HAZUS and the Pacific Disaster Center DisasterAWARE). More systematic inclusion of qualitative data could be considered to highlight human impacts and socioeconomic losses from disasters.
The research team is affiliated with the NDPTC at the University of Hawaii, which offers training for first responders, emergency managers, and community resilience organizations on leveraging tools to conduct damage assessment (NDPTC, 2022a45), debris management (NDPTC, 2022b46), and community planning for disaster recovery (NDPTC, 2022c47). The center is actively exploring ways to integrate qualitative data into technologically driven damage assessment methodologies. A recent collaboration between NDPTC and the University of Michigan Taubman College of Architecture and Planning yielded several white papers elaborating on topics such as social bias in machine learning algorithms for imagery analysis (Fitzgerald et al., 202248); usage of social media data for damage assessment (Pritchard et al., 202249); and integration of community network analysis (Dixon et al., 202250). The integrated methodology here can be used in its current state and improved upon in future iterations for mitigation, adaptation, and recovery planning for wildfire.
Conclusions
Unfortunately, wildfires such as the Marshall Fire are likely to occur again. There is a need to improve capabilities and to use data to support recovery operations and longer-term planning and community engagement (Kim & Olshansky, 2015). The study connects research to actionable steps toward reducing wildfire risk for communities at risk. Investing in safe, non-invasive damage assessment procedures can be beneficial during disaster recovery and within the context of COVID-19 exposure. The use of satellite and 360-degree GSV imagery, along with platforms like Zoom, allowed for our team to gather perishable damage assessment data with limited travel and exposure. Conducting interviews remotely with select individuals affected by the Marshall Fire, as well as working through community gatekeepers, allowed our research team to respectfully avoid overburdening emergency managers and community leaders actively engaged in disaster response and recovery. Other damage assessment teams might employ these methods when risk of exposure for those conducting the assessment is high, and if comparing before-and-after imagery is beneficial to recovery planning or memorializing loss. Ultimately, this study advances the concept of integrating diverse sources of data to support recovery planning and adaptation to wildfire risks.
References
-
Ager, A. A., Day, M. A., Alcasena, F. J., Evers, C. R., Short, K. C., & Grenfell, I. (2021). Predicting Paradise: Modeling Future Wildfire Disasters in the Western U.S. Science of the Total Environment, 784, 147057. ↩
-
Chileen, B., McLauchlan, K. K., Higuera, P. E., Parish, M., & Shuman, B. N.. (2020). Vegetation Response to Wildfire and Climate Forcing in a Rocky Mountain Lodgepole Pine Forest Over the Past 2500 Years. The Holocene, 30(11), 1493-1503. https://doi.org/10.1177/0959683620941068 ↩
-
Thomas, D., Butry, D., Gilbert, S., Webb, D., & Fung, J. (2017). The Costs and Losses of Wildfires: A Literature Review. NIST Special Publication1215. National Institute of Standards and Technology, U.S. Department of Commerce. https://nvlpubs.nist.gov/nistpubs/SpecialPublications/NIST.SP.1215.pdf ↩
-
Brocato, B. (2021). Texas Wildfire Survivors’ Narratives and the Meaning of Everyday Objects. Ethnography. https://doi.org/10.1177/14661381211038304 ↩
-
Montesanti, S., Fitzpatrick, K., Azimi, T., McGee, T., Fayant, B., & Albert L. (2021). Exploring Indigenous Ways of Coping After a Wildfire Disaster in Northern Alberta, Canada. Qualitative Health Research, 31(8), 1472-1485. ↩
-
Boulder Office of Emergency Management. (2021, December 30). The Boulder Emergency Operations Center (EOC) has been activated to respond to multiple wildland fires in Boulder County. https://www.boulderoem.com/the-boulder-emergency-operations-center-eoc-has-been-activated-to-respond-to-multiple-wildland-fires-in-boulder-county/ ↩
-
Boulder Office of Emergency Management. (2022, June). Marshall Fire Operational After-Action Report (AAR). https://www.superiorcolorado.gov/home/showdocument?id=20708&t=637908398510628002 ↩
-
Colorado Division of Homeland Security and Emergency Management. (n.d.). DR4634 Boulder Fires and Straight Line Winds. Retrieved October 17, 2022, from https://mars.colorado.gov/MarshallFire ↩
-
National Weather Service. (n.d.). Denver's Latest First Snow Dates and Consecutive Non-Measurable Snow Days. Retrieved October 1, 2022, fromhttps://www.weather.gov/bou/DenverSnowLessStreaks ↩
-
Colorado State Forest Service. (n.d.). Colorado’s Forests in a Changing Climate. Retrieved October 4, 2022, from https://csfs.colostate.edu/colorados-forests-changing-climate/ ↩
-
Bermel, C. (2021, August 6). Dixie Fire becomes largest single wildfire in California history. Politico. https://www.politico.com/states/california/story/2021/08/06/dixie-fire-becomes-largest-single-wildfire-in-california-history-1389651 ↩
-
Touma, D., Stevenson, S., Swain, D. L., Singh, D., Kalashnikov, D. A., & Huang, X. (2022). Climate change increases risk of extreme rainfall following wildfire in the western United States. Science advances, 8(13), eabm0320. ↩
-
Berke, P., & Godschalk, D. (2009). Searching for the Good Plan: A Meta-analysis of Plan Quality Studies. Journal of Planning Literature, 20 (3), 227-240. ↩
-
Berke, P., Smith, G., & Lyles, W. (2012) Planning for Resiliency: Evaluation of State Hazard Mitigation Plans Under the Disaster Mitigation Act. Natural Hazards Review, 13(2), 139-149. ↩
-
Kim, K., & Olshansky, R.B. (2015). The Theory and Practice of Building Back Better. Journal of the American Planning Association, 80(4), 289-292. ↩
-
Kim, K. et al. (in press). Equity, Participation, and Planning for Recovery in Puerto Rico. Journal of Emergency Management. ↩
-
Wyte-Lake, T., Claver, M., Johnson-Koenke, R., & Dobalian, A. (2019). Home-based primary care’s role in supporting the older old during wildfires. Journal of Primary Care and Community Health, 10. ↩
-
Govil, K., Welch, M. L., Ball, J. T., & Pennypacker, C. R. (2020). Preliminary results from a wildfire detection system using deep learning on remote camera images. Remote Sensing, 12, 166. https://doi:10.3390/rs12010166 ↩
-
Palaiologou, P., Ager, A. A., Nielsen-Pincus, M., Evers, C. R., & Day, M. A. (2019). Social vulnerability to large wildfires in the western USA. Landscape and Urban Planning, 189, 99-116. ↩
-
Paveglio, T. B., Prato, T., Edgeley, C., & Nalle, D. (2016). Evaluating the characteristics of social vulnerability to wildfire: demographics, perceptions, and parcel characteristics. Environmental Management, 58(3), 534-548. ↩
-
Paveglio, T. B., Edgeley, C. M., & Stasiewicz, A. M. (2018). Assessing influences on social vulnerability to wildfire using surveys, spatial data and wildfire simulations. Journal of Environmental Management, 213, 425-439. ↩
-
Rashkovetsky, D., Mauracher, F., Langer, M., & Schmitt, M. (2021). Wildfire detection from multisensory satellite imagery using deep semantic segmentation. IEEE Journal of Selected Topics in Applied Earth Observations and Remote Sensing, 14, 7001-7016. ↩
-
Wigtil, G., Hammer, R. B., Kline, J. D., Mockrin, M. H., Stewart, S. I., Roper, D., & Radeloff, V. C. (2016). Places where wildfire potential and social vulnerability coincide in the coterminous United States. International Journal of Wildland Fire, 25(8), 896-908. ↩
-
Kijewski-Correa, T., Roueche, D., Kennedy, A., Allen, D., Marshall, J., Kaihatu, J., Wood, R. L., Smith, D. J., Lester, H., Lochhhead, M., Copp, A., McCarthy, A., Prevatt, D. O., & Robertson, I. (2021). Impacts of Hurricane Dorian on the Bahamas: Field Observations of Hazard Intensity and Performance of the Built Environment. Coastal Engineering Journal, 1-21. https://doi.org/10.1080/21664250.2021.1958613 ↩
-
Kim, K., & Davidson, J. (2015). Unmanned aircraft systems used for disaster management. Transportation Research Record, 2532(1), 83-90. ↩
-
Duan, R., Hepworth, K., Ormeroo, J., & Chelsea, C. (2021). Promoting Concern for Climate Change: A Study of Wildfire Photographs Using Q Methodology. Science Communication. https://doi.org/10.1177/1075547021104141689 ↩
-
Yu, N. & Atkinson, L. (2022). The Role of 360-Degree Videos in Wildfire Preparedness. Natural Hazards Center Weather Ready Report Series, 6. https://hazards.colorado.edu/weather-ready-research/the-role-of-360-degree-videos-in-wildfire-preparedness ↩
-
Crow, D. A., Berggren, J., Lawhon, L. A., Koebele, E. A., Kroepsch, A., & Huda, J. (2017). Local media coverage of wildfire disasters: An analysis of problems and solutions in policy narratives. Environment and Planning C: Politics and Space, 35(5), 849-871. ↩
-
Centers for Disease Control and Prevention. (2018). CDC/ATSDR Social Vulnerability Index 2018 Database Colorado. Agency for Toxic Substances and Disease Registry, Geospatial Research, Analysis, and Services Program. https://www.atsdr.cdc.gov/placeandhealth/svi/data_documentation_download.html ↩
-
Flanagan, B. E., Gregory, E. W., Hallisey, E. J., Heitgerd, J. L., & Lewis, B. (2011). A social vulnerability index for disaster management. Journal of Homeland Security and Emergency Management, 8(1). ↩
-
Scott, J. H., Brough, A. M., Gilbertson-Day, J. W., Dillon, G. K., & Moran, C. (2020a). Wildfire Risk to Communities: Spatial datasets of landscape-wide wildfire risk components for the United States. Forest Service Research Data Archive. https://doi.org/10.2737/RDS-2020-001 ↩
-
Scott, J. H., Gilbertson-Day, J. W., Moran, C., Dillon, G. K., Short, K. C., & Volger, K. C. (2020b). Wildfire Risk to Communities: Methods for geospatial datasets for populated areas in the United States. Forest Service Research Data Archive. https://doi.org/10.2737/RDS-2020-0016 ↩
-
Site Tour 360. (2020a). 360 Imagery Collection and Visualization of Tornado Damage in Monroe, Louisiana. https://bit.ly/3jUIElM ↩
-
Site Tour 360. (2020b). 360 Imagery Collection and Visualization of Hurricane Laura Damage in Lake Charles, Louisiana. https://www.sitetour360.com/ndptc/#node10116,0,0,70,4 ↩
-
Site Tour 360. (2018). 360 Imagery Collection and Visualization of 2018 Flood in Kauai, Hawaii. https://bit.ly/3bj2aY1 ↩
-
Site Tour 360. (2019). 360 Imagery Collection and Visualization of Hurricane Dorian in the Bahamas. https://bit.ly/2Hd492L ↩
-
U.S. Census Bureau. (2020). 2020 Census. https://www.census.gov/programs-surveys/decennial-census/decade/2020/2020-census-main.html ↩
-
National Disaster Preparedness Training Center. (2022d). 2021 Marshall Fire: Using NDPTC’s Rapid Integrated Damage Assessment (RIDA) to demonstrate new technological approaches to understanding wildfire impacts. ArcGIS StoryMap. https://storymaps.arcgis.com/stories/30a5f0e57a354d7cb7ad5bbad170ebc4 ↩
-
Blanke, S., & McGrady, E. (2011). From Hot Ashes to a Cool Recovery: Reducing Risk by Acting on Business Continuity and Disaster Recovery Lessons Learned. Home Health Care Management and Practice. https://doi.org/10.1177/1084822311425537 ↩
-
Easthope, L., & Mort, M. (2014). Technologies of Recovery: Plans, Practices and Entangled Politics in Disaster. The Sociological Review. https://doi.org/10.1111/1467-954X.12127 ↩
-
Colorado Division of Regulatory Agencies Division of Insurance. (2022). Division of Insurance Releases Initial Estimates of Underinsurance for Homes in the Marshall Fire. Press release. https://content.govdelivery.com/accounts/CODORA/bulletins/314b1a4 ↩
-
City of Denver. (n.d.). Denver Open Data Catalog: County Boundary. Retrieved October 7, 2022, from https://www.denvergov.org/opendata/dataset/city-and-county-of-denver-county-boundary ↩
-
Colorado Disaster Preparedness & Recovery Resources, SB22-206, 73rd Colorado General Assembly (2022). https://leg.colorado.gov/bills/sb22-206 ↩
-
Boulder County. (n.d.). Marshall Fire Recovery. Retrieved October 4, 2022, from https://bouldercounty.gov/disasters/wildfires/marshall/#1643999111899-9f42841f-3616 ↩
-
National Disaster Preparedness Training Center. (2022a). Leveraging Tools for Conducting Damage Assessments (AWR-310). https://ndptc.hawaii.edu/training/catalog/18/#course-description ↩
-
National Disaster Preparedness Training Center. (2022b). Planning for Disaster Debris Management (MGT-460). https://ndptc.hawaii.edu/training/catalog/47/#course-description ↩
-
National Disaster Preparedness Training Center. (2022c). Community Planning for Disaster Recovery (AWR-356). https://ndptc.hawaii.edu/training/catalog/22/#course-description ↩
-
Fitzgerald, K., Pritchard, J., & Steward, D. (2022). Social Bias: Machine Learning and Early Recovery. No. 2 in White Paper Series: Aerial Assessment. Rising Above the Deluge: University of Michigan Spring 2022 Capstone Course. https://pdfhost.io/v/ViiVtJXI8_Chapter_2_Social_Bias_in_Machine_Learning ↩
-
Pritchard, J. Steward, & D. Fitzgerald, K. (2022). Cutting the Code: Accessible Machine Learning. No. 3 in White Paper Series: Aerial Assessment. Rising Above the Deluge: University of Michigan Spring 2022 Capstone Course. https://pdfhost.io/v/TzyI1WCDa_Chapter_3_Cutting_the_Code ↩
-
Dixon, J., Haadsma, & J., Svoboda, R. (2022). Damage Assessment Through Aerial Imagery: A Deep Learning Approach in Disaster Recovery. No. 4 in White Paper Series: Aerial Assessment. Rising Above the Deluge: University of Michigan Spring 2022 Capstone Course. https://pdfhost.io/v/e4Nglyzjy_Chapter_4_Aerial_Damage_Assessment ↩
Kim, K., Bui, L., Yamashita, E., Vorce, M., Webster, L., & Marasco, D. (2022). The 2021 Marshall Fire: Rapid Integrated Damage Assessment (Natural Hazards Center Quick Response Research Report Series, Report 350). Natural Hazards Center, University of Colorado Boulder. https://hazards.colorado.edu/quick-response-report/the-2021-marshall-fire