Survey of Evacuation Behavior in the 2021 Marshall Fire, Colorado
Publication Date: 2022
Abstract
Climate change is increasing the threat of wildfires to urban areas, especially those within the wildland-urban interface (WUI). The 2021 Marshall Fire forced the evacuation of 30,000 people and destroyed over 1,000 structures within Boulder County, Colorado. We conducted a survey with households affected by the grass fire to analyze their evacuation decision-making and travel behavior. The survey was based on previous surveys that members of our team developed to investigate the public response to the 2016 Chimney Tops 2 Fire in Tennessee and the 2019 Kincade Fire in California, but we have included new measures of transportation mode, route, and destination choices made by evacuees. We used linear and logistic regression models to determine the factors that influenced resident risk perception and the decision to evacuate and compared results from our analysis to the previous studies. We found significant variability in the factors that influenced risk perception and evacuation decisions across the three fires. The report also presents descriptive statistics to summarize our findings on evacuee travel behavior during the Marshall Fire.
Introduction
The Marshall Fire ignited at 11:00 a.m. on December 30, 2021, and spread across the suburban communities of Louisville, Superior, Broomfield, Boulder, Westminster, Lafayette, Arvada, and unincorporated Boulder County, Colorado. The destructive nature of the fire was a result of high winds of upwards of 100 mph and long-term drought, (Bontke, 20221). The accumulation of dry fuels in the area also allowed the fire to spread rapidly. The state of Colorado experiences wildfires regularly; however, climate change lengthened the fire season and caused the fires to occur outside of their usual range, with more fires affecting urban and suburban areas (Sullivan, 20222). The Marshall Fire follows the recent trend of wildfires occurring during extreme weather conditions, resulting in highly dangerous fires and devastating consequences (Kramer et al., 20183).
Wildfire is a growing global concern for rural, suburban, and urban fringe areas given the ongoing changes in climate and the increase in populated areas at the wildland-urban interface (Radeloff et al., 20184). In the United States alone, 4.5 million homes are in areas identified as being at high or extreme wildfire risk (Verisk Analytics, 20215; Comfort, 20196). During wildfire events in the US, the common policy for the protection of life is to evacuate households before conditions become untenable. To inform evacuation planning, real-time decision-making requires empirical data on household evacuation behavior during wildfire emergencies. Without a more comprehensive understanding of evacuation behavior, planners and officials rely on past experiences, which is potentially problematic in locations unfamiliar with fires, such as suburban or urban-fringe areas.
As wildfires increase in frequency and intensity, there is a growing research interest in studying household evacuation behavior during wildfire events. While studies on the decision to evacuate or to stay are plentiful, less knowledge is available regarding people’s mode, route, and destination choices during WUI wildfire events (Kuligowski, 20217). It is essential to further understand evacuation movement behaviors with the rapid onset of fires, as seen with the Marshall Fire, to facilitate evacuation procedures and to provide relevant recommendations to officials for future wildfire events. Additionally, it is important to assess the efficacy of relaying evacuation warnings and orders to residents by emergency officials.
Considering the above discussions, our team conducted an online survey with households affected by the 2021 Marshall Fire, focusing on their evacuation behavior and decision-making. Our survey uses the ones developed to investigate public response to the 2016 Chimney Tops 2 Fire in Tennessee (Kuligowski et al., 20208) and the 2019 Kincade Fire in California (Kuligowski et al., 20219) as a basis for analysis. This study expands on previous surveys, adding new questions on transportation mode, route, and destination choices made by evacuees.
Literature Review
Most existing studies on wildfire evacuation behavior have focused on the factors that influence the decision to evacuate or stay (Kuligowski, 2021). These studies have taken place predominately in Australia (McLennan et al., 201310; Strahan & Watson, 201911; Whittaker et al., 202012) or the United States (Kuligowski et al., 2022; McCaffrey et al., 201813; Mozumder et al., 200814; Wong et al., 202215), although not exclusively (Toledo et al., 201816). This previous research found such factors as preparation actions; warnings and cues; experience and knowledge; and demographics as influential on the decision to evacuate (Folk et al., 201917; Lovreglio et al., 201918). Many of these studies used the Protective Action Decision Model, which outlines a decision-making process whereby threat and risk perceptions are key predictors of evacuation decisions (Lindell & Perry, 201219). While studies showed a strong link between risk perceptions and the decision to evacuate (McLennan et al., 201520; Strawderman et al., 201221), few studies have explored the factors that influence these perceptions themselves (Kuligowski et al., 2020).
Additionally, these U.S.-based studies of wildfire evacuation often occurred within smaller, rural communities, since fires are historically more prevalent in these areas. However, more recent work by this research team and others (Comfort et al., 2019; Wong et al., 2022) explored evacuation behavior from regional towns and cities during fire events. Using the same survey, we studied two regional semi-urban areas affected by fire. The first study took place in a regional town in Tennessee whose residents had relatively limited experience with fire prior to the 2016 Chimney Tops 2 Fire in Gatlinburg, Tennessee (Kuligowski et al., 2020). The second study was based in a regional city in California whose residents were relatively experienced and knowledgeable about fire prior to the 2019 Kincade Fire in Sonoma County, California (Kuligowski et al., 2022). Especially with differing fire conditions, it was no surprise that evacuation behavior was different across the two fire events. We argue that it is of interest to also study evacuation behavior of households located in suburban or urban-fringe areas.
Additionally, fewer studies have focused on evacuee behaviors performed post-stay/go decisions; for example, examining mode, routing, and destination choices. Most of the studies of evacuation travel behavior in the US centered on hurricane disasters (e.g., Hasan et al., 201122; Huang et al., 201623), with some researchers beginning to focus attention on wildfire evacuation—an important, yet neglected phenomena (Brachman et al., 202024; Wong et al., 2020). Hurricane studies have shown that households are likely to engage in behaviors that could potentially delay their escape from harm, including taking longer routes and traveling to non-evacuation related destinations within the affected area (e.g., to pick up family members) before moving to safety, also known as intermediate trips. Since similar behaviors are likely during wildfires, it is essential that researchers further explore these decisions as they are vital to improved evacuation planning and real-time decision-making.
Research Design
Research Questions
This study addressed three research questions:
- How did households located in the impacted areas of the Marshall Fire perceive risk and what decisions did they make regarding whether to evacuate?
- For evacuees, what decisions did they make regarding departure timing, travel mode, evacuation route, and evacuation destination?
- What factors influenced household risk perception and evacuation decision?
To answer these three research questions, we conducted a survey to understand household evacuation decision-making during the Marshall Fire in and around Boulder County, Colorado. This report summarizes the main findings regarding household risk perception, evacuation decision-making (evacuation decision, preparation time, and departure time), and travel decisions (destination choice, mode choice, route choice) during the Marshall Fire. We will also compare results across three fires (2016 Chimney Fire, 2019 Kincade Fire, and 2021 Marshall Fire) regarding the factors that shaped risk perception and evacuation decision-making.
Study Site Description
The Marshall Fire started on December 30, 2021, and it spread rapidly before being largely extinguished on the night of December 31, 2021. The Marshall Fire was the most destructive fire in Colorado history, surpassing and doubling the number of destroyed residences by the 2013 Black Forest Fire, which destroyed 489 homes (Vo et al., 202225). The wildfire burned over 6,200 acres and destroyed over 1,000 structures located in the City of Louisville, the Town of Superior, and unincorporated Boulder County (Fischer, 202226). The estimated cost of the damage to residential structures within Boulder County is $513,212,589 (Boulder County, 202227). The fire also caused the deaths of two people (Zialcita, 202228) and the evacuation of around 30,000 people (Fischer, 2022). See Table A1 in the appendix for a summary of census data on the demographic and socioeconomic characteristics of the population in the area affected by the disaster.
Data, Methods, and Procedures
We conducted an online survey of residents who were impacted by the Marshall Fire between May 18, 2022, and June 12, 2022. Survey participants were recruited in two ways. First, we used social media posts (Twitter and Facebook groups) to publicize the survey and disseminate its availability among residents living in or close to the Marshall Fire perimeter through social media . The social media post stated, “Did you experience the 2021 Marshall Fire in Colorado? If so, please consider participating in a survey study that aims to understand people’s emergency responses during the fire. Qualified participants will receive a $10 Amazon gift card after completing the survey.” A link to a screening survey was provided as part of the social media post. Screening questions asked respondents to identify the zip code where they were located during the fire. Only those who provided a zip code within the impacted area (80027, 80303, 80021, 80007, 80026, and 80020) were invited for the survey.
We also used an online panel of respondents from Qualtrics to recruit additional survey participants. For the Qualtrics online panel, we paid $4,000 to the company to recruit respondents from 20 Zip Codes in or close to the impacted area of Marshall Fire.
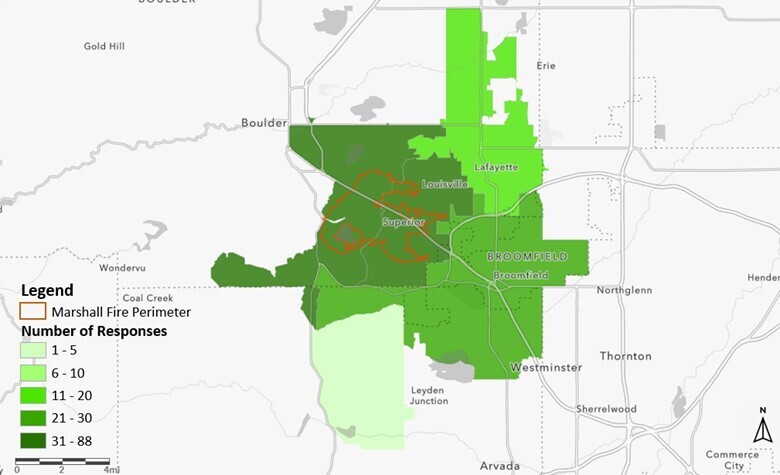
After a careful data cleaning process, we obtained a total of 294 valid responses (57 from social media and 237 from Qualtrics online panel). To produce a more accurate result of the evacuation behaviors of those most directly impacted by the fire, we further excluded individuals whose location was not within or directly adjacent to the evacuation warning or order zones, reducing the number of responses to 191. The study area and heat map of the survey responses are illustrated in Figure 1.
Figure 1. Study Area and Survey Response Distribution
Sampling and Participants
More than three-fifths of the respondents in the final sample self-identified as women (62%). The mean age of respondents was 38 years. Regarding education level, 17% of respondents had an associate degree, 27% had a bachelor’s degree, 22% had a graduate degree, and 21% had some college but no degree. In sum, nearly nine in 10 respondents had received some level of higher education. Most respondents identified their household income as $50,000-$74,999. Additionally, 82% were employed at the time of the Marshall Fire (including self-employment). Of all respondents, 24% had a medical condition or had someone in their household with a medical condition at the time of the fire. See Table A2 in the appendix for a summary of the descriptive statistics of the survey sample.
We further compared the sociodemographic profile of our survey sample with that of the populations in Louisville and Superior, where more than half of the respondents reside and most of the property damage occurred. Most survey respondents in our sample have a significantly lower median income than the $116,000 and $126,000 median household incomes for Louisville and Superior, respectively. However, our sample population is somewhat representative of the area’s racial makeup: 78% of our sample identified as white, closely resembling the 87.4% and 76.1% white in Louisville and Superior, respectively.
Data Analysis
After completing data collection and processing, we first conducted a descriptive analysis of the data to understand the evacuation process during the Marshall Fire. These descriptive statistics were then compared to the descriptive statistics from the 2016 Chimney Tops 2 Fire and the 2019 Kincade Fire (Kuligowski et al., 2020; Kuligowski et al., 2021). The findings on departure time and evacuation preparation time, along with destination choice, route choice, and mode choice, enrich the understanding of the evacuation behaviors and implementation of protective actions of people experiencing wildfires.
Based upon the survey data, we constructed a linear regression model to estimate risk perception at the time of evacuation decision and a logistic regression model to estimate the evacuation decision (yes/no). The same models were developed for the Chimney Tops 2 Fire and the Kincade Fire. To make the statistical results more comparable, we aimed to specify models for the Marshall Fire that included similar independent variables to those we included in our previous studies (especially the study of the Kincade Fire). We then compared the risk perception and evacuation decision models to the findings from the Chimney Tops 2 Fire and the Kincade Fire (Kuligowski et al., 2020; Kuligowski et al., 2021). We recognize that the large number of independent variables in our models relative to the number of respondents can lead to inflated bias in the coefficients. For the purposes of this analysis, we decided to sacrifice statistical robustness for model consistency and the ability to compare results across fire contexts. In future work, we will test a smaller set of independent variables to examine if the coefficient estimates are robust.
Ethical Considerations, Researcher Positionality, Reciprocity, and Other Considerations
The project received exempt approval from the University of Florida Institutional Review Board (#IRB201903432), and per this approval, all participants provided their consent before taking the survey.
Findings
Descriptive Analysis
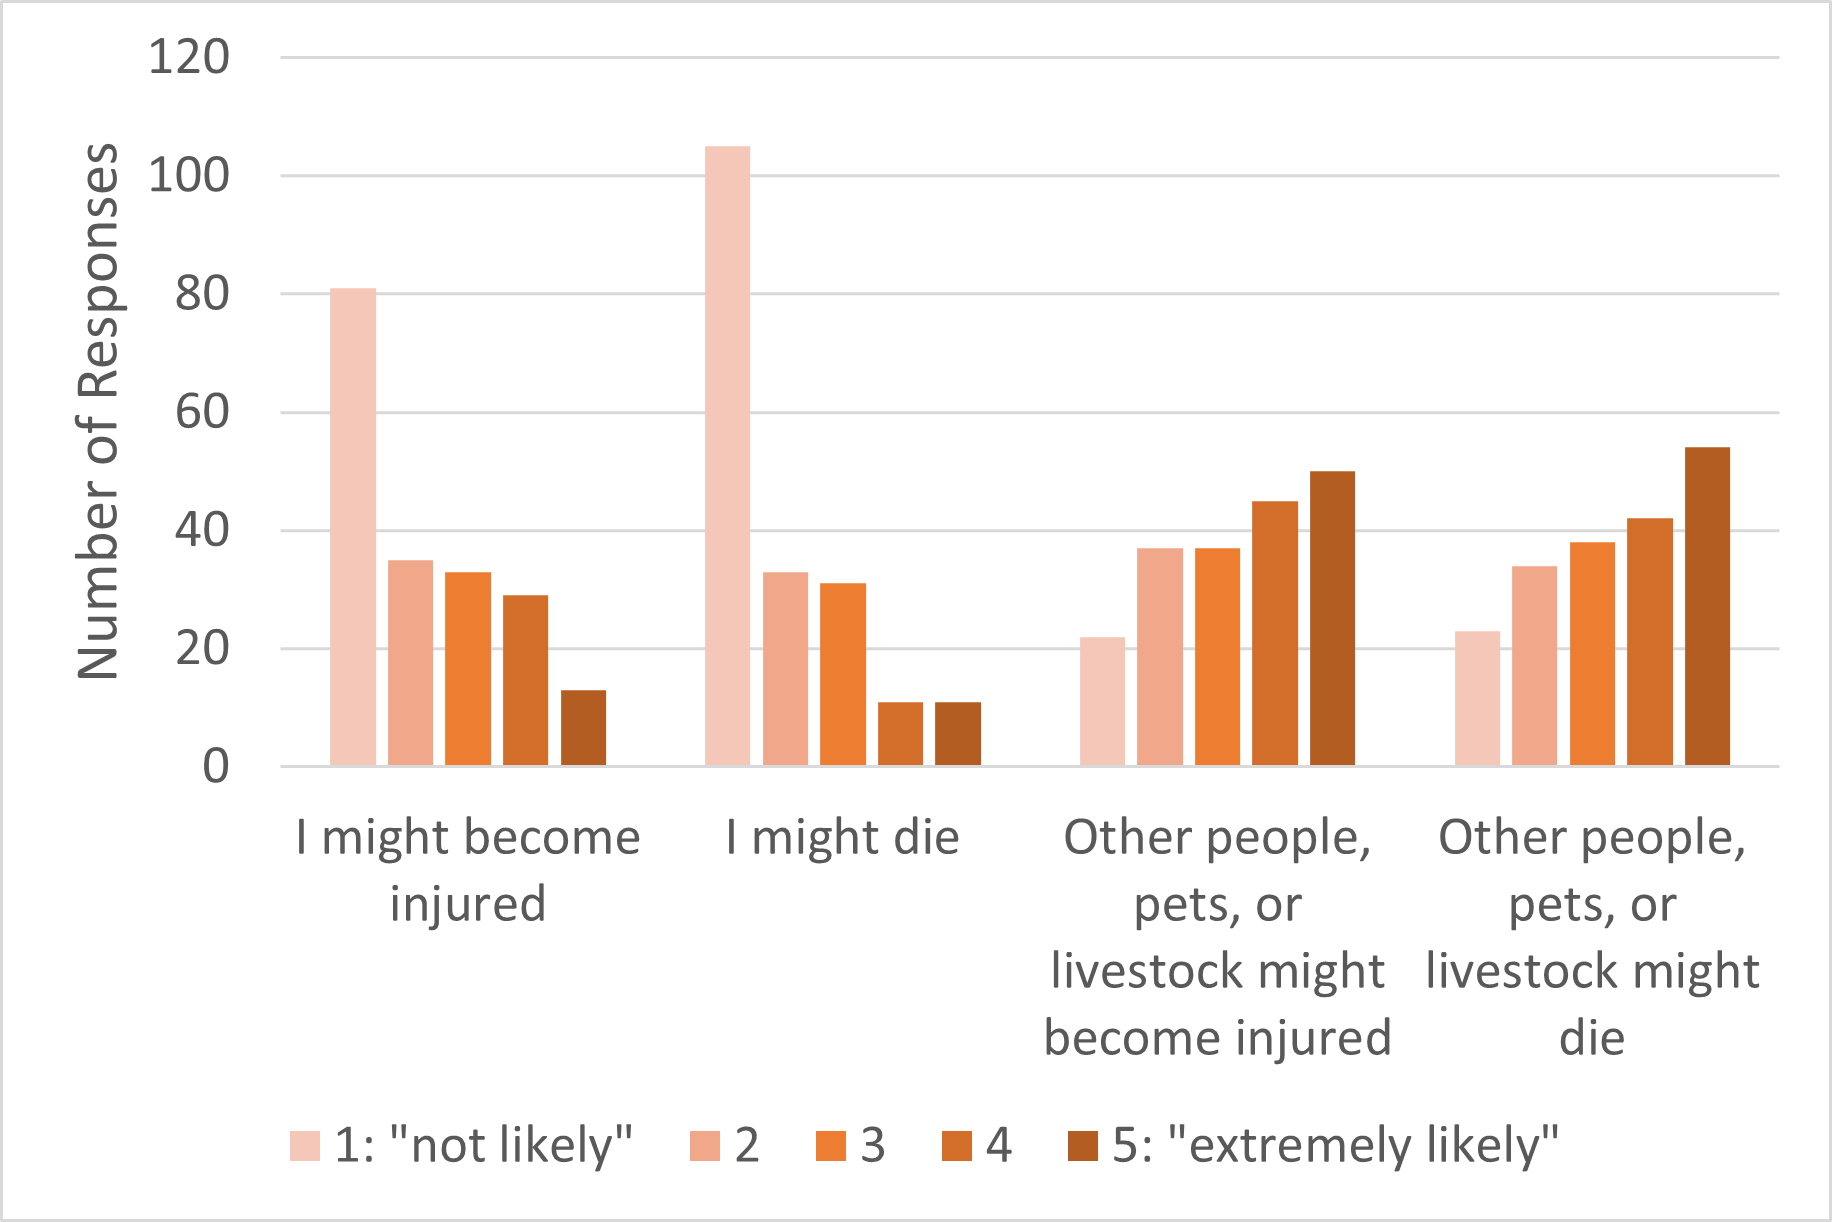
In order to assess resident risk perception at the time of evacuation decision, we asked survey respondents about what risk they believed the fire posed to their lives and that of their neighbors. More specifically, we asked respondents to rate on a scale of one to five (where one represents “not likely” and five represents “extremely likely”) how much they agreed with the following statements: “I might become injured,” “I might die,” “other people, pets, or livestock might become injured,” and “other people, pets, or livestock might die.” As depicted in Figure 2, Most respondents perceived that other people, pets, or livestock were more likely to become injured or die than themselves. Overall, respondents felt it was unlikely that they might personally be injured (42%) or die (55%) as a result of the fire. Conversely, more than one-quarter of respondents believed it was extremely likely that other people, pets, or livestock might be injured (26%) and die (28%). These results indicate respondents likely held biases that people often exhibit in crises. In this case, respondents exhibited optimism bias, whereby people believe that they themselves are less likely to experience negative consequences from the event when compared with others (Helweg-Larsen & Shepperd, 200129).
Figure 2. Frequency Distribution of Risk Perception Statements
When asking respondents if they perceived risk from wildfire, the data shows that approximately 65% of respondents realized that wildfires could be a problem in their community prior to the occurrence of the Marshall Fire. Respondents rated the possibility that a wildfire would threaten their property as unlikely (64%) and had no household emergency plan for wildfires in place (68%). Some respondents had not taken any measures to protect their residence from wildfires (38%). Of the 28% of respondents that had a household emergency plan in place before the fire, 93% of them planned to evacuate before the wildfire spread to their residence. Most respondents had little to no prior experience with wildfires before the Marshall Fire, with 37% having not experienced a wildfire before, 21% having experienced one fire, and 22% having experienced two fires. Additionally, 61% had never evacuated from a wildfire before.
During the fire, 65% of respondents received notice from emergency officials that their area was under an evacuation warning or order, or a pre-evacuation notice. Before the Marshall Fire, 53% of respondents were aware of their county’s warning system, 42% were registered for their county’s alerting service, and 41% had an app on their phone for receiving emergency alerts. Respondents reported that they first received these emergency notices from officials between the hours of 12:00 p.m. and 4:00 p.m. on December 30, 2021. Based on the respondent answers, the most common evacuation warning official channels were social media such as Twitter or Facebook, text message, loudspeaker, or public address system. Prior to deciding to evacuate or stay, 56% of respondents had someone they know tell them to evacuate, with the most common channels being face-to-face, telephone, and text message.
As depicted in Table 1, 52% of the evacuees (n=132) used one personal vehicle to evacuate their home. Meanwhile, 30% used two or more personal vehicles and seven percent evacuated with a recreational vehicle or truck with a trailer. Most respondents drove to another location prior to driving to their final evacuation destination, e.g., to reunite with and/or help others outside of family (25%); reunite with and/or help family members away from home (22%); pick up or attend to pets or livestock (18%); or purchase or pick up items to prepare the home or for evacuation (13%). The roads most frequently used to evacuate were the Denver-Boulder Turnpike (18%) and Highway 287 (13%). The destinations most often chosen for safety included a friend’s or family’s residence, a hotel or motel, or public shelter.
Table 1. Transportation Decisions Made by Evacuees in the Survey Sample
| Variable | Description | Percentage |
| Modes of Transportation | One Personal Vehicle | 52.25 |
| Two or More Personal Vehicles | 30.32 | |
| Recreational Vehicle or Truck with Trailer | 7.74 | |
| Uber or Lyft | 3.23 | |
| Rental Car | 2.58 | |
| Public Transit | 1.94 | |
| Non-household Carpool | 1.29 | |
| Paratransit or Other Accessible Transportation Services | 0.65 | |
| Trips made prior to evacuation | Reunited with and/or Helped Family Members Away from Home | 20.86 |
| Reunited with and/or Helped Others Outside of Family | 25.18 | |
| Picked Up or Attended to Pets or Livestock | 15.11 | |
| Purchased or Picked Up Items to Prepare the Home or to Prepare for Evacuation | 13.67 | |
| Other | 6.47 | |
| Don’t Know or Don’t Recall | 18.71 | |
| Route Choice | Denver-Boulder Turnpike | 13.64 |
| Highway 470 | 7.95 | |
| Highway 128 | 11.36 | |
| Highway 72 | 7.39 | |
| Highway 93 | 11.36 | |
| Highway 42 | 11.36 | |
| Highway 287 | 12.5 | |
| Highway 121 | 3.98 | |
| None of the Above | 5.68 | |
| Other | 14.77 | |
| Destination Choice | Friend or family home | 45.76 |
| Hotel or Motel | 19.77 | |
| Park or Campground | 7.34 | |
| Parking Lot | 6.21 | |
| Public Shelter | 8.47 | |
| Public Building or Office Building | 2.26 | |
| Restaurant, Shopping Mall, or Other Store | 4.52 | |
| Other | 5.65 |
Linear and Logistic Regression Model Results
As shown in the last column of Table 2, the linear regression model yielded multiple variables with a significant value for the Marshall Fire. The following variables were significant predictors of risk perception: having a medical condition, observing fire cues (flames or embers), household income of $50,000 to $99,999, and wildfire risk perception before the Marshall Fire.
Table 2. Comparison of Linear Regression Results for Risk Perception
Tops 2 Fire |
||||||
| (Intercept) | ||||||
| Prior awareness | ||||||
| Residence: Less than 5 years a | ||||||
| Residence: 10 or more years | ||||||
| Own home | ||||||
| Detached Home | ||||||
| Multi-Family Home | ||||||
| Mobile Home | ||||||
| Pre-Fire Perception of Safety b | ||||||
| Wildfire Risk Perception c | ||||||
| No. of Adults | ||||||
| Animals (yes) | ||||||
| Income: $25,000 - $49,999 | ||||||
| Income: $50,000 - $74,999 | ||||||
| Income: $75,000 - $99,999 | ||||||
| Income: $100,000 - $124,999 | ||||||
| Income: $125,000 - $149,999 | ||||||
| Income: $150,000 - $174,999 | ||||||
| Income: More than $100,000 | ||||||
| Income: More than $175,000 | ||||||
| Education: Bachelor | ||||||
| Education: Graduate | ||||||
| Medical Condition (yes) | ||||||
| Order: Official/Unofficial Source | ||||||
| Fire Cues | ||||||
| Fire Cues—Flames or Embers | ||||||
| Fire Cues—Smoke | ||||||
| Threat Assessment | ||||||
R2=0.186 |
R2=0.263 |
R2=0.243 |
||||
As depicted in Table 3, the binary logistic regression for the Marshall Fire yielded multiple variables that were significant (p-value<0.05) or marginally significant (p-value<0.1) in determining evacuation decision. Due to a small survey sample size, in this report we use the threshold of p-value smaller than 0.1 to determine statistical significance. The variables that were significant in respondent decisions to evacuate include wildfire risk perception, having children, and an income range of $75,000 to $99,999. These variables were found to be significant in increasing the likelihood that the respondent evacuated. Prior awareness of wildfire hazards was also significant in evacuation decision-making, but this is linked with a higher likelihood of respondents choosing to stay. The variables that were marginally significant in respondent decisions to evacuate were having an income from $100,000 to $124,999, being aged 55 to 64 years old, and observing fire cues.
Table 3. Comparison of Logistic Regression Results for Evacuation Decision
Tops 2 Fire |
||||||
| (Intercept) | ||||||
| Prior awareness | ||||||
| Preparation | ||||||
| Emergency Plan | ||||||
| Residence: Less than 5 years a | ||||||
| Residence: 10 or more years | ||||||
| Own home | ||||||
| Detached Home | ||||||
| Multi-Family Home | ||||||
| Mobile Home | ||||||
| Pre-Fire Perception of Safety b | ||||||
| Wildfire Risk Perception c | ||||||
| Children (yes) | ||||||
| No. of Adults | ||||||
| Animals (yes) | ||||||
| Income: $25,000 - $49,999 | ||||||
| Income: $50,000 - $74,999 | ||||||
| Income: $75,000 - $99,999 | ||||||
| Income: $100,000 - $124,999 | ||||||
| Income: $125,000 - $149,999 | ||||||
| Income: $150,000 - $174,999 | ||||||
| Income: More than $100,000 | ||||||
| Income: More than $175,000 | ||||||
| Age: 45 – 54 years | ||||||
| Age: 55 – 64 years | ||||||
| Age: Over 65 years | ||||||
| Gender (female) | ||||||
| Education: Bachelor | ||||||
| Education: Graduate | ||||||
| Medical Condition (yes) | ||||||
| Order: Official/Unofficial Source | ||||||
| Order: In Person | ||||||
| Fire Cues | ||||||
| Fire Cues—Flames or Embers | ||||||
| Fire Cues—Smoke | ||||||
| Risk Perception | ||||||
Comparison Across Three Fires
Respondents from the Marshall Fire had greater awareness and took more protective measures for wildfires than those from the 2016 Chimney Tops 2 Fire, but had less awareness of, had taken fewer protective measures, and had less experience with wildfires than respondents involved in the 2019 Kincade Fire. A higher percentage of respondents received official notices, warnings, and evacuation orders for the Kincade Fire when compared with the Marshall and the Chimney Tops 2 fires.
When comparing the linear regression results across all three fires, the variables identified as significant are different in each case. There are, however, trends across two of the three fires for certain variables. Both the Kincade and Marshall fires identified household income in the range of $50,000 to $74,999 as a significant predictor of increased levels of risk perception. Additionally, fire cues were significantly associated with higher levels of risk perception in the Marshall and Chimney Tops 2 fires. Results from the Kincade and Chimney Tops 2 fires linked graduate level education either as significant or marginally significant with an increased level of risk perception.
Similarly, when comparing the logistic regression results across the three fires, the variables identified as significant are different in each case. Results from both the Kincade and Marshall fires identified fire cues as a marginally significant predictor of the evacuation decision; however, the relationship was negative in the Kincade Fire and positive in the Marshall Fire. The main reason posited for this difference is that respondents who observed fire cues were those who had already decided to stay in the Kincade Fire, while the Marshall Fire respondents likely used fire cues as a prompt to leave (which is aligned with previous fire research, e.g., McCaffrey et al., 2018). There were no variables that were both significant or marginally significant for the Chimney Tops 2 and Marshall fires. It is notable that risk perception was not an influential predictor of the decision to evacuation in the Marshall fire, which counters findings from many fire studies (e.g., Wong et al., 2020), including the Chimney Tops 2 and Kincade fires (Kuligowski et al., 2020; Kuligowski et al., 2021). This finding and others will be further explored as a next step in this research study.
Conclusions
In this study, we conducted a web-based survey in areas in and around Boulder County, Colorado to collect data on people’s evacuation behavior during the 2021 Marshall Fire. Findings from the descriptive analysis, linear regression, and logistic regression assist in understanding evacuation behavior from the Marshall Fire. Additionally, we conducted a comparison of results from regression models across three fires (2016 Chimney Tops 2 Fire, 2019 Kincade Fire, and 2021 Marshall Fire).
The risk perception and evacuation decisions across the three wildfire contexts show more variability in findings than commonalities in factors that were significant in influencing risk perception and decision-making. These differences reflect the differences in population, geographic context, and wildfire context for each wildfire event. These findings also reflect the importance of studying additional fires using a standardized survey or other data collection instrument to allow for comparison across a range of fires.
For the Marshall Fire, the need for intermediate trips, vehicle ownership, and major road access all influenced evacuation behaviors pertaining to travel mode, route, and destination. Before evacuating, most respondents drove to a secondary location to reunite with family or friends, tend to pets or livestock, or purchase supplies. These additional trips contribute to the background traffic that increased evacuation clearance time. Many respondents used personal vehicles to evacuate and used a major road as their evacuation route. There was more variability in destination choice, but most respondents went to a friend’s or family member’s residence. These findings show that evacuation behavior is likely to include the presence of intermediate trips, people evacuating using personal vehicles, using a major road, and a familiar destination. It is important to verify these findings with further research and survey studies including questions on mode, route, and destination choices for other wildfire events.
A major limitation of this study is that the sample size was relatively small (the number of respondents who was within or directly adjacent to the evacuation zones was 191) and that the sample is not representative of the population in the study area. The survey bots issue made it challenging to obtain reliable responses from social media. Moreover, while we have added some travel-related questions to the survey, due to survey length considerations we did not collect detailed information regarding the sequence and timing of intermediate trips made by survey respondents. Future work may address this limitation by coupling the analysis of survey data with smartphone-based GPS data that record the movement of individuals with high spatiotemporal precision.
The results and findings of this study can provide new empirical evidence to support and improve wildfire evacuation planning and real-time decision-making in future fires. Future work may integrate these results with evacuation simulation models to generate more accurate and realistic simulation outputs. Future research may also uses emerging artificial intelligence and machine learning technologies to improve the modeling of human behavior in wildfires (Zhao et al., 202130). The findings of this study can also inform local entities that send out evacuation warnings and orders on how they should disseminate information in future wildfire events. For instance, the fact that a significant proportion of respondents received evacuation warning messages from social media should encourage more emergency managers to adopt social media as a means for information dissemination. Also, that most respondents made some intermediate trips before evacuation suggests evacuation clearance time can be longer than what simplified traffic simulation models predict. In addition, the findings on transportation decisions could be utilized in future events to give recommendations to evacuating residents on which routes they should take as well as destinations available to them.
References
-
Bontke, J. (2022, January 3). Boulder County Sheriff's Office narrows down where Marshall Fire started. Denver7. https://www.thedenverchannel.com/news/local-news/boulder-county-sheriffs-office-narrows-down-where-marshall-fire-started ↩
-
Sullivan, B. (2022, January 1). Snow puts out Colorado wildfires with 3 people missing and nearly 1,000 homes burned. NPR. https://www.npr.org/2022/01/01/1069639530/colorado-wildfire-missing ↩
-
Kramer, H. A., Mockrin, M. H., Alexandre, P. M., Stewart, S. I., & Radeloff, V. C. (2018). Where wildfires destroy buildings in the US relative to the wildland–urban interface and national fire outreach programs. International Journal of Wildland Fire 2018, 27, 329–341. https://doi.org/10.1071/WF17135 ↩
-
Radeloff, V. C., Helmers, D. P., Kramer, H. A., Mockrin, M. H., Alexandre, P. M., Bar-Massada, A., Butsic, V., Hawbaker, T. J., Martinuzzi, S., Syphard, A. D., & Stewart, S. I. (2018). Rapid growth of the US wildland-urban interface raises wildfire risk. Proceedings of the National Academy of Sciences, 115(13), 3314–3319. https://doi.org/10.1073/pnas.1718850115 ↩
-
Verisk Analytics (2021). Verisk Wildfire Risk Analysis. Retrieved January 6, 2022, from https://www.verisk.com/insurance/campaigns/location-fireline-state-risk-report/ ↩
-
Comfort, L., Soga, K., Stacey, M., McElwee, M., Ecosse, C., Dressler, J., & Zhao, B. (2019). Collective Action in Communities Exposed to Recurring Hazards: The Camp Fire, Butte County, California, November 8, 2018. Natural Hazards Center Quick Response Grant Report Series, 300. https://hazards.colorado.edu/quick-response-report/collective-action-in-communities-exposed-to-recurring-hazards ↩
-
Kuligowski, E. D. (2021). Evacuation decision-making and behavior in wildfires: Past research, current challenges and a future research agenda. Fire Safety Journal, 120, 103129. https://doi.org/10.1016/j.firesaf.2020.103129 ↩
-
Kuligowski, E. D., Walpole, E. H., Lovreglio, R., & McCaffrey, S. (2020). Modelling evacuation decision-making in the 2016 Chimney Tops 2 fire in Gatlinburg, TN. International Journal of Wildland Fire, 29(12), 1120–1132. https://doi.org/10.1071/WF20038 ↩
-
Kuligowski, E. D., Zhao, X., Lovreglio, R., Xu, N., Yang, K., Westbury, A., Nilsson, D., & Brown, N. (2021). Modeling evacuation decisions in the 2019 Kincade fire in California. Safety Science, 146, 105541. https://doi.org/10.1016/j.ssci.2021.105541 ↩
-
McLennan, J., Elliott, G., Omodei, M., & Whittaker, J. (2013). Householders’ safety-related decisions, plans, actions and outcomes during the 7 February 2009 Victorian (Australia) wildfires. Fire Safety Journal, 61, 175–184. https://doi.org/10.1016/j.firesaf.2013.09.003 ↩
-
Strahan, K., & Watson, S. J. (2019). The protective action decision model: When householders choose their protective response to wildfire. Journal of Risk Research, 22(12), 1602–1623. https://doi.org/10.1080/13669877.2018.1501597 ↩
-
Whittaker, J., Taylor, M., & Bearman, C. (2020). Why don’t bushfire warnings work as intended? Responses to official warnings during bushfires in New South Wales, Australia. International Journal of Disaster Risk Reduction, 101476. https://doi.org/10.1016/j.ijdrr.2020.101476 ↩
-
McCaffrey, S., Wilson, R., & Konar, A. (2018). Should I Stay or Should I Go Now? Or Should I Wait and See? Influences on Wildfire Evacuation Decisions: Should I Stay or Should I Go Now? Risk Analysis, 38(7), 1390–1404. https://doi.org/10.1111/risa.12944 ↩
-
Mozumder, P., Raheem, N., Talberth, J., & Berrens, R. P. (2008). Investigating intended evacuation from wildfires in the wildland–urban interface: Application of a bivariate probit model. Forest Policy and Economics, 10(6), 415–423. https://doi.org/10.1016/j.forpol.2008.02.002 ↩
-
Wong, S. D., Broader, J., Walker, J. L., & Shaheen, S. A. (2022). Understanding California Wildfire Evacuee Behavior and Joint Choice-Making. Transportation. https://doi.org/10.1007/s11116-022-10275-y ↩
-
Toledo, T., Marom, I., Grimberg, E., & Bekhor, S. (2018). Analysis of evacuation behavior in a wildfire event. International Journal of Disaster Risk Reduction, 31, 1366–1373. https://doi.org/10.1016/j.ijdrr.2018.03.033 ↩
-
Folk, L. H., Kuligowski, E. D., Gwynne, S., & Gales, J. A. (2019). A provisional conceptual model of human behavior in response to wildland-urban interface fires. Fire technology, 55(5), 1619-1647. https://doi.org/10.1007/s10694-019-00821-z ↩
-
Lovreglio, R., Kuligowski, E., Gwynne, S., & Strahan, K. (2019). A modelling framework for householder decision-making for wildfire emergencies. International Journal of Disaster Risk Reduction, 41, 101274. https://doi.org/10.1016/j.ijdrr.2019.101274 ↩
-
Lindell, M. K., & Perry, R. W. (2012). The Protective Action Decision Model: Theoretical modifications and additional evidence. Risk Analysis, 32(4), 616–632. https://doi.org/10.1111/j.1539-6924.2011.01647.x ↩
-
McLennan, J., Paton, D., & Beatson, R. (2015). Psychological differences between south-eastern Australian householders’ who intend to leave if threatened by a wildfire and those who intend to stay and defend. International Journal of Disaster Risk Reduction, 11, 35–46. https://doi.org/10.1016/j.ijdrr.2014.11.008 ↩
-
Strawderman, L., Salehi, A., Babski-Reeves, K., Thornton-Neaves, T., & Cosby, A. (2012). Reverse 911 as a Complementary Evacuation Warning System. Natural Hazards Review, 13(1), 65–73. https://doi.org/10.1061/(ASCE)NH.1527-6996.0000059 ↩
-
Hasan, S., Ukkusuri, S., Gladwin, H., & Murray-Tuite, P. (2011). Behavioral Model to Understand Household-Level Hurricane Evacuation Decision Making. Journal of Transportation Engineering, 137(5), 341–348. https://doi.org/10.1061/(ASCE)TE.1943-5436.0000223 ↩
-
Huang, S.-K., Lindell, M. K., & Prater, C. S. (2016). Who Leaves and Who Stays? A Review and Statistical Meta-Analysis of Hurricane Evacuation Studies. Environment and Behavior, 48(8), 991–1029. https://doi.org/10.1177/0013916515578485 ↩
-
Brachman, M.L., Church, R., Adams, B., & Bassett, D. (2020). Wayfinding during a wildfire evacuation. Disaster Prevention and Management, 29(3), 249-265. https://doi.org/10.1108/DPM-07-2019-0216 ↩
-
Vo, T., Gilbert, D., & Prentzel, O. (2022, January 1). Marshall Fire officially becomes Colorado’s most destructive, with 991 homes and businesses burned, officials confirm. The Colorado Sun. https://coloradosun.com/2022/01/01/marshall-fire-snow-displaced-residents-power-outage/ ↩
-
Fischer, E., Wham, B., Dashti, S., Javernick-Will, A., Liel, A., Whelton, A., Berty, N., Klingaman, J., Metz, A., Ramos, J., & Rose, H. (2022). The 2021 Marshall Fire, Boulder County, Colorado. Geotechnical Extreme Events Reconnaissance Association, Version 1.0. https://doi.org/10.18118/G6KT04 ↩
-
Boulder County. (2022, January 6). Boulder County releases updated list of structures damaged and destroyed in the Marshall Fire. https://bouldercounty.gov/news/boulder-county-releases-updated-list-of-structures-damaged-and-destroyed-in-the-marshall-fire/ ↩
-
Zialcita, P. (2022, January 19). Identity of final person missing from Marshall Fire confirmed as investigators uncover bone fragments. Colorado Public Radio. https://www.cpr.org/2022/01/19/identity-final-person-missing-marshall-fire-bone-fragments/ ↩
-
Helweg-Larsen, M. & Shepperd, J. A. (2001). Do Moderators of the Optimistic Bias Affect Personal or Target Risk Estimates? A Review of the Literature. Personality and Social Psychology Review 5(1), 74-95. http://dx.doi.org/10.1207/S15327957PSPR0501_5 ↩
-
Zhao, X., Lovreglio, R., Kuligowski, E., & Nilsson, D. (2021). Using artificial intelligence for safe and effective wildfire evacuations. Fire Technology, 57(2), 483-485. https://doi.org/10.1007/s10694-020-00979-x ↩
Forrister, A., Yan, X., Yin, Z., Zhao, X., Cova, T., Lovreglio, R., Nilsson, D., & Kuligowski, E. (2022). Survey of Evacuation Behavior in the 2021 Marshall Fire, Colorado (Natural Hazards Center Quick Response Research Report Series, Report 349). Natural Hazards Center, University of Colorado Boulder. https://hazards.colorado.edu/quick-response-report/survey-of-evacuation-behavior-in-the-2021-marshall-fire-colorado